
Understanding technical indicators is crucial for successful Forex trading.
These mathematical tools transform price data into visual insights about direction, momentum, and volatility—helping traders make informed, data-driven decisions.
Because there are so many indicators, beginners can easily feel overwhelmed.
This guide demystifies technical indicators, explaining how to use them effectively and how combining them with other tools can sharpen your strategy.
TL;DR – Mastering Technical Indicators in Forex
Technical indicators simplify price data into actionable signals.
This article focuses on three main types: Trend indicators, Momentum indicators, and Volatility indicators.
Each offers unique insights—trend for direction, momentum for strength, and volatility for market intensity.
By combining indicators with Japanese Candlesticks, Chart Patterns, and Support & Resistance, traders gain deeper confirmation and improved precision.
Table of Contents
- TL;DR – Mastering Technical Indicators in Forex
- Quick Reference Table: Core Technical Indicator Categories
- What Are Technical Indicators and How Do They Help?
- Trend Indicators: Understanding Market Direction
- Momentum Indicators: Measuring Market Strength
- Volatility Indicators: Reading Market Intensity
- Combining Indicators and Tools for Better Decisions
- Conclusion
- What’s the Next Step?
- Quiz: Understanding Technical Indicators in Forex
- Forex Trading Disclosure Statement
Quick Reference Table: Core Technical Indicator Categories
| Indicator Type | Primary Focus | Common Tools | What It Reveals |
| Trend Indicators | Market direction over time | Moving Averages, MACD | Confirms trend continuation or reversal |
| Momentum Indicators | Speed and strength of price moves | RSI, Stochastic Oscillator | Identifies overbought and oversold zones |
| Volatility Indicators | Magnitude of price fluctuations | Bollinger Bands, ATR | Measures volatility and breakout potential |
What Are Technical Indicators and How Do They Help?
Technical indicators act as a bridge between raw market data and actionable insights.
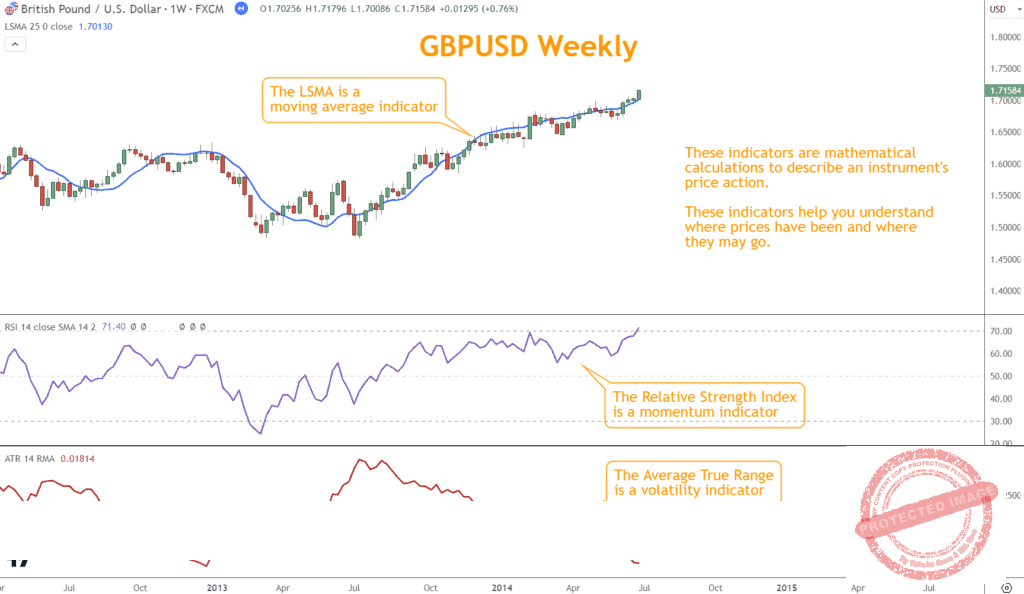
They are mathematical calculations based on price movements that produce visual signals—such as lines or oscillators—on a chart.
In Forex, they help traders identify potential market direction, reversals, and momentum.
There are four main indicator types: Trend, Momentum, Volatility, and Volume.
However, Volume indicators are less relevant in Forex because there’s no centralized exchange to measure trade volume accurately.
By mastering the other three types, traders can build a structured approach to evaluating market behavior and managing risk.
Trend Indicators: Understanding Market Direction
Trend indicators help smooth out price fluctuations and reveal the market’s overall direction across timeframes.
They help traders distinguish between trending and sideways conditions, reducing noise from short-term volatility.
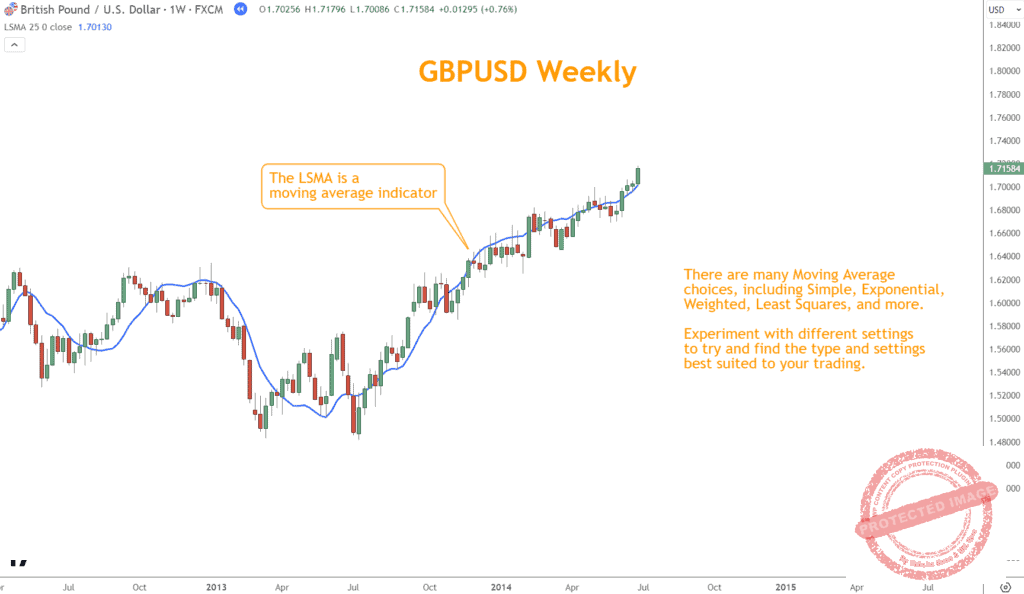
A foundational example is the Moving Average, which calculates the average price over a given number of periods to show the dominant direction.
Another is the Moving Average Convergence Divergence (MACD)—a dual-purpose indicator showing both trend direction and momentum.
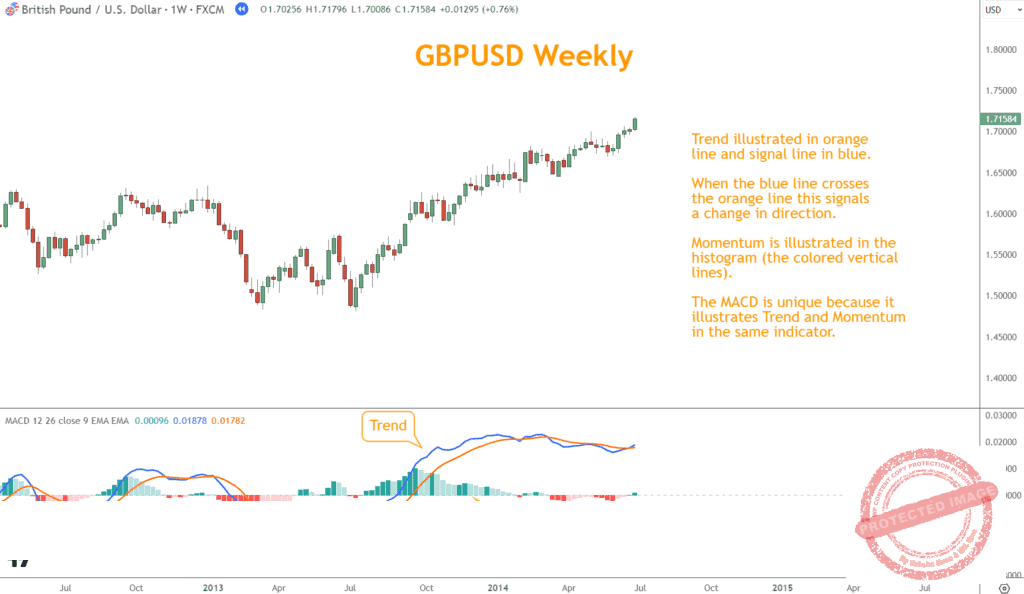
When the MACD line crosses above the signal line, it can signal bullish momentum; when it falls below, bearish momentum may be forming.
By incorporating Trend indicators, you gain a macro view of market structure—crucial for aligning your trades with the prevailing direction rather than trading against it.
Looking for a Strategy?
Download the Six Basics of Chart Analysis and sign up for Forex Forecast to learn a bottom-up approach to analyzing Forex markets and weekly market updates.
Momentum Indicators: Measuring Market Strength
Momentum indicators reveal the speed and intensity behind price movements.
They help determine whether a trend is likely to continue or weaken, allowing traders to enter or exit positions with better timing.
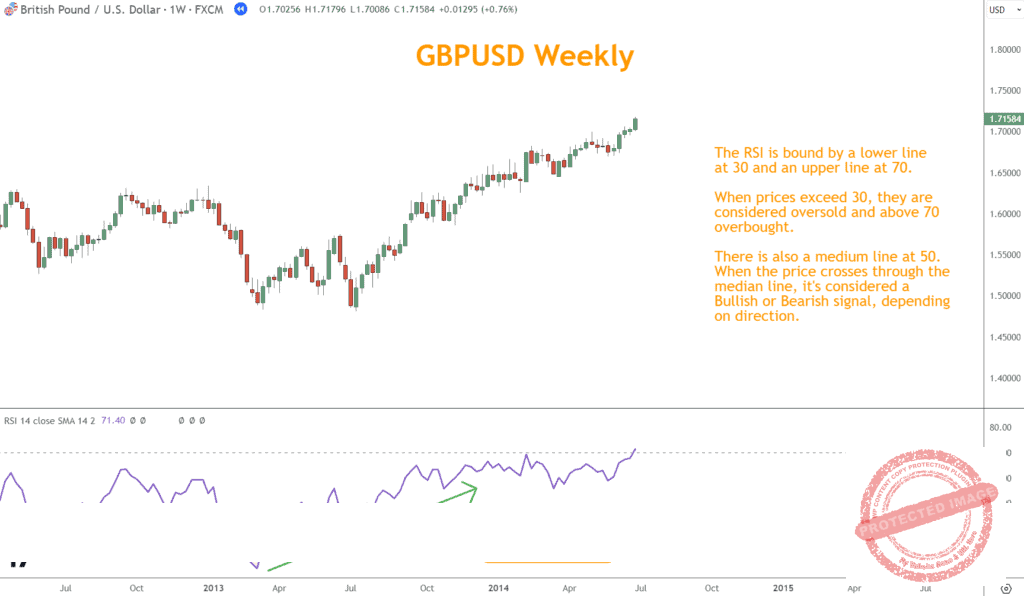
The Relative Strength Index (RSI) measures the magnitude of recent price changes to identify overbought (typically above 70) or oversold (below 30) conditions.
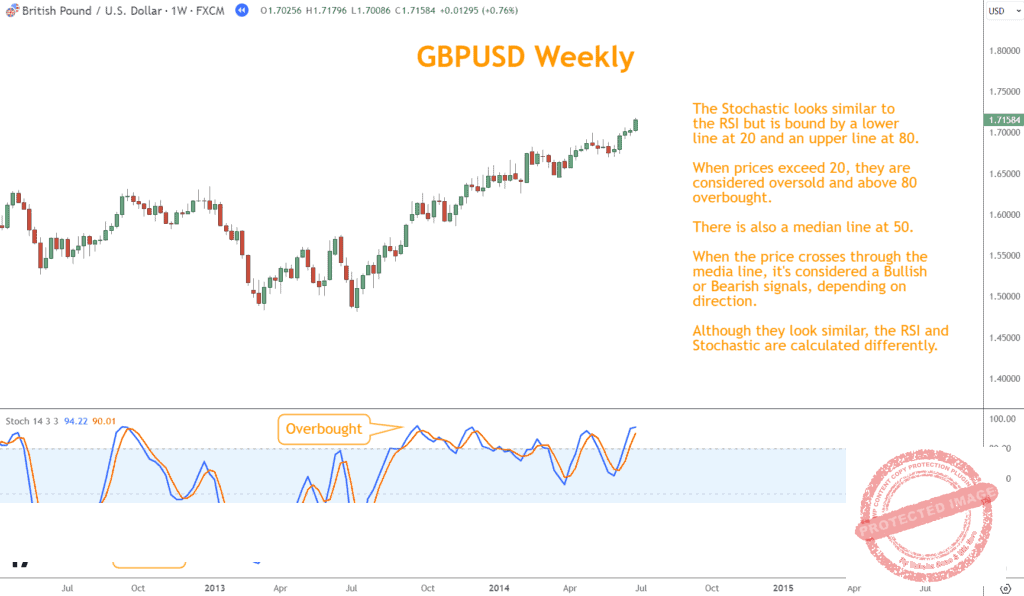
The Stochastic Oscillator compares a closing price to its recent range, also signaling potential reversals when prices deviate too far from their norm.
Momentum indicators are most effective when used with trend tools.
For example, a strong uptrend, confirmed by a bullish MACD crossover and an RSI above 50, can strengthen confidence in the continuation of the trade.
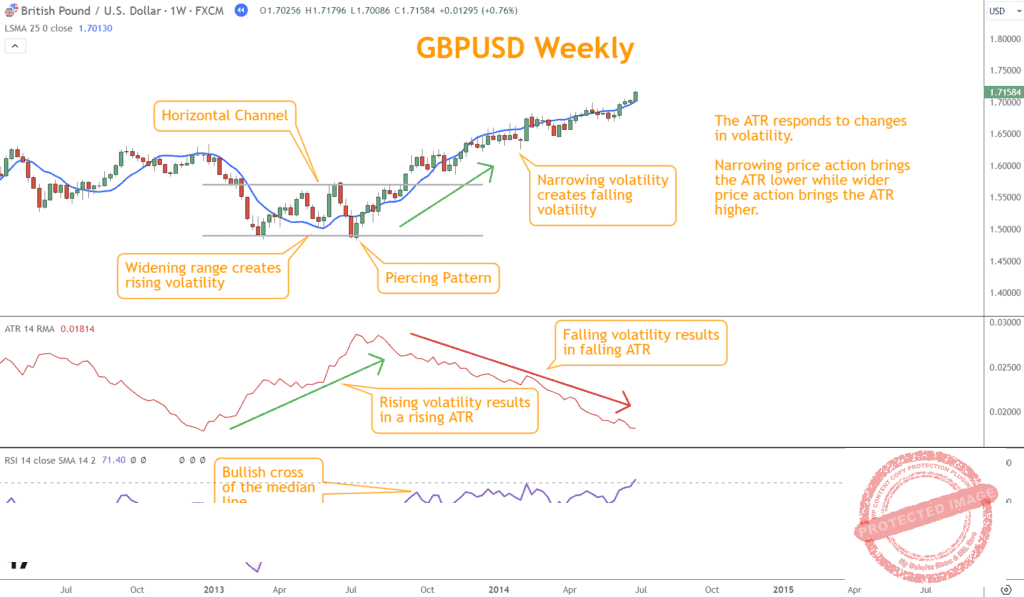
Volatility Indicators: Reading Market Intensity
Volatility indicators show how much price moves over time—a vital measure for setting stops, targets, and risk levels.
They help traders gauge whether the market is calm, consolidating, or ready for a breakout.
Bollinger Bands consist of three lines (upper, middle, lower) representing standard deviations from a moving average.
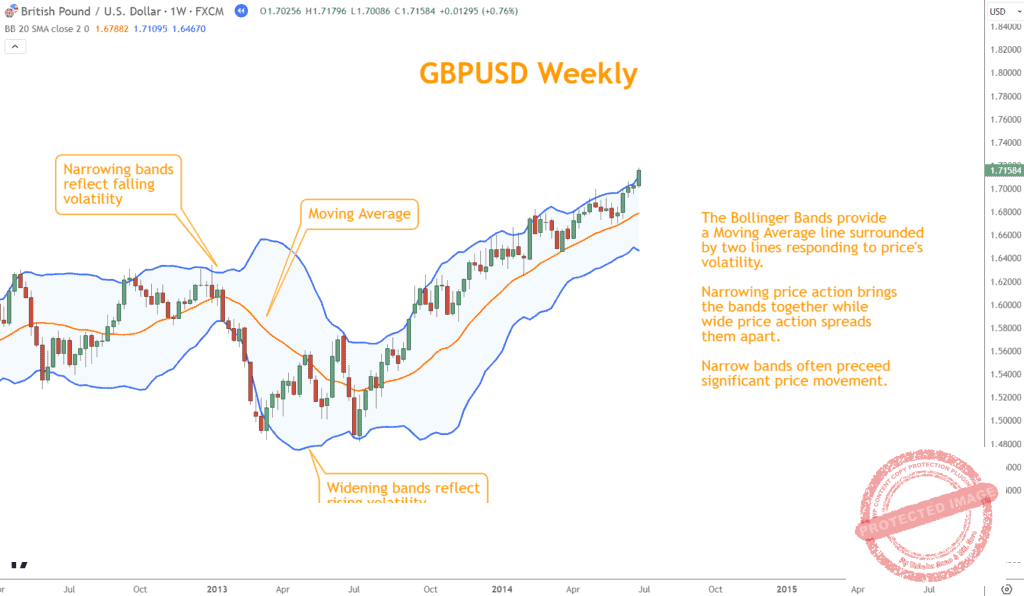
When the bands widen, volatility increases; when they narrow, the market is consolidating.
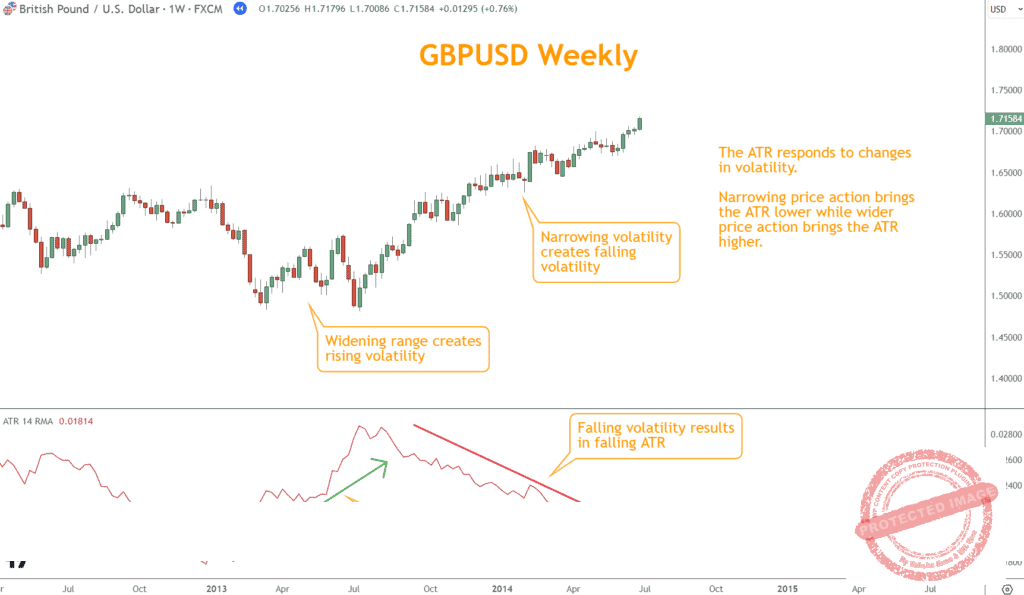
Similarly, the Average True Range (ATR) measures the average movement between highs and lows, helping you determine appropriate stop-loss distances.
By tracking volatility, traders can adjust position size and avoid overexposure during turbulent market periods.
Combining Indicators and Tools for Better Decisions
While technical indicators are powerful, they’re even more effective when combined with chart patterns, Japanese candlesticks, and support/resistance analysis.
Candlestick formations offer immediate visual cues about market sentiment.
Chart patterns such as Triangles or Head and Shoulders clarify likely breakouts or reversals. Support and resistance levels mark areas where price is expected to react.
Together, these methods create a multi-layered confirmation process. For example, a bullish RSI divergence near support, confirmed by a Hammer candlestick, provides a higher-probability signal than any indicator alone.
Integrating multiple tools enhances precision, reduces false signals, and strengthens overall trading confidence.
Conclusion
Mastering technical indicators is a cornerstone of successful Forex trading.
When you combine Trend, Momentum, and Volatility indicators with candlestick patterns, chart structures, and support/resistance, you develop a balanced framework for market analysis.
This integrated approach enables more accurate entries, better risk management, and greater consistency.
Developing expertise in interpreting these signals helps transform uncertainty into structured decision-making—turning trading into a disciplined practice rather than a guessing game.
What’s the Next Step?
Select a broker and apply what you’ve learned in this article to your trading plan.
Continue building your foundation with The Six Basics of Chart Analysis, a free guide from PositionForex.com that shows you how to analyze charts effectively.
When you download it, you’ll also receive Forex Forecast, a free weekly email covering:
- Trade ideas using the Six Basics
- Case studies from real-world examples
- Educational videos and guides
- New article links and webinar invites
- Exclusive trading tools and insights

All designed to strengthen your analytical edge—completely free.
Quiz: Understanding Technical Indicators in Forex
Questions
- What is the primary purpose of technical indicators in Forex trading?
a. To forecast economic events
b. To visualize and interpret price data
c. To eliminate risk entirely
d. To replace fundamental analysis - Which of the following indicators belongs to the Trend category?
a. RSI
b. MACD
c. Stochastic Oscillator
d. ATR - What do Momentum indicators primarily measure?
a. Market volume
b. Price volatility
c. Strength and speed of price movements
d. Average true range - Which indicator measures volatility by calculating the range between highs and lows?
a. MACD
b. ATR
c. RSI
d. Moving Average - Why is combining indicators with candlestick and chart analysis beneficial?
a. It guarantees profits
b. It confirms signals and reduces false entries
c. It replaces the need for trend analysis
d. It eliminates emotional trading completely
Answer Key
- b. To visualize and interpret price data
- b. MACD
- c. Strength and speed of price movements
- b. ATR
- b. It confirms signals and reduces false entries
Forex Trading Disclosure Statement
Risk Warning:
Forex trading involves significant risk and may not be suitable for all investors. The leveraged nature of Forex trading can work both for and against you, leading to substantial gains or losses. Before trading Forex, you should carefully consider your financial objectives, experience level, and risk tolerance. It is possible to lose more than your initial investment, and you should only trade with money you can afford to lose.
Market Risks and Volatility:
Forex markets are influenced by global economic, political, and social events, which can result in unpredictable price movements. High market volatility can lead to sudden and substantial changes in currency values, potentially causing losses that exceed your initial deposit.
Leverage Risks:
Leverage amplifies both potential gains and potential losses. While leverage can increase profitability, it also increases the risk of significant losses, including the loss of your entire trading capital.
Trading Tools and Technology Risks:
Forex trading platforms, including those offered by brokers, are subject to technology risks, such as system failures, latency issues, and potential errors in price feeds. Traders should be aware that these risks can impact the execution of trades and trading outcomes.
No Guarantee of Profitability:
Past performance in Forex trading is not indicative of future results. There is no guarantee that you will achieve profits or avoid losses when trading Forex. Market conditions and individual trading strategies vary, and no trading system can eliminate the inherent risks of Forex trading.
Educational Purposes Only:
Any information provided about Forex trading, including strategies, analysis, or market commentary, is for educational purposes only and should not be considered financial advice. Consult a qualified financial advisor or tax professional before making any trading decisions.
Regulatory Compliance:
Forex trading is regulated differently in various jurisdictions. Ensure that you are trading with a licensed and compliant broker in your country of residence.
Responsibility:
You are solely responsible for your trading decisions and the associated risks. It is your duty to understand the terms and conditions of Forex trading, including margin requirements, stop-losses, and other risk management tools.
Acknowledgment:
By engaging in Forex trading, you acknowledge that you have read, understood, and accepted this disclosure statement. You accept full responsibility for the outcomes of your trading decisions and agree to trade at your own risk.
This disclosure is intended to provide an overview of the risks associated with Forex trading and is not exhaustive. For additional information, consult your broker and other reliable financial resources.