
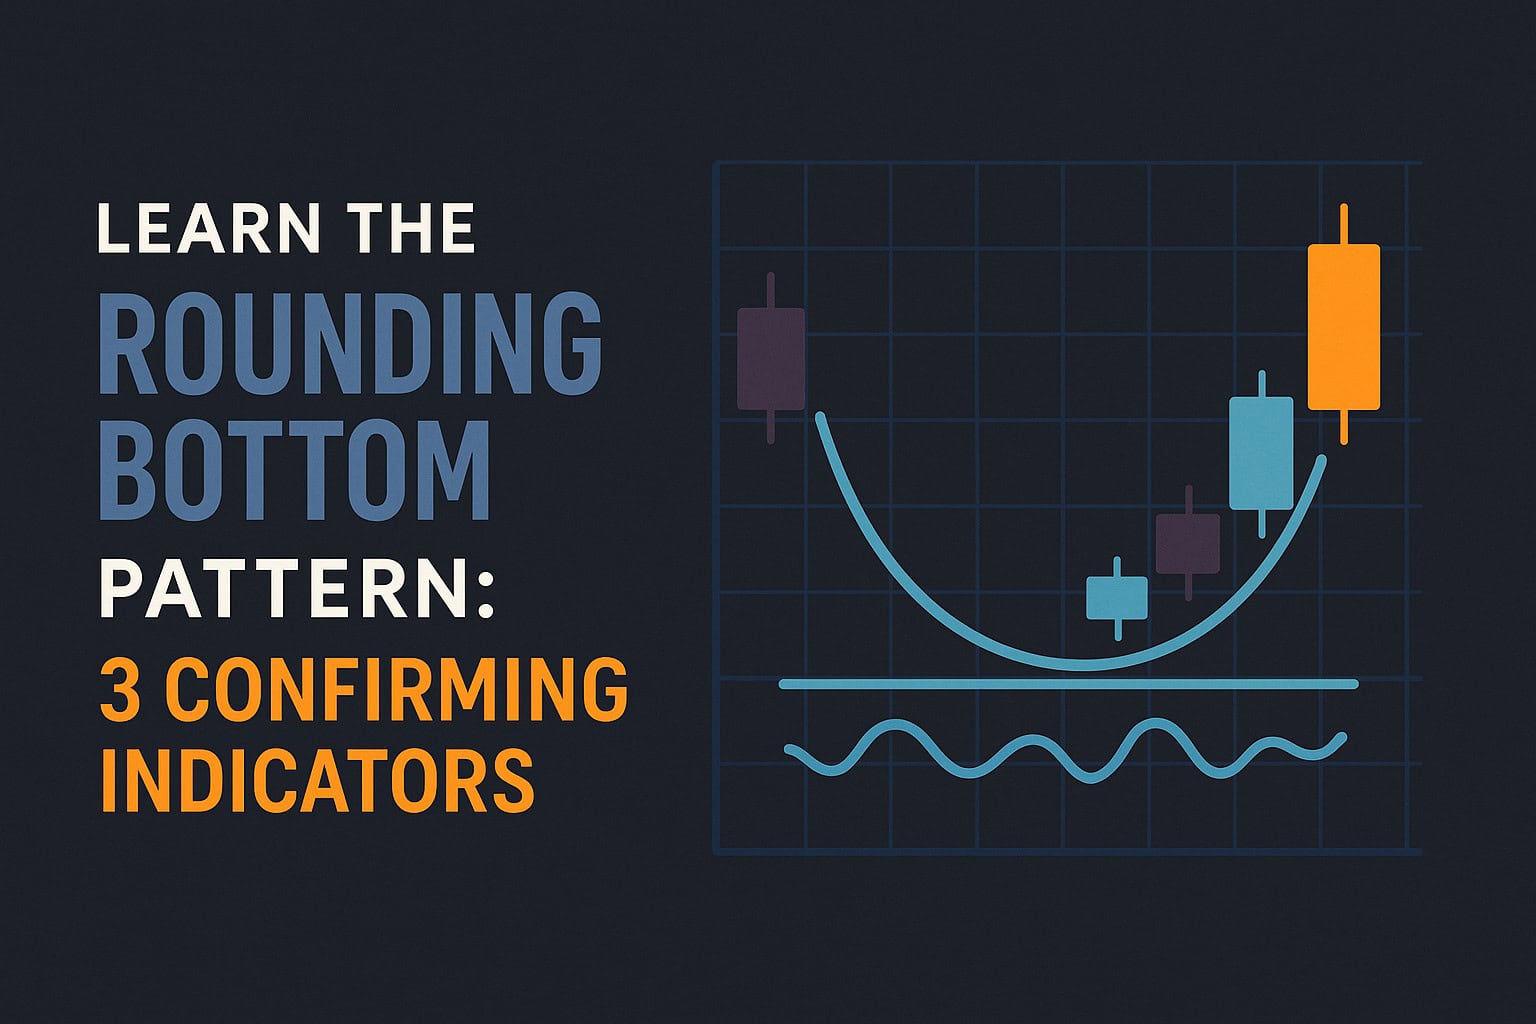
The Rounding Bottom pattern is a powerful technical formation that helps traders identify potential market reversals.
It often appears after a sustained selloff and signals a gradual shift in control from sellers to buyers.
More than just a visual curve on a chart, this pattern reflects underlying market psychology as momentum slows, stabilizes, and begins turning upward.
Traders often enhance this pattern with three key confirming indicators:
- Momentum tools,
- Japanese Candlesticks
- Support and Resistance levels
Together, these tools help validate whether a potential rally is gaining traction.
This guide explains how the Rounding Bottom works, how it contrasts with the Inverted Rounding Top, and how to combine it with confirming indicators for better trading insights.
Quick Reference Table: Rounding Bottom and Confirming Indicators
| Concept | Description | What It Signals | Confirmation Tools |
| Rounding Bottom | Gradual, rounded low after a Selloff | Potential Bullish reversal | Momentum, Candlesticks, Support/Resistance |
| Inverted Rounding Top | Gradual, rounded peak after a Rally | Potential Bearish reversal | Momentum, Candlesticks, Support/Resistance |
| Momentum Indicators | RSI or similar tools | Strength of the emerging trend | Confirms trend viability |
| Japanese Candlesticks | Visual representations of price action | Entry/exit timing | Reversal or continuation clues |
| Support & Resistance | Key price barriers | Areas of interest for trade levels | Helps refine entries, targets, and stops |
TL;DR – Rounding Bottom Pattern Essentials
This article teaches you the meaning and structure of the Rounding Bottom pattern and how it signals a possible shift from a selloff to a rally.
You will also learn:
- How Momentum indicators confirm the developing uptrend
- How Japanese Candlesticks support timing decisions
- How Support and Resistance levels strengthen analysis
- Why combining these tools gives traders a clearer view of market conditions
Use a charting platform to visually follow the pattern and see how these confirming tools align.
Table of Contents
- TL;DR – Rounding Bottom Pattern Essentials
- What Is a Rounding Bottom Chart Pattern?
- How to Incorporate Coincidental Technical Analysis Tools
- Conclusion
- What’s the Next Step?
- Frequently Asked Questions
- Quiz: Understanding the Rounding Bottom Pattern
- Forex Trading Disclosure Statement
What Is a Rounding Bottom Chart Pattern?
A Rounding Bottom forms after a period of downward movement when selling pressure gradually weakens.
This pattern shows a slow, rounded transition as price stabilizes before rising. The shape represents the market shifting from a seller-dominant phase to one in which buyers gradually regain control.
A simplified version of this pattern is illustrated below.
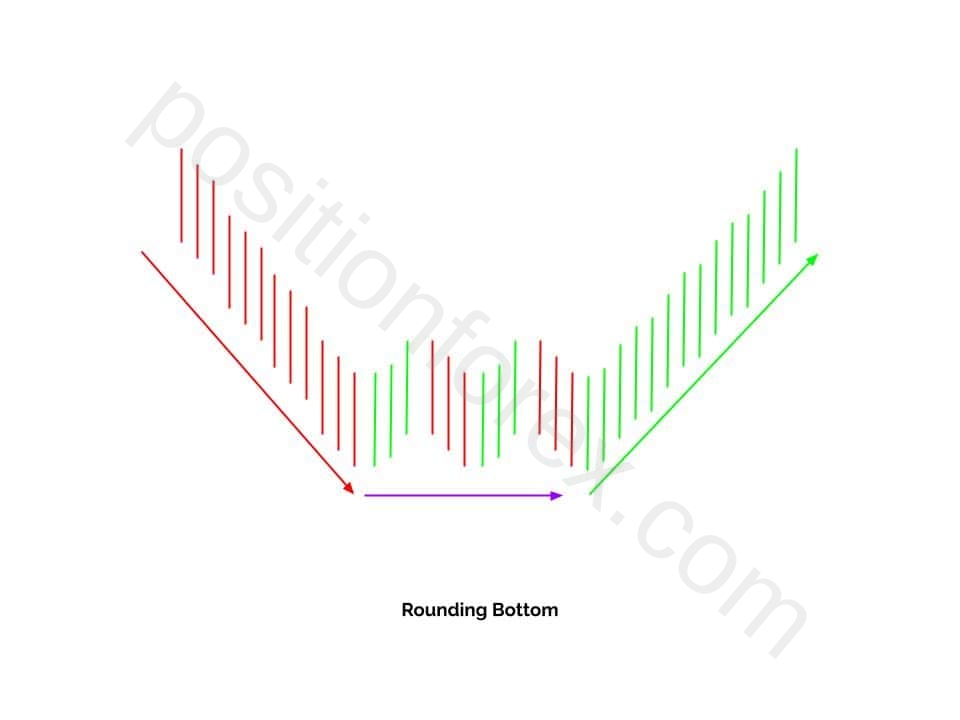
The pattern is defined by a smooth, rounded low rather than a sharp V-shaped reversal.
It reflects a gradual shift in sentiment. Traders view this pattern as a possible precursor to a bullish reversal, especially when other confirming tools support the shift.
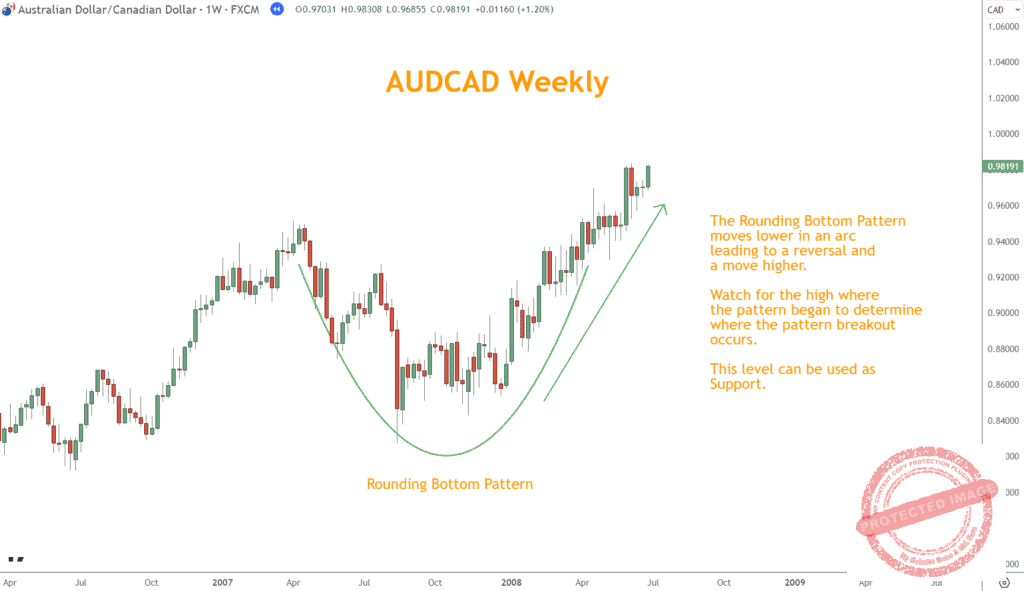
An example using AUD/CAD is illustrated below.
Directly opposite this formation is the Inverted Rounding Top, which appears at the end of a rally.
The idealized example is below.
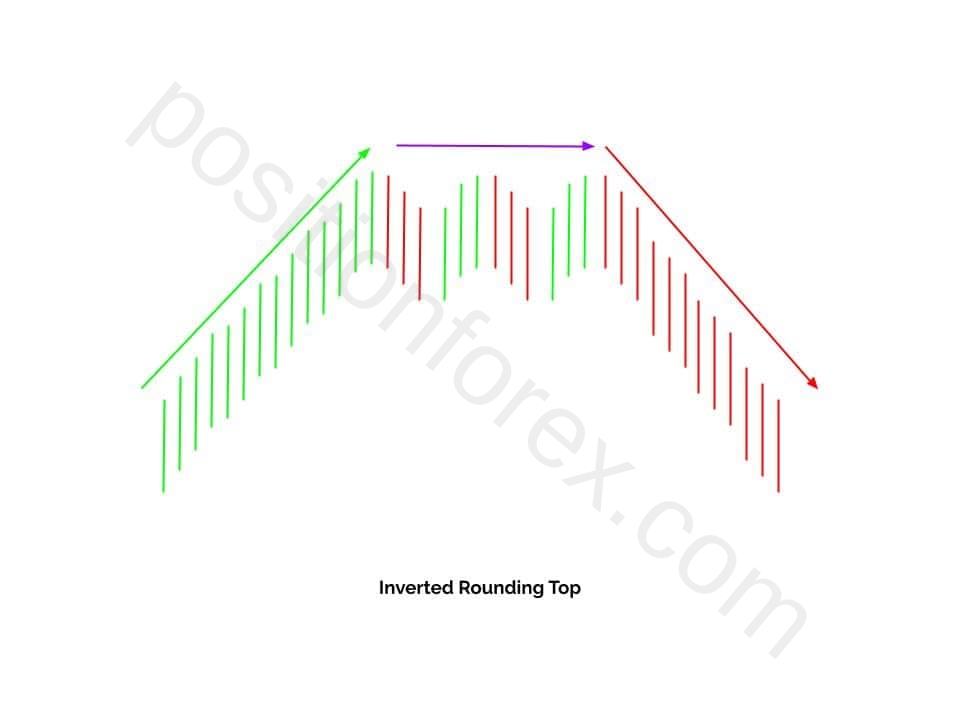
It reflects a gradual loss of buying interest, a rounded peak, and an emerging Selloff. Traders often watch for this pattern to identify potential Bearish reversals and selling opportunities.
The EUR/USD example below is a perfect illustration.
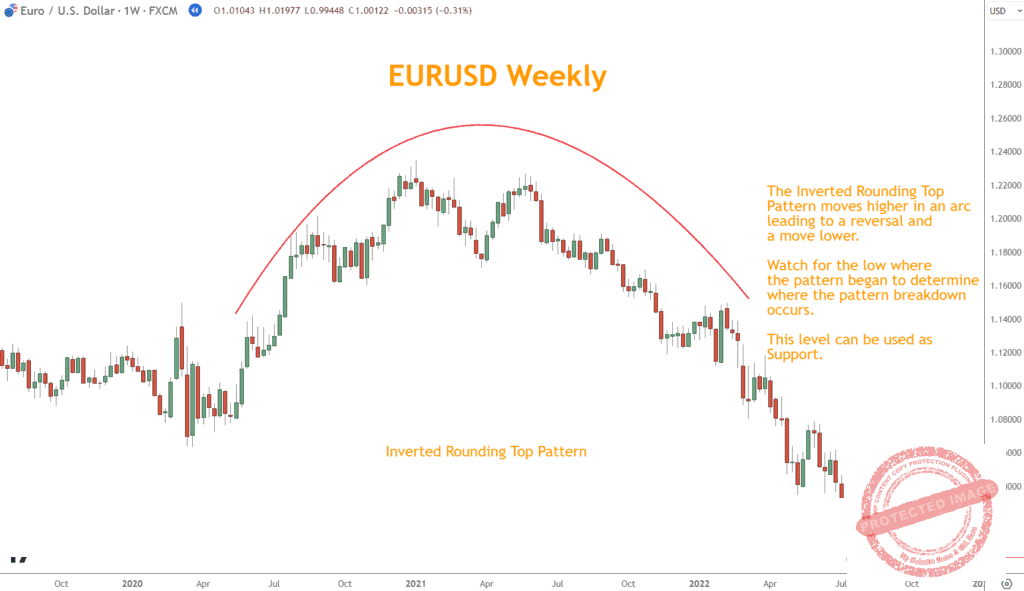
Both formations highlight the balance of buying and selling pressure.
In a Rounding Bottom, sellers lose control as buyers accumulate. In an Inverted Rounding Top, buyers weaken while sellers strengthen.
Looking for a Strategy?
Download the Six Basics of Chart Analysis and sign up for Forex Forecast to learn a bottom-up approach to analyzing Forex markets and weekly market updates.
How to Incorporate Coincidental Technical Analysis Tools
Using additional technical tools enhances the reliability of the Rounding Bottom.
These tools help confirm that the potential reversal is meaningful rather than temporary noise.
By combining Momentum indicators, Japanese Candlesticks, and Support and Resistance levels, traders build a clearer understanding of market structure.
Momentum Indicators
Momentum indicators like the Relative Strength Index (RSI) help validate whether the new uptrend following the Rounding Bottom has underlying strength.
In this AUD/CAD example, the RSI started moving higher as the pattern solidified a bottom.
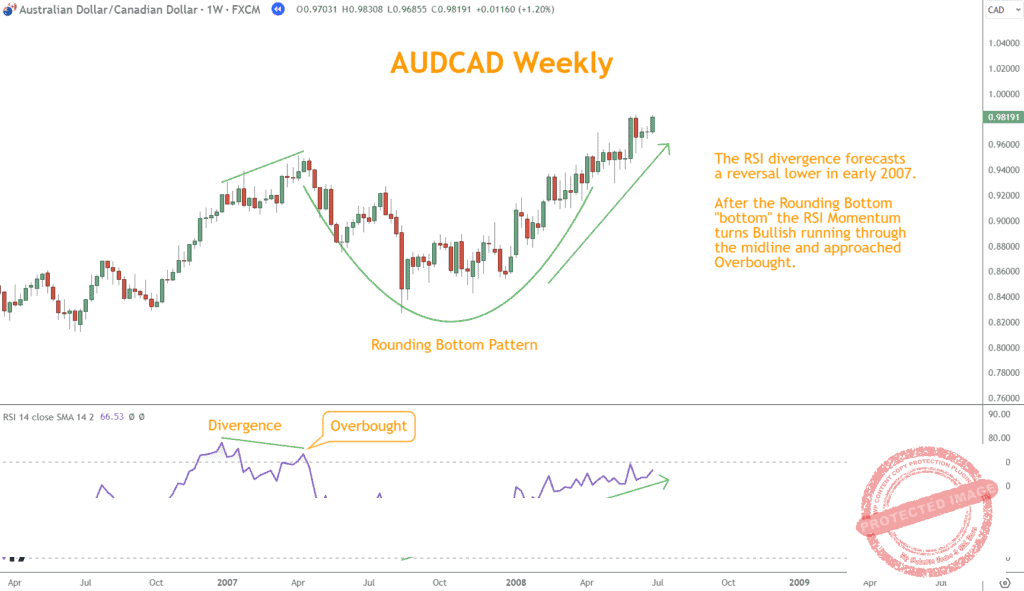
Traders use these tools to see if the price is gaining traction, supporting the idea of a sustainable Rally rather than a short-lived bounce.
Japanese Candlesticks
Candlesticks provide precise information about price behavior.
Their patterns reveal where buyers or sellers are taking control, making them valuable for identifying potential entry or exit points.
The Dark Cloud Cover pattern foreshadows a reversal lower, representing the beginning of the future pattern.
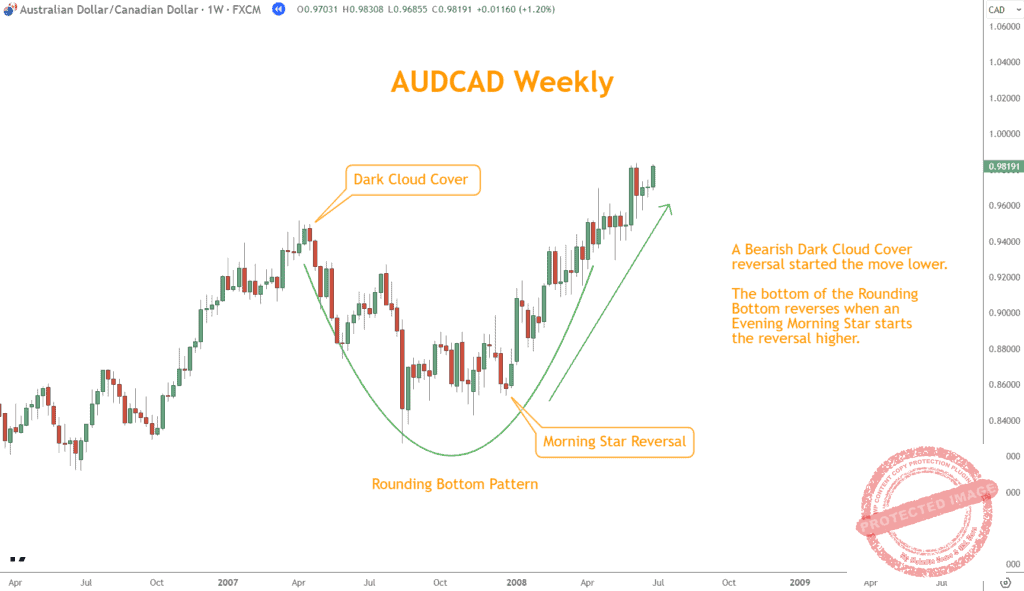
When candlestick formations align with the Rounding Bottom, they help traders time trades more effectively.
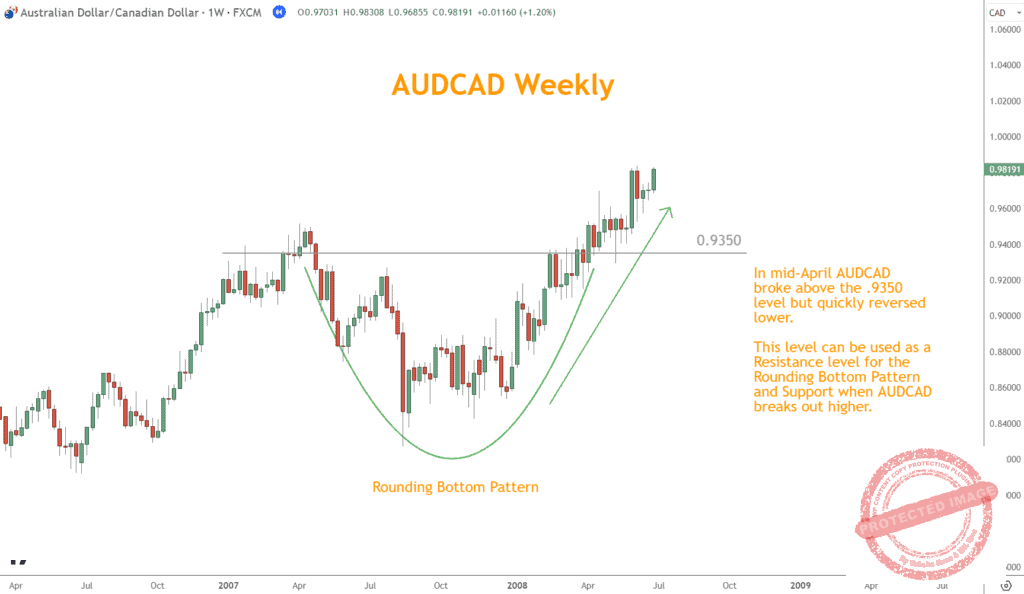
Support and Resistance Levels
Support and Resistance are essential for determining key price areas.
These levels act as barriers that influence price movement, helping traders set more accurate entry, exit, and risk-management targets.
When the Rounding Bottom aligns with strong levels, the pattern becomes more credible and actionable.
In this AUD/CAD example, the 0.9350 support and resistance levels confirm the pattern.
By combining these tools, traders gain a more holistic perspective of the market. This blend increases confidence and improves the accuracy of trading decisions based on the Rounding Bottom.
Conclusion
The Rounding Bottom pattern becomes far more effective when paired with confirming indicators.
Momentum tools, Japanese Candlesticks, and Support and Resistance levels collectively give traders a fuller view of market behavior. This combination clarifies market movement, increases signal reliability, and improves trading confidence.
By using these tools together, traders can better recognize emerging reversals and position themselves accordingly.
What’s the Next Step?
Start by opening your favorite chart and scanning for Rounding Bottom patterns.
Once identified, examine how they align with momentum indicators, candlestick behavior, and support or resistance zones. Viewing these elements together helps you understand how the market transitions from Selloff conditions to a potential rally.
If you want to develop a structured analysis process, download the free Six Basics of Chart Analysis. These foundational principles help you interpret patterns, such as the Rounding Bottom, more confidently and consistently.
When you access the Six Basics, you’ll also begin receiving Forex Forecast every Sunday. The newsletter includes:
- Trade ideas using the Six Basics
- Case studies from profitable setups
- Educational videos and guides
- Alerts to new articles
- Updates on PositionForex.com
- Invitations to free webinars
- Additional tools and member-only content

Everything is included at no cost.
Frequently Asked Questions
What is the significance of the Rounding Bottom Pattern in Forex trading?
The Rounding Bottom is essential because it suggests a possible shift from a selloff to a rally. When traders recognize this early, they may be able to participate in the beginning phases of a new Bullish move.
Is the Rounding Bottom Pattern reliable for predicting future price movements?
The pattern is helpful in technical analysis but not fully reliable on its own. Traders should use it alongside other technical tools and indicators to validate the signals it produces.
Quiz: Understanding the Rounding Bottom Pattern
- What does the Rounding Bottom pattern typically indicate?
a. A continuation of a selloff
b. A potential Bullish reversal
c. A neutral market with no direction
d. A guaranteed price breakout - What is the opposite of the Rounding Bottom pattern?
a. Cup and Handle
b. Inverted Rounding Top
c. Descending Triangle
d. Double Bottom - Why are Momentum indicators useful with the Rounding Bottom pattern?
a. They confirm the strength of the developing uptrend
b. They identify exact profit levels
c. They determine market volume
d. They replace all price analysis - How can Japanese Candlesticks help traders using the Rounding Bottom?
a. By generating automated trading signals
b. By providing insights into entry and exit timing
c. By removing the need for Support and Resistance
d. By predicting fundamental events - Why should Support and Resistance levels be used with the Rounding Bottom?
a. They guarantee profitable entries
b. They act as key price barriers that refine trade decisions
c. They eliminate the need for stop-losses
d. They predict economic news
Answer Key
- b
- b
- a
- b
- b
Forex Trading Disclosure Statement
Risk Warning:
Forex trading involves significant risk and may not be suitable for all investors. The leveraged nature of Forex trading can work both for and against you, leading to substantial gains or losses. Before trading Forex, you should carefully consider your financial objectives, experience level, and risk tolerance. It is possible to lose more than your initial investment, and you should only trade with money you can afford to lose.
Market Risks and Volatility:
Forex markets are influenced by global economic, political, and social events, which can result in unpredictable price movements. High market volatility can lead to sudden and substantial changes in currency values, potentially causing losses that exceed your initial deposit.
Leverage Risks:
Leverage amplifies both potential gains and potential losses. While leverage can increase profitability, it also increases the risk of significant losses, including the loss of your entire trading capital.
Trading Tools and Technology Risks:
Forex trading platforms, including those offered by brokers, are subject to technology risks, such as system failures, latency issues, and potential errors in price feeds. Traders should be aware that these risks can impact the execution of trades and trading outcomes.
No Guarantee of Profitability:
Past performance in Forex trading is not indicative of future results. There is no guarantee that you will achieve profits or avoid losses when trading Forex. Market conditions and individual trading strategies vary, and no trading system can eliminate the inherent risks of Forex trading.
Educational Purposes Only:
Any information provided about Forex trading, including strategies, analysis, or market commentary, is for educational purposes only and should not be considered financial advice. Consult a qualified financial advisor or tax professional before making any trading decisions.
Regulatory Compliance:
Forex trading is regulated differently in various jurisdictions. Ensure that you are trading with a licensed and compliant broker in your country of residence.
Responsibility:
You are solely responsible for your trading decisions and the associated risks. It is your duty to understand the terms and conditions of Forex trading, including margin requirements, stop-losses, and other risk management tools.
Acknowledgment:
By engaging in Forex trading, you acknowledge that you have read, understood, and accepted this disclosure statement. You accept full responsibility for the outcomes of your trading decisions and agree to trade at your own risk.
This disclosure is intended to provide an overview of the risks associated with Forex trading and is not exhaustive. For additional information, consult your broker and other reliable financial resources.