
Channel line basics are one of the most important—but frequently misused—tools in Forex technical analysis.
When applied correctly, channel lines help traders define market structure, identify trend direction, and anticipate where price is most likely to react. When applied incorrectly, they create false confidence, clutter charts, and lead to poor trade decisions.
This guide explains channel line basics from the ground up.
You’ll learn what channel lines are, how to draw them correctly, how they differ from simple trendlines, and how position traders use them to improve clarity and patience.
The goal is not prediction, but structure—understanding where price has been, how it is behaving now, and where meaningful decisions are likely to occur.
TL;DR — Channel Line Basics
- Channel lines define price structure, not predictions
- A valid channel requires at least two touchpoints and confirmation
- Channels help identify trend direction, pullbacks, and exhaustion
- They work best on higher timeframes used by position traders
- Channel lines should be combined with price action, momentum, and support/resistance
Table of Contents
- TL;DR — Channel Line Basics
- What Are Channel Lines?
- Channel Lines vs. Trendlines (Why the Difference Matters)
- The Three Types of Channel Structures
- How to Draw Channel Lines Correctly
- Why Channel Lines Are Areas, Not Exact Lines
- How Position Traders Use Channel Line Basics
- Channel Lines and Support & Resistance
- Common Mistakes with Channel Line Basics
- Why Channel Lines Work Better on Higher Timeframes
- Channel Lines vs. Indicators
- Conclusion
- What’s the Next Step?
- Five-Question Quiz: Channel Line Basics
- Forex Trading Disclosure Statement
What Are Channel Lines?
Channel lines are parallel lines drawn on a price chart to contain price movement within an established trend. Unlike a single trendline, a channel consists of two boundaries:
- A primary channel line (support in an uptrend, resistance in a downtrend)
- A parallel line marking the opposite side of price movement
Together, these lines form a price channel that visually represents how price is oscillating during a rally or selloff.
At their core, channel line basics are about structure.
They show how consistently price is respecting a directional move and whether that move remains healthy, weakening, or potentially breaking down.
Channel Lines vs. Trendlines (Why the Difference Matters)
Many traders confuse channel lines with trendlines. While related, they are not the same.
- Trendlines define direction
- Channel lines define direction and boundaries
A single trendline only tells you that price is moving higher or lower.
A channel tells you how price is behaving within that move—where pullbacks tend to stall, where rallies tend to exhaust, and whether momentum is expanding or contracting.
In a rally, the upper line is called the Resistance line, while the lower line is called the Support line.
For position traders, this distinction is critical. Channel lines provide context for risk, patience, and trade location, not just directional bias.
The Three Types of Channel Structures
Understanding channel line basics starts with recognizing the three primary channel types.
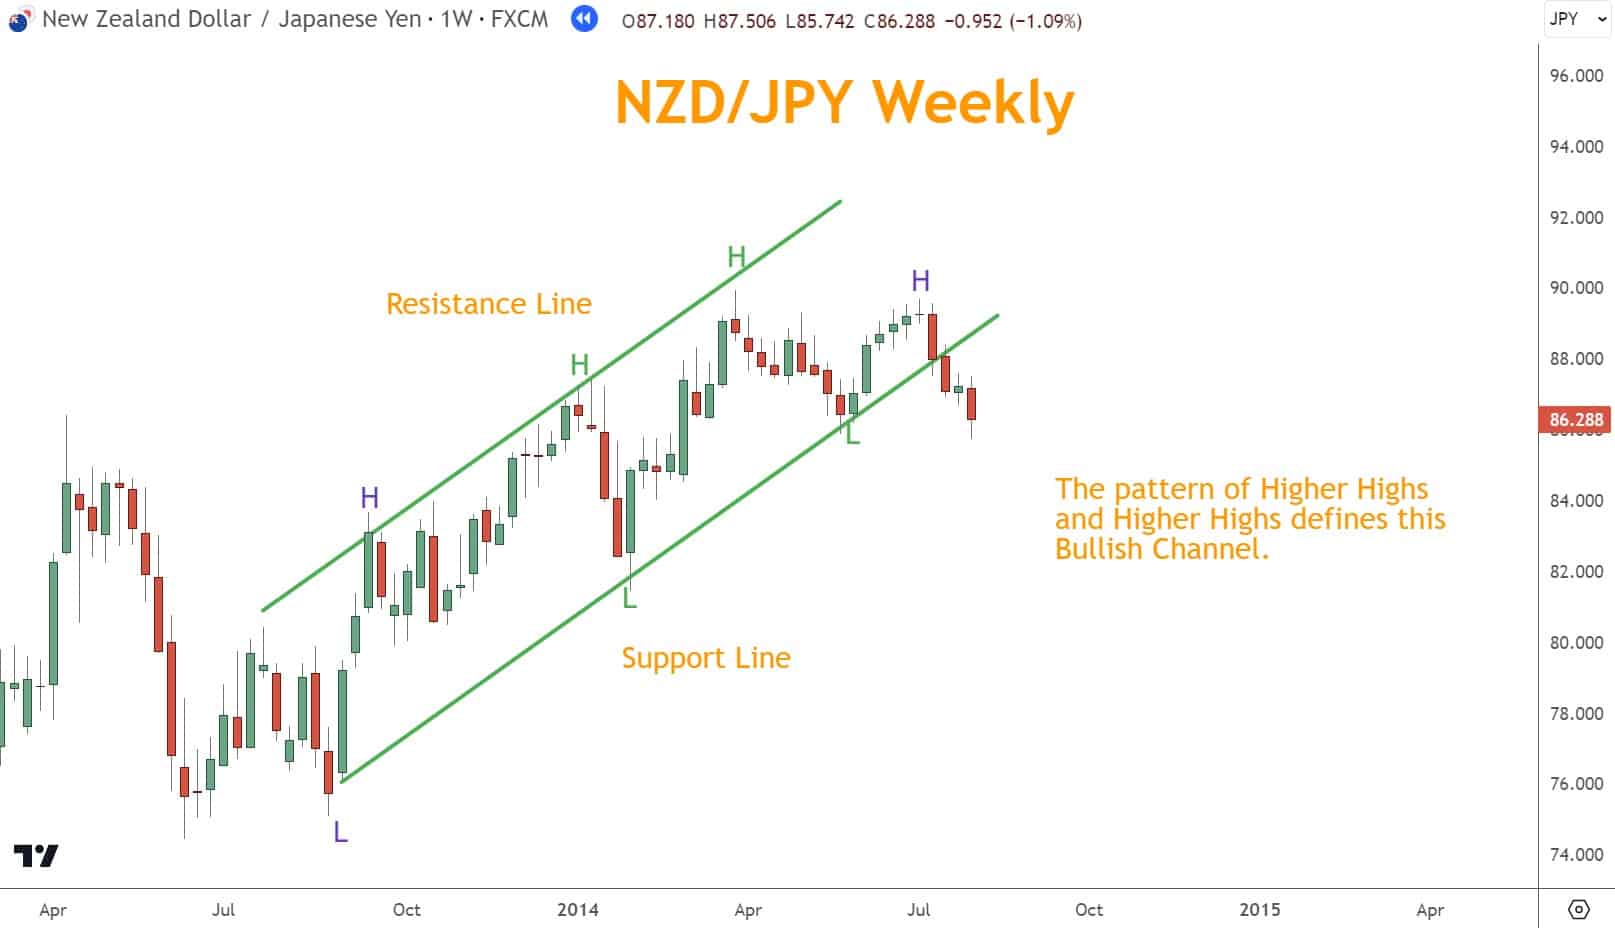
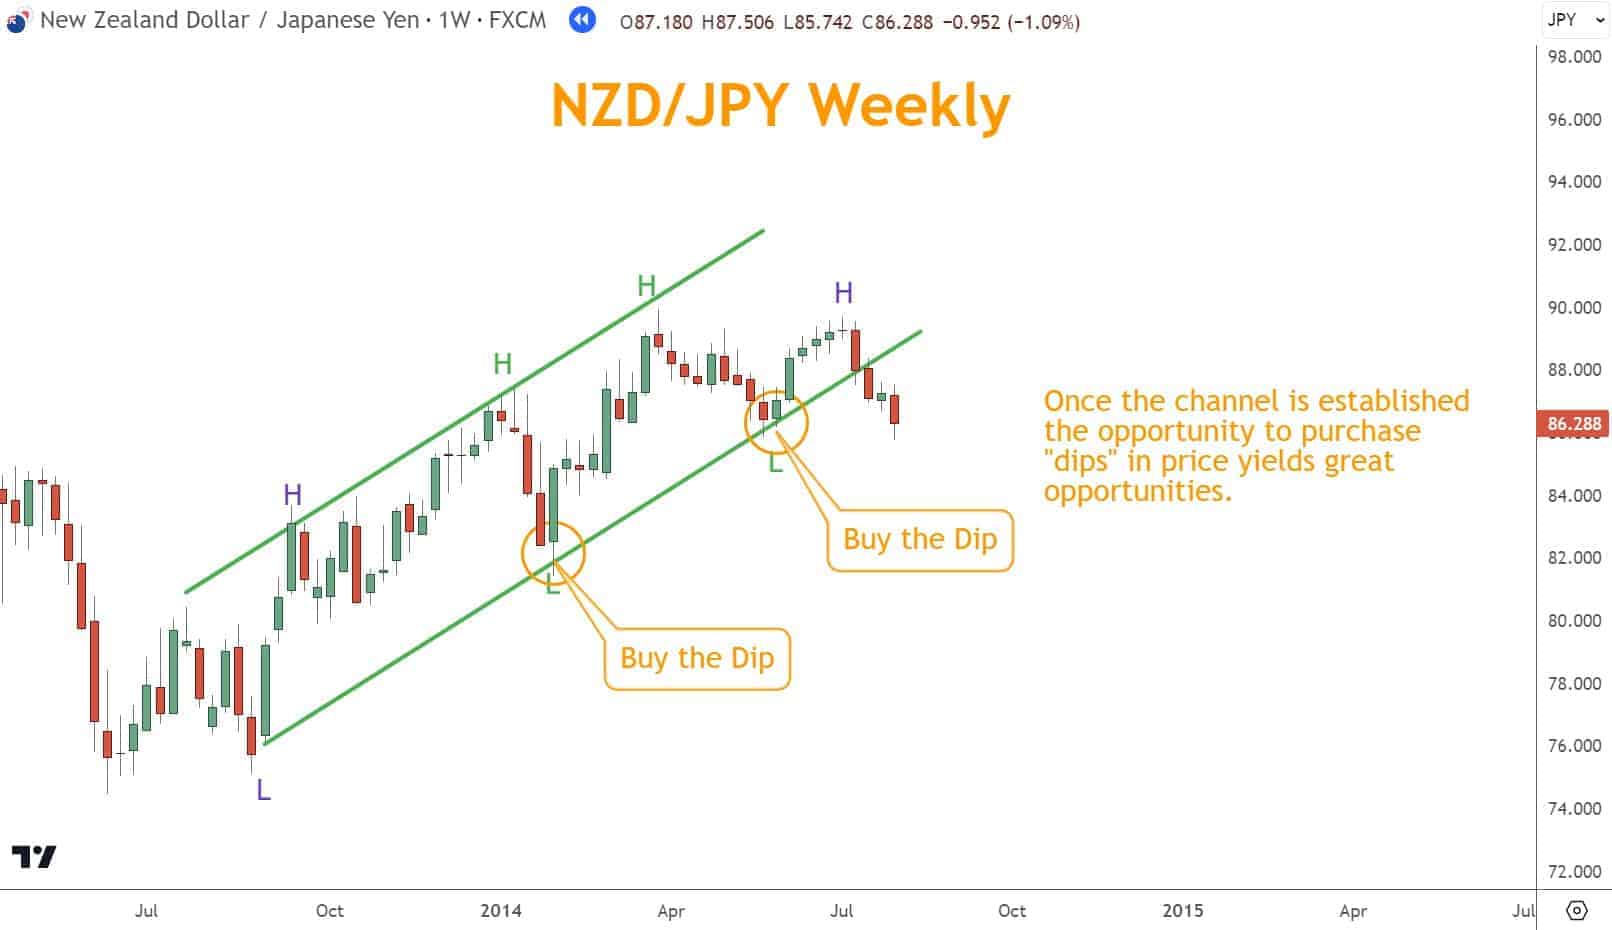
Ascending Channels (Bullish Structure)
- Higher highs and higher lows
- Lower boundary acts as support
- Upper boundary marks rally exhaustion
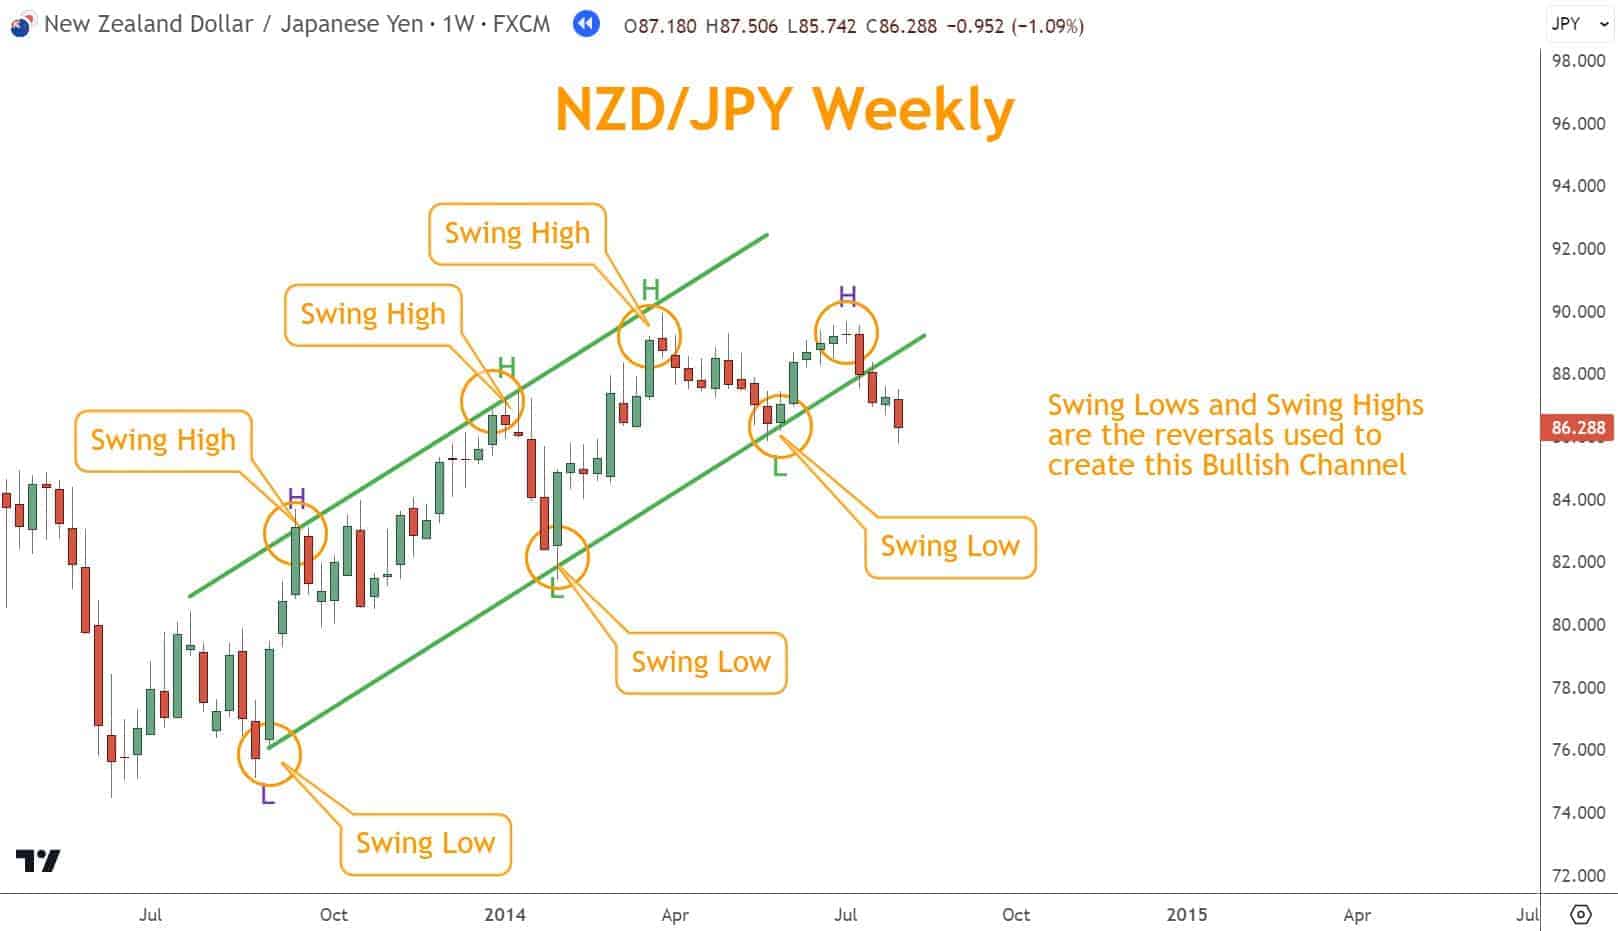
Ascending channels reflect healthy rallies where buyers remain in control, but price still pauses and corrects along the way.
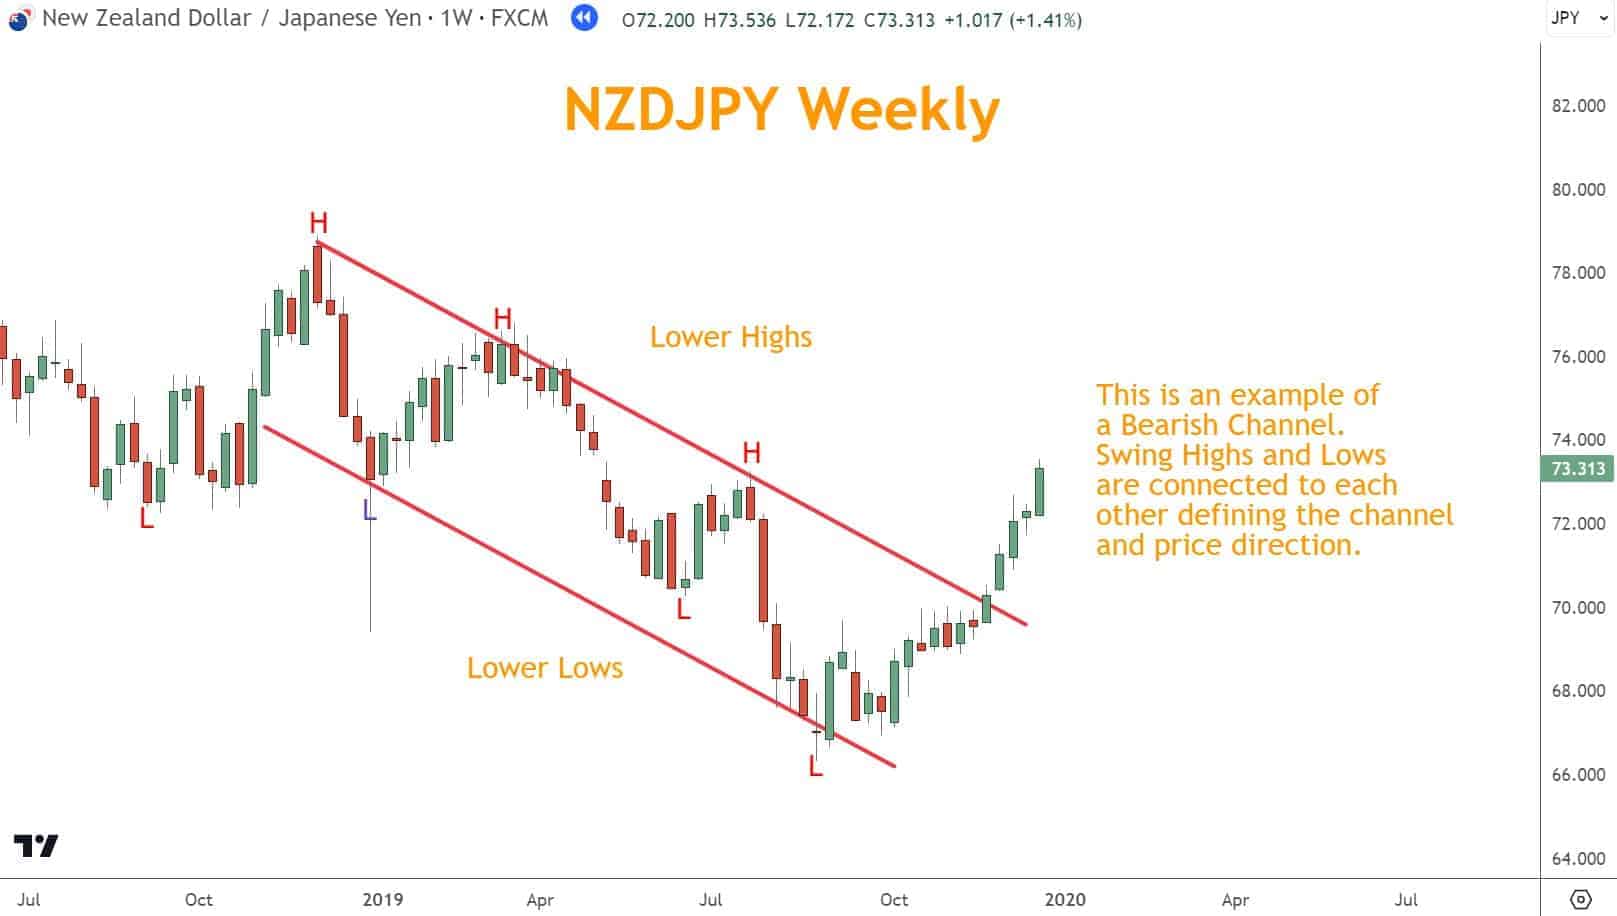
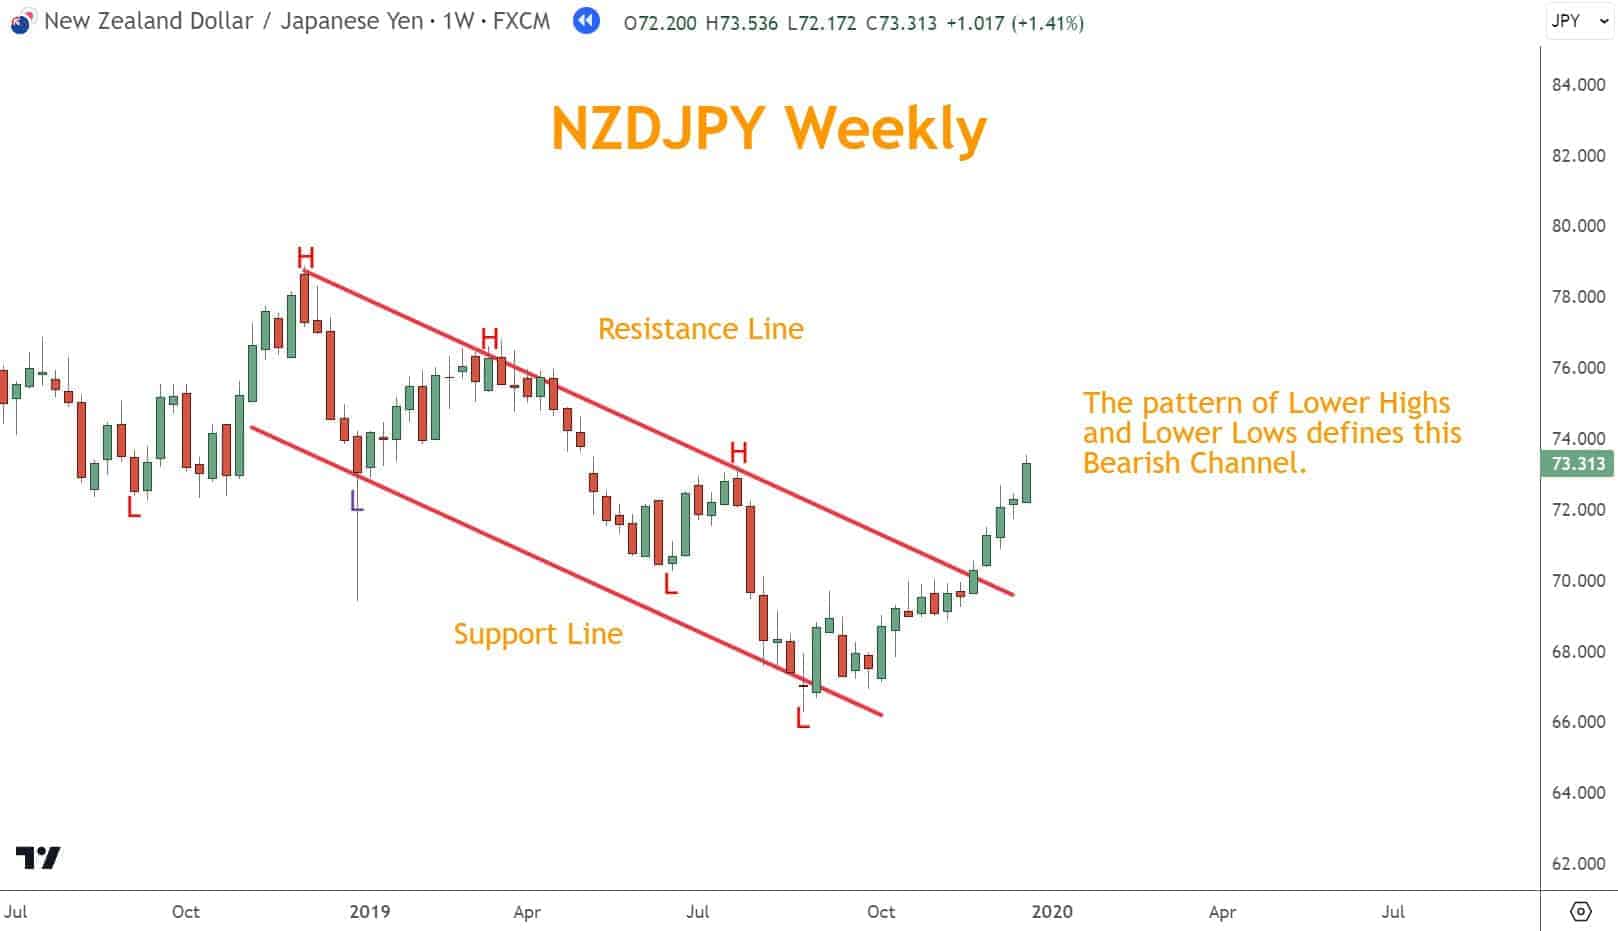
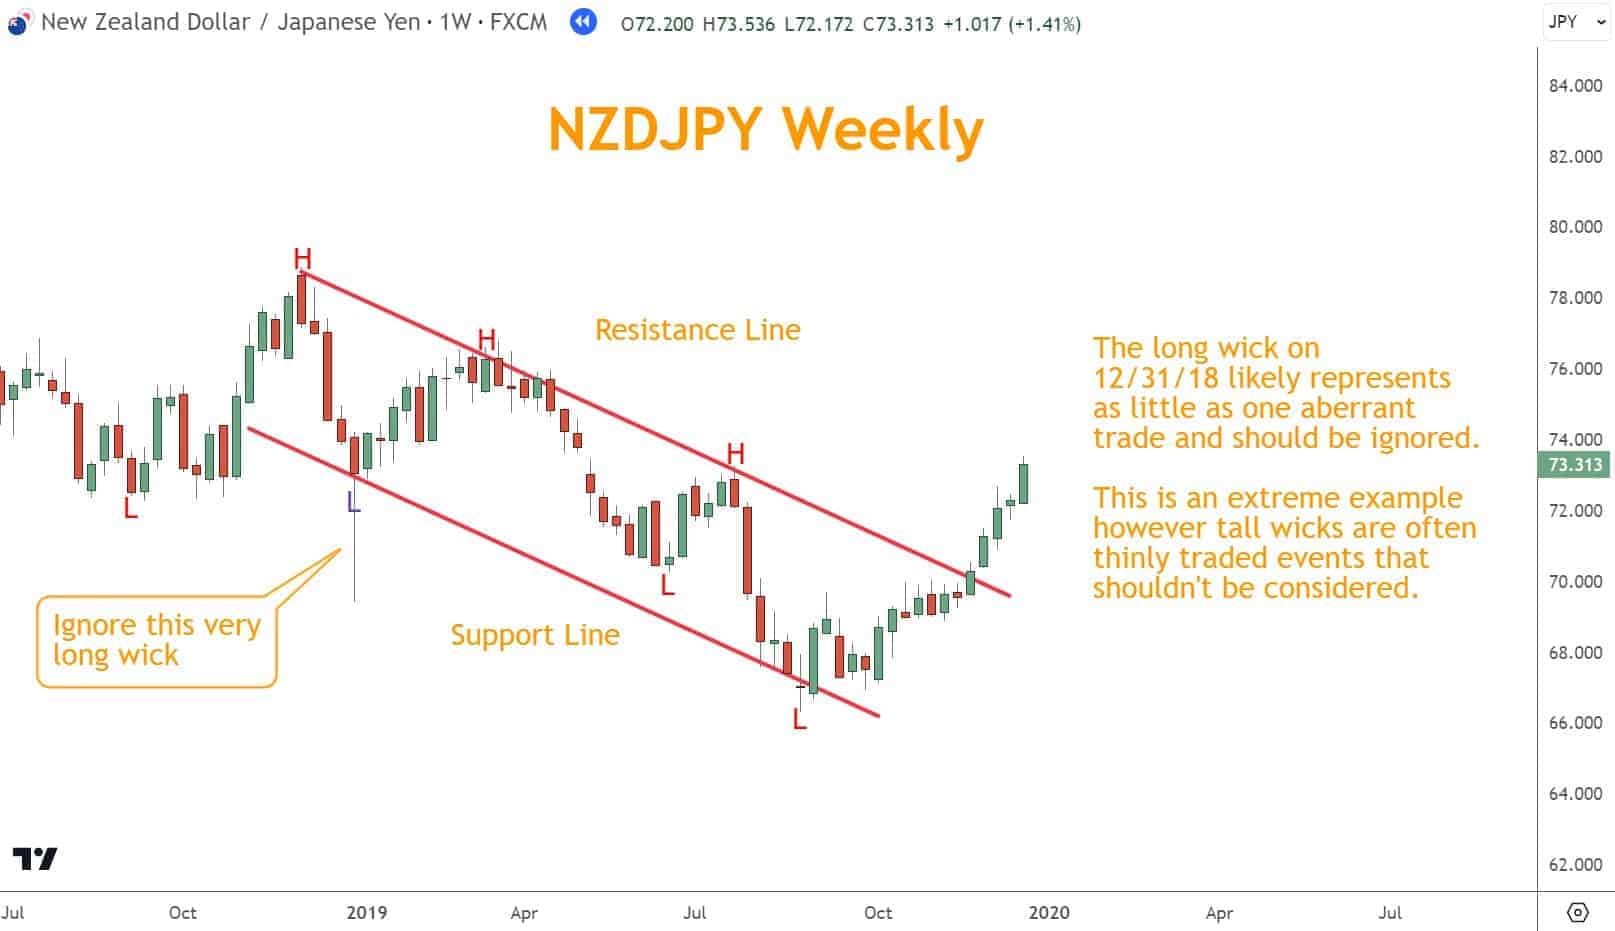
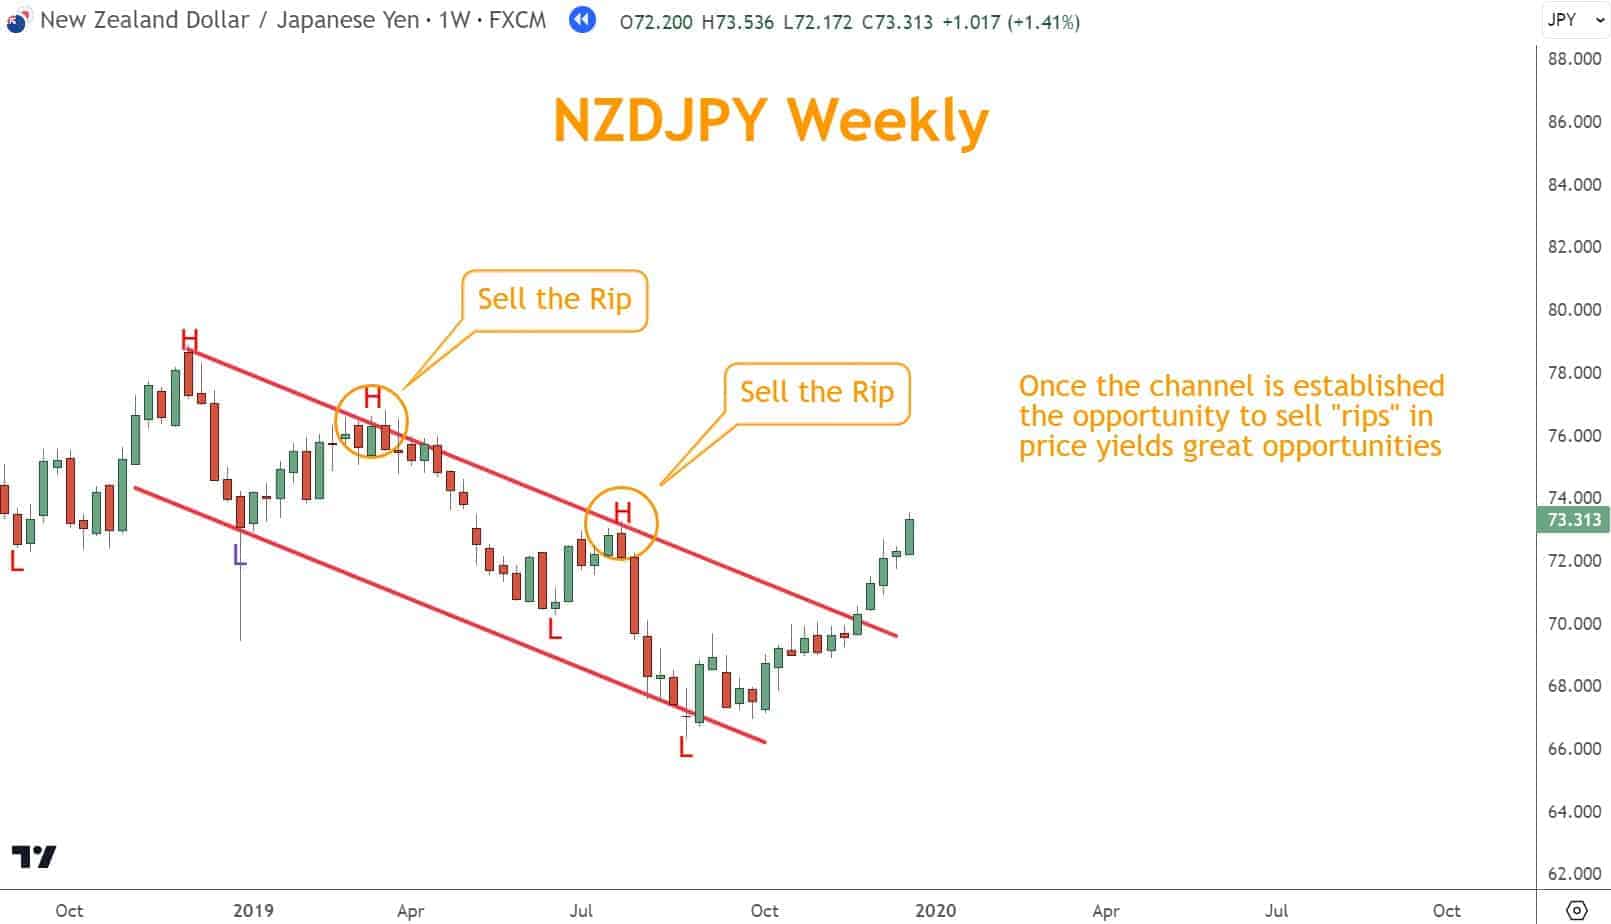
Descending Channels (Bearish Structure)
- Lower highs and lower lows
- Upper boundary acts as resistance
- Lower boundary marks selloff exhaustion
Descending channels reflect sustained selloffs with consistent supply pressure.
Horizontal Channels (Neutral Structure)
- Price oscillates between parallel support and resistance
- No directional trend
- Higher risk environment for trend-following strategies
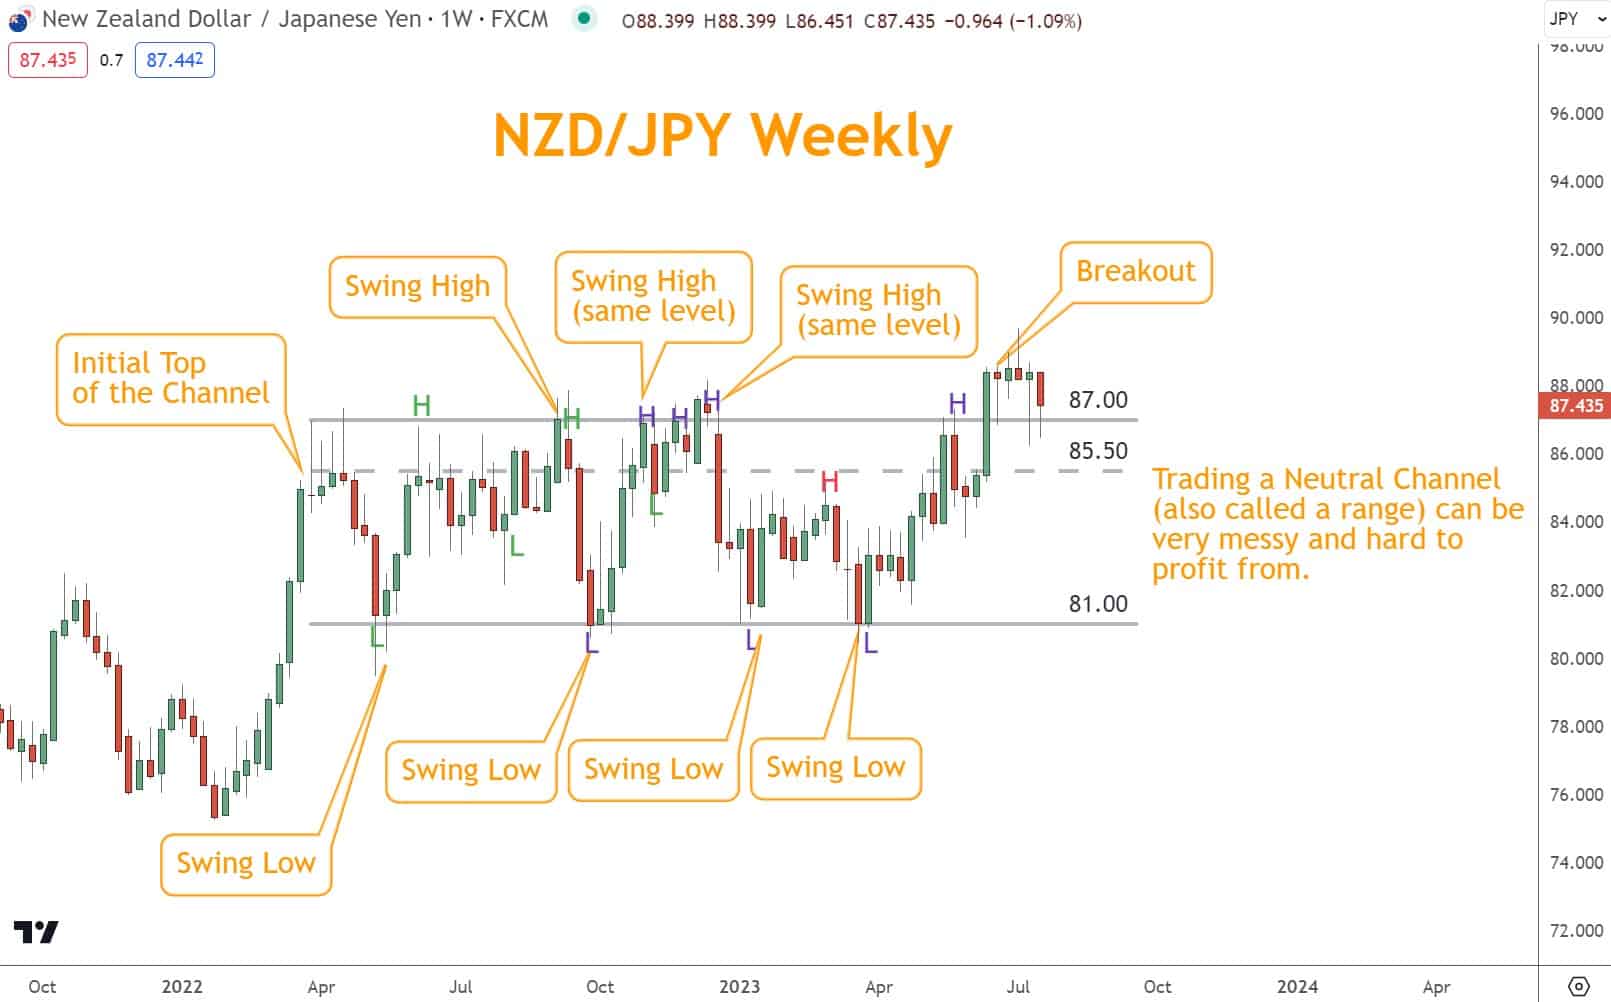
From a channel line basics perspective, horizontal channels are not trends. They require different tactics and carry more false signals.
How to Draw Channel Lines Correctly
Correct execution is the heart of channel line basics. Most mistakes come from forcing channels where none exist.
Step 1: Identify Market Direction
Before drawing anything, determine whether the market is:
- Rallying
- Selling off
- Neutral
Channels only work when price is trending.
Step 2: Draw the Primary Trendline
- In a Rally: connect two swing lows
- In a Selloff: connect two swing highs
These swings must be prominent, not minor intraday noise.
Step 3: Clone the Line to the Opposite Side
Create a parallel line that touches the opposite extreme of price. This second line confirms whether price is respecting a channel structure.
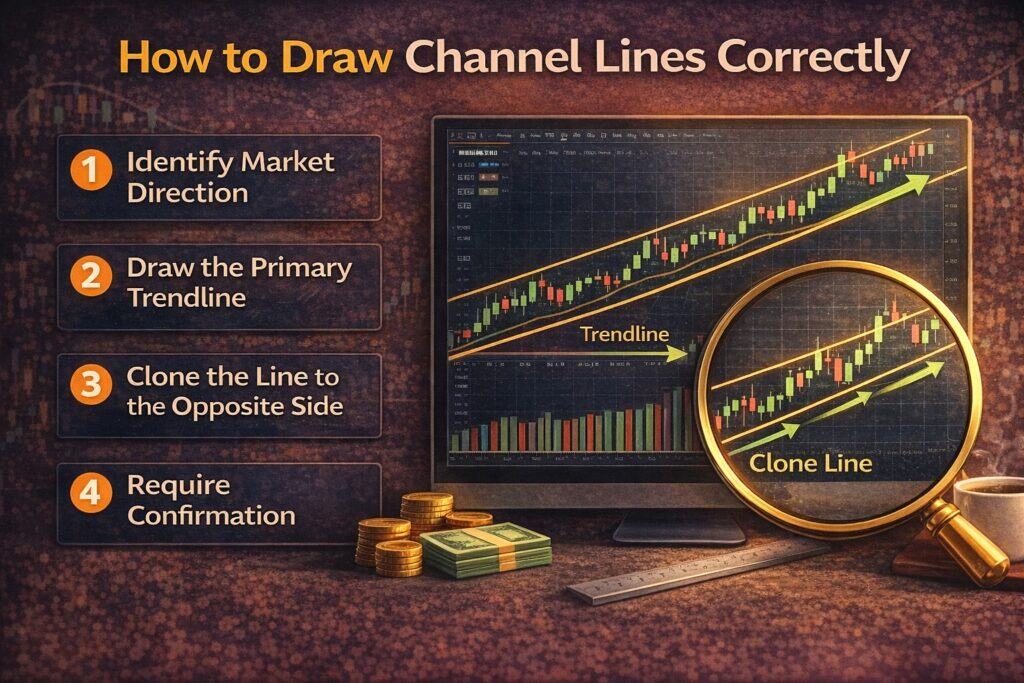
Step 4: Require Confirmation
A valid channel should show multiple touches across time. If price only touches each line once, the channel is not established.
Looking for a Strategy?
Download the Six Basics of Chart Analysis and sign up for Forex Forecast to learn a bottom-up approach to analyzing Forex markets and weekly market updates.
Why Channel Lines Are Areas, Not Exact Lines
One of the most overlooked channel line basics is that channels represent zones, not precise prices.
Forex markets are decentralized and noisy.
Price will often overshoot, undershoot, or briefly violate a channel boundary before returning to it. This does not invalidate the channel.
Position traders focus on reaction, not perfection. If price repeatedly responds near a boundary, the channel remains valid.
How Position Traders Use Channel Line Basics
Position traders rely on channel lines differently from short-term traders.
Defining Structure and Bias
Channels help answer a key question: Is the trend still intact?
As long as price remains within the channel, the dominant bias remains valid.
Identifying High-Quality Pullbacks
Pullbacks toward channel support (in rallies) or channel resistance (in selloffs) offer contextual trade locations, not signals on their own.
Conversely, in a selloff, the upper line is called the Support line, and the lower line is called the Resistance line.
Spotting Trend Exhaustion
Repeated failures to reach the opposite channel boundary often signal weakening momentum. This is not an automatic reversal signal—but it is valuable information.
Channel Lines and Support & Resistance
Channel line basics work best when channels intersect with horizontal support and resistance.
- A channel boundary that aligns with a major horizontal level is stronger
- Reactions at these intersections often define high-probability decision zones
This convergence helps traders avoid guessing and instead wait for price to show intent.
Common Mistakes with Channel Line Basics
|
Mistake |
Why It Fails |
|
Forcing channels |
Markets do not always trend |
|
Drawing on low timeframes |
Noise overwhelms structure |
|
Treating channels as exact |
Forex price is imprecise |
|
Using channels alone |
Lacks confirmation and context |
|
Trading every touch |
Structure ≠ signal |
Channel lines are analytical tools, not entry systems.
Why Channel Lines Work Better on Higher Timeframes
Position forex emphasizes higher timeframes for a reason.
- More participants = stronger structure
- Less noise = clearer reactions
- Better alignment with fundamentals
Weekly and daily charts produce channel structures that reflect institutional behavior, not short-term speculation.
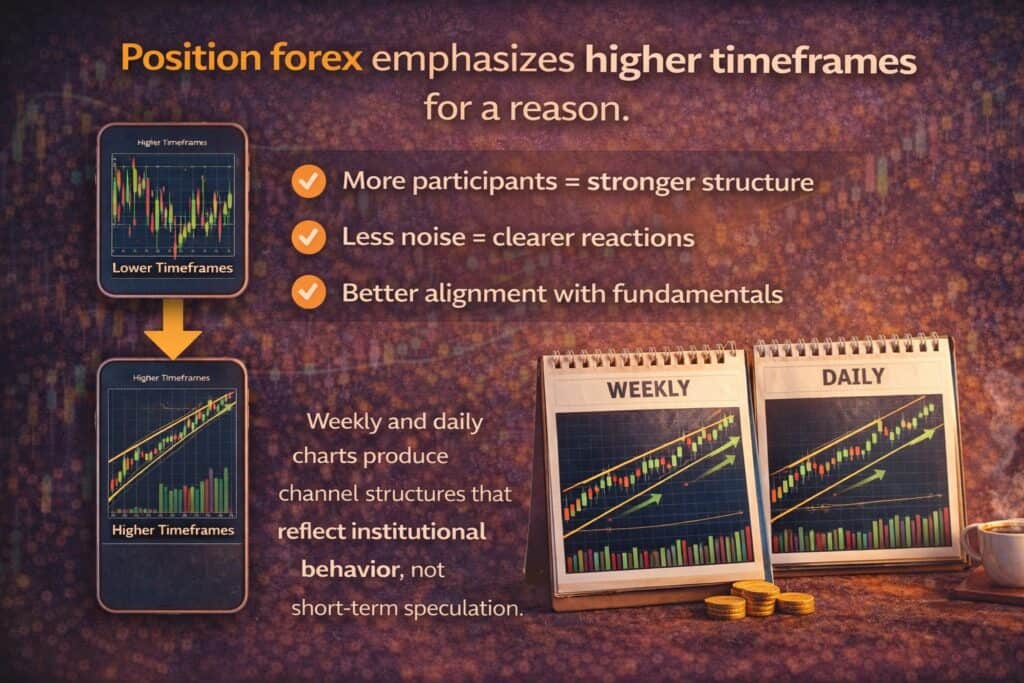
This is why channel line basics are especially powerful for position traders.
Channel Lines vs. Indicators
Channel lines come from price itself, not mathematical derivatives. Unlike indicators, they do not lag—they frame behavior.
Indicators may confirm momentum, but channel lines define where momentum matters.
Used together, they provide context and confirmation without redundancy.
Conclusion
Channel line basics are not about drawing lines—they are about understanding structure.
When used correctly, channel lines help traders see trends clearly, avoid emotional decisions, and focus on high-quality market locations. They do not predict the future, but they dramatically improve how traders interpret the present.
For position traders especially, channel lines offer a disciplined, price-based framework that aligns with patience, risk control, and long-term consistency.
What’s the Next Step?
Evaluate your current charts honestly:
- Are your channels based on structure—or guesswork?
- Are you using higher timeframes where channels matter most?
- Are you waiting for price to react, not forcing trades?
If you want a position-trading framework that integrates channel line basics with trend, momentum, and structure, learn the Six Basics of Chart Analysis.
The Six Basics of Chart Analysis and Forex Forecast
This position-focused framework works across all currency pairs and higher timeframes, keeping your attention on price behavior, structure, and context where durable trading decisions are made.

Download it free and receive the weekly Forex Forecast to see how these concepts are applied in real market conditions.
Five-Question Quiz: Channel Line Basics
Questions
- What is the primary purpose of channel lines?
- A) Predict reversals
- B) Define market structure
- C) Replace indicators
- D) Identify exact entries
- How many touchpoints are required to confirm a channel?
- A) One
- B) Two
- C) Three
- D) As many as possible
- Why are channel lines considered zones rather than exact prices?
- A) Indicators lag
- B) Forex markets are noisy
- C) Brokers adjust prices
- D) Timeframes vary
- Which timeframe best suits channel line basics for position traders?
- A) 1-minute
- B) 5-minute
- C) Daily and weekly
- D) Tick charts
- What weakens a channel’s reliability?
- A) Multiple touches
- B) Confluence with support
- C) Forced drawing
- D) Higher timeframe use
Answer Key
- B
- B
- B
- C
- C
Forex Trading Disclosure Statement
Risk Warning:
Forex trading involves significant risk and may not be suitable for all investors. The leveraged nature of Forex trading can work both for and against you, leading to substantial gains or losses. Before trading Forex, you should carefully consider your financial objectives, experience level, and risk tolerance. It is possible to lose more than your initial investment, and you should only trade with money you can afford to lose.
Market Risks and Volatility:
Forex markets are influenced by global economic, political, and social events, which can result in unpredictable price movements. High market volatility can lead to sudden and substantial changes in currency values, potentially causing losses that exceed your initial deposit.
Leverage Risks:
Leverage amplifies both potential gains and potential losses. While leverage can increase profitability, it also increases the risk of significant losses, including the loss of your entire trading capital.
Trading Tools and Technology Risks:
Forex trading platforms, including those offered by brokers, are subject to technology risks, such as system failures, latency issues, and potential errors in price feeds. Traders should be aware that these risks can impact the execution of trades and trading outcomes.
No Guarantee of Profitability:
Past performance in Forex trading is not indicative of future results. There is no guarantee that you will achieve profits or avoid losses when trading Forex. Market conditions and individual trading strategies vary, and no trading system can eliminate the inherent risks of Forex trading.
Educational Purposes Only:
Any information provided about Forex trading, including strategies, analysis, or market commentary, is for educational purposes only and should not be considered financial advice. Consult a qualified financial advisor or tax professional before making any trading decisions.
Regulatory Compliance:
Forex trading is regulated differently in various jurisdictions. Ensure that you are trading with a licensed and compliant broker in your country of residence.
Responsibility:
You are solely responsible for your trading decisions and the associated risks. It is your duty to understand the terms and conditions of Forex trading, including margin requirements, stop-losses, and other risk management tools.
Acknowledgment:
By engaging in Forex trading, you acknowledge that you have read, understood, and accepted this disclosure statement. You accept full responsibility for the outcomes of your trading decisions and agree to trade at your own risk.
This disclosure is intended to provide an overview of the risks associated with Forex trading and is not exhaustive. For additional information, consult your broker and other reliable financial resources.