

Wedge patterns are among the most reliable chart patterns in Forex trading, offering early clues when momentum is shifting and a trend is ready to turn.
Whether you’re analyzing a Bullish Falling Wedge or a Bearish Rising Wedge, these formations help you anticipate reversals before most traders see them.
In this guide, you’ll learn how wedges work, how to identify them, and six proven strategies to trade them with confidence.
TL;DR (Quick Summary)
- Wedge patterns are reversal structures that form when price contracts between two converging lines.
- Two types exist: Bullish Falling Wedge (reversal higher) and Bearish Rising Wedge (reversal lower).
- Trading wedges is most effective when combined with Momentum indicators, Japanese Candlestick patterns, and Support & Resistance.
- Use confirmation + confluence rather than relying on the pattern alone.
- The six strategies below help improve accuracy, timing, and target selection.
Table of Contents
- TL;DR (Quick Summary)
- What Are Wedge Patterns in Forex Trading?
- Quick Reference Table: Falling vs. Rising Wedges
- 6 Winning Strategies for Trading Wedge Patterns
- 1. Use Momentum Indicators for Confirmation
- 2. Use Japanese Candlesticks for Reversal Confirmation
- 3. Combine Wedges with Support and Resistance
- 4. Use Wedges with Momentum for Early Entries
- 5. Use Wedges with Candlestick Signals for Exit Timing
- 6. Use Wedges with Support and Resistance for Superior Stops & Targets
- Conclusion
- What’s the Next Step?
- 5-Question Quiz: Test Your Knowledge
- Answer Key
- Forex Trading Disclosure Statement
What Are Wedge Patterns in Forex Trading?
Wedge patterns are reversal formations that develop when price consolidates between two converging trendlines.
They appear after extended moves and signal the slowing of momentum before a shift in direction.
There are two primary types:
- Bullish Falling Wedge → forms in a downtrend and signals an upward reversal.
- Bearish Rising Wedge → forms in an uptrend and signals a downward reversal.
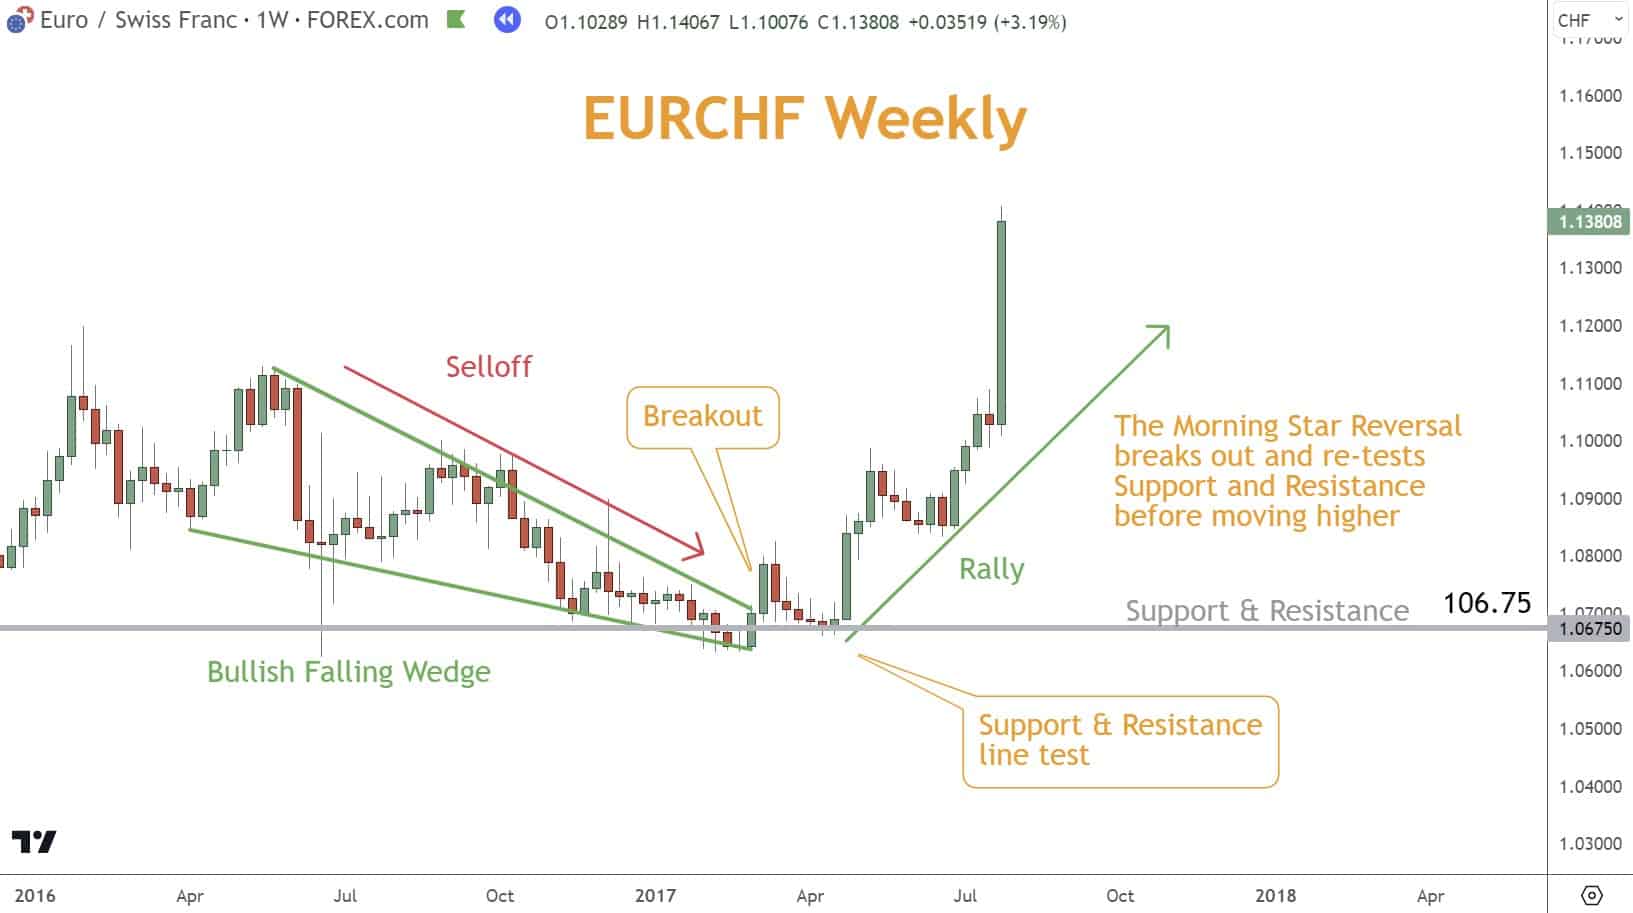
The Bullish Falling Wedge pattern is used to identify potential bullish reversals, as demonstrated in the EUR/CHF chart below.
It forms during a downtrend and is characterized by two converging lines, with the upper line sloping upwards at a lesser angle than the lower line until the apex is reached.
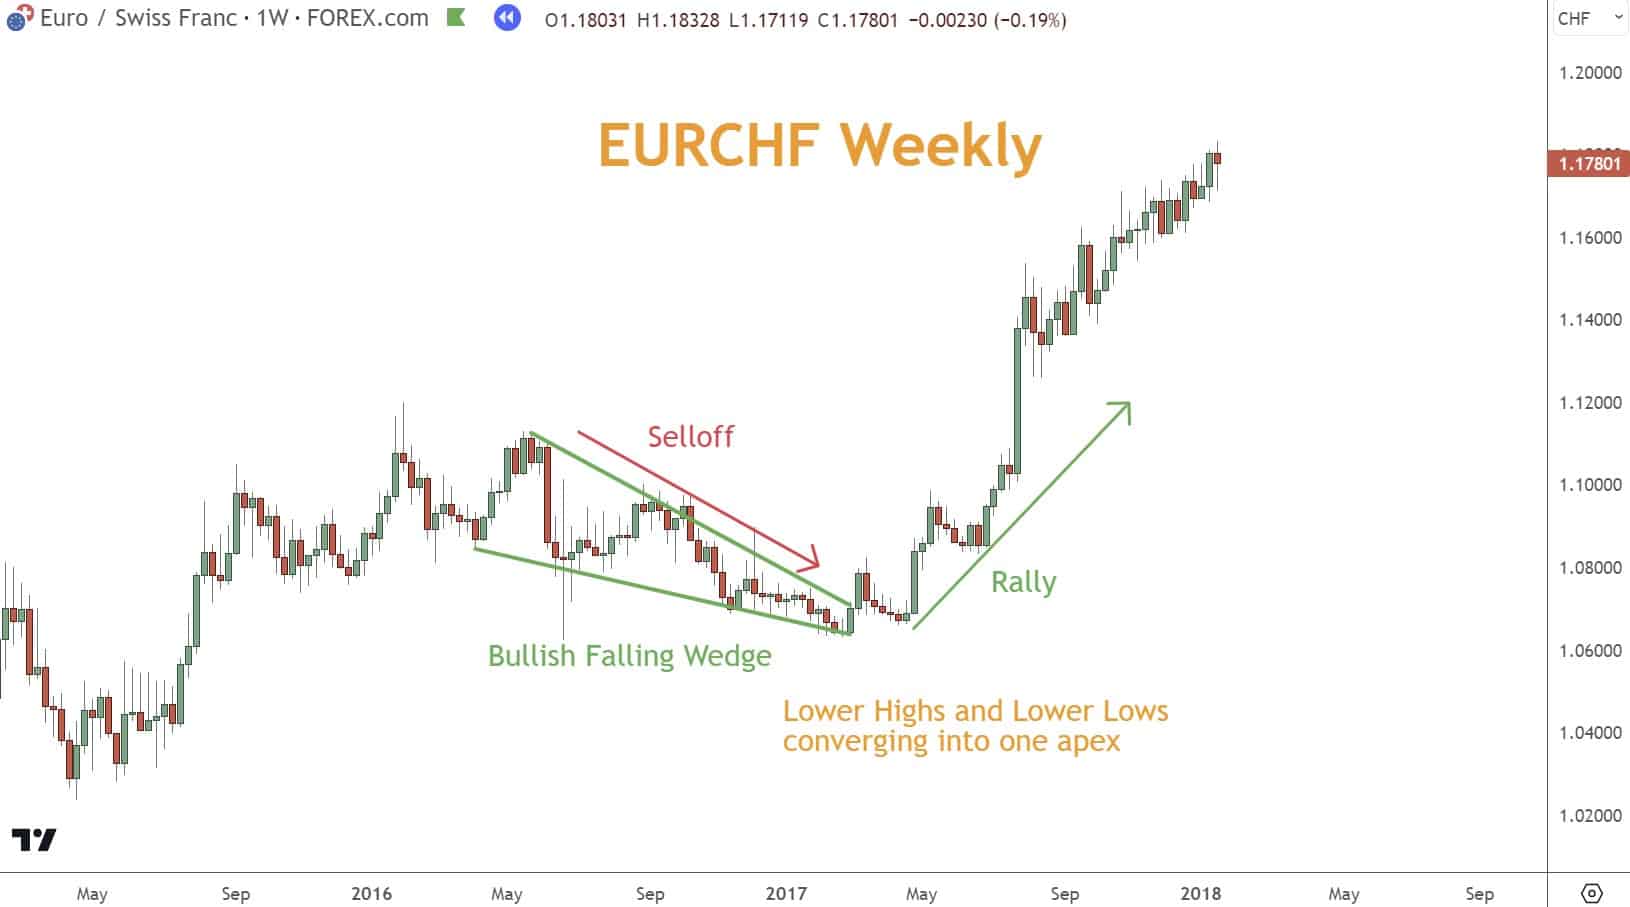
Why it works:
A Falling Wedge reflects seller exhaustion. As the range tightens, buyers begin absorbing supply, creating the conditions for a reversal.
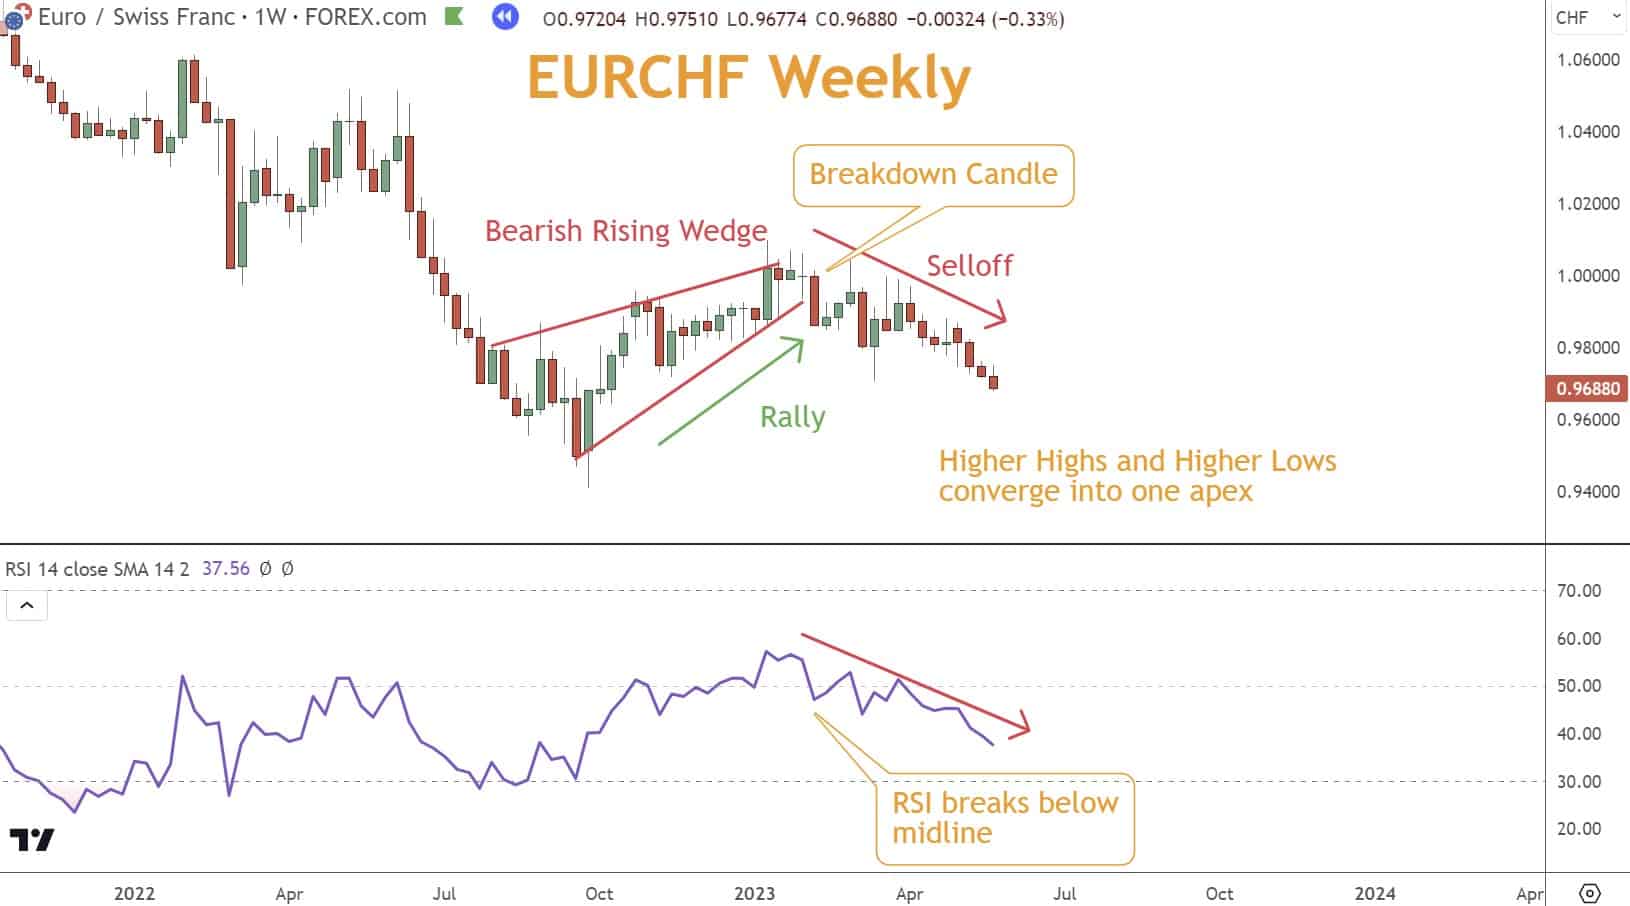
Conversely, the Bearish Rising Wedge suggests a potential bullish reversal as seen in EUR/CHF below.
This pattern is characterized by two converging lines, with the upper line sloping upwards at a steeper angle than the lower line until the apex is reached.
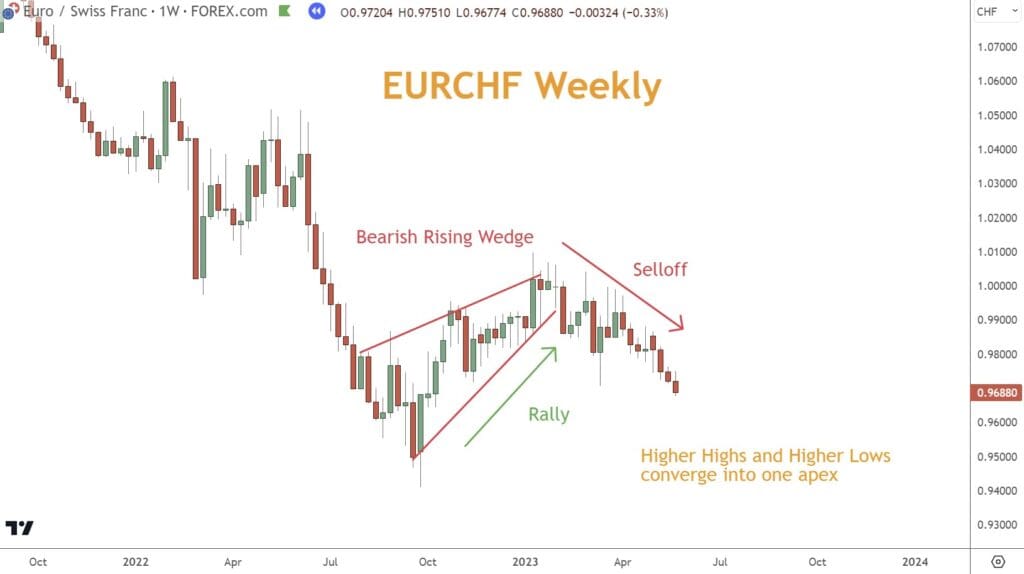
Why it works:
This pattern reflects buyer fatigue. As the range tightens, sellers overwhelm long traders, creating the conditions for a reversal.
Key characteristics include:
- Converging highs and lows
- Decreasing volatility
- Breakout against the direction of the wedge’s slope
- A reversal often occurs near the apex
Quick Reference Table: Falling vs. Rising Wedges
| Feature | Bullish Falling Wedge | Bearish Rising Wedge |
| Slope | Lower highs, lower lows | Higher highs, higher lows |
| Direction | Typically reverses upward | Typically reverses downward |
| Market Context | Appears in/downtrend exhaustion | Appears in/uptrend exhaustion |
| Breakout | Bullish breakout above upper line | Bearish breakdown below lower line |
| Confirmation Tools | Momentum crossovers, Bullish candlesticks, Support | Bearish candlesticks, Momentum overbought signals, Resistance |
| Best Use | Catching early reversals | Identifying failing rallies |
Looking for a Strategy?
Download the Six Basics of Chart Analysis and sign up for Forex Forecast to learn a bottom-up approach to analyzing Forex markets and weekly market updates.
6 Winning Strategies for Trading Wedge Patterns
Below are six ways to combine wedge patterns with professional-level supporting tools.
1. Use Momentum Indicators for Confirmation
Momentum tools validate whether the wedge is likely to break in the expected reversal direction.
Useful indicators:
- RSI → Overbought/Oversold levels
- TSI → Momentum shifts via signal line crossovers
- Stochastic → Reversal probabilities at extremes
You can confirm potential trend reversals with greater certainty by using indicators like the Relative Strength Index (RSI) and the Stochastic, as shown in the EUR/CHF chart below.
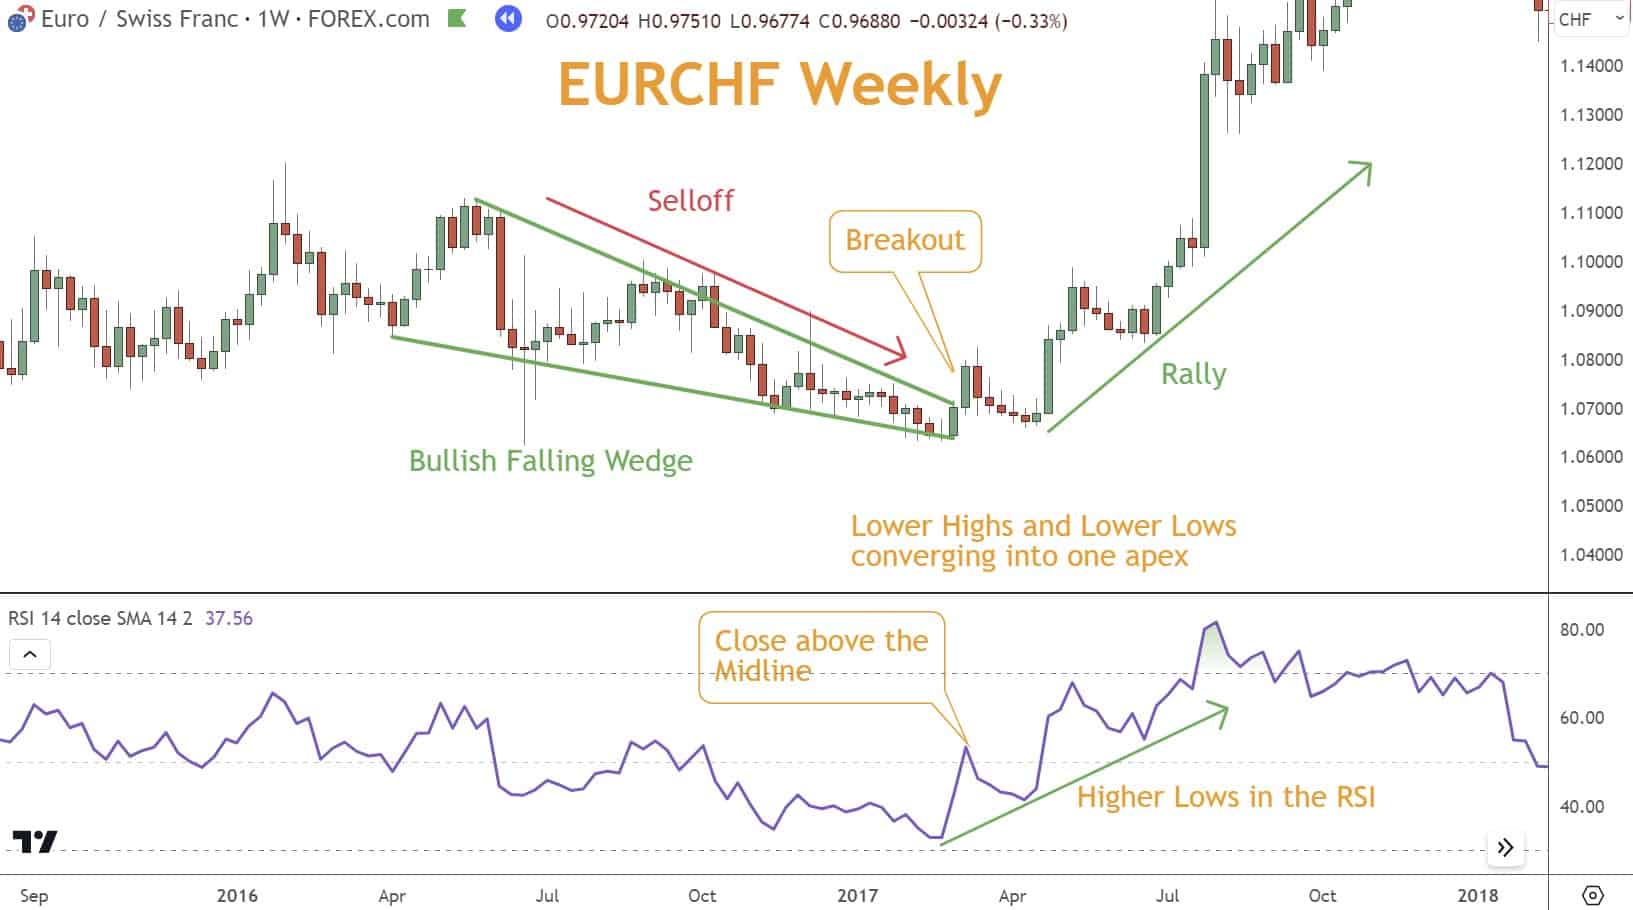
Signals to look for:
- Bullish Wedge → Momentum turns upward
- Bearish Wedge → Momentum turns downward
- Divergence → Often strengthens reversal accuracy
Momentum adds timing precision, helping avoid premature entries and false breakouts.
2. Use Japanese Candlesticks for Reversal Confirmation
Candlesticks add insight into market psychology at the moment the wedge completes.
For instance, if a Bullish Morning Star reversal emerges at the end of a Falling Wedge, as seen below, it suggests a potential upward breakout.
Moreover, other candlestick patterns, such as Doji or Hammer formations, can enhance the validation of a reversal.
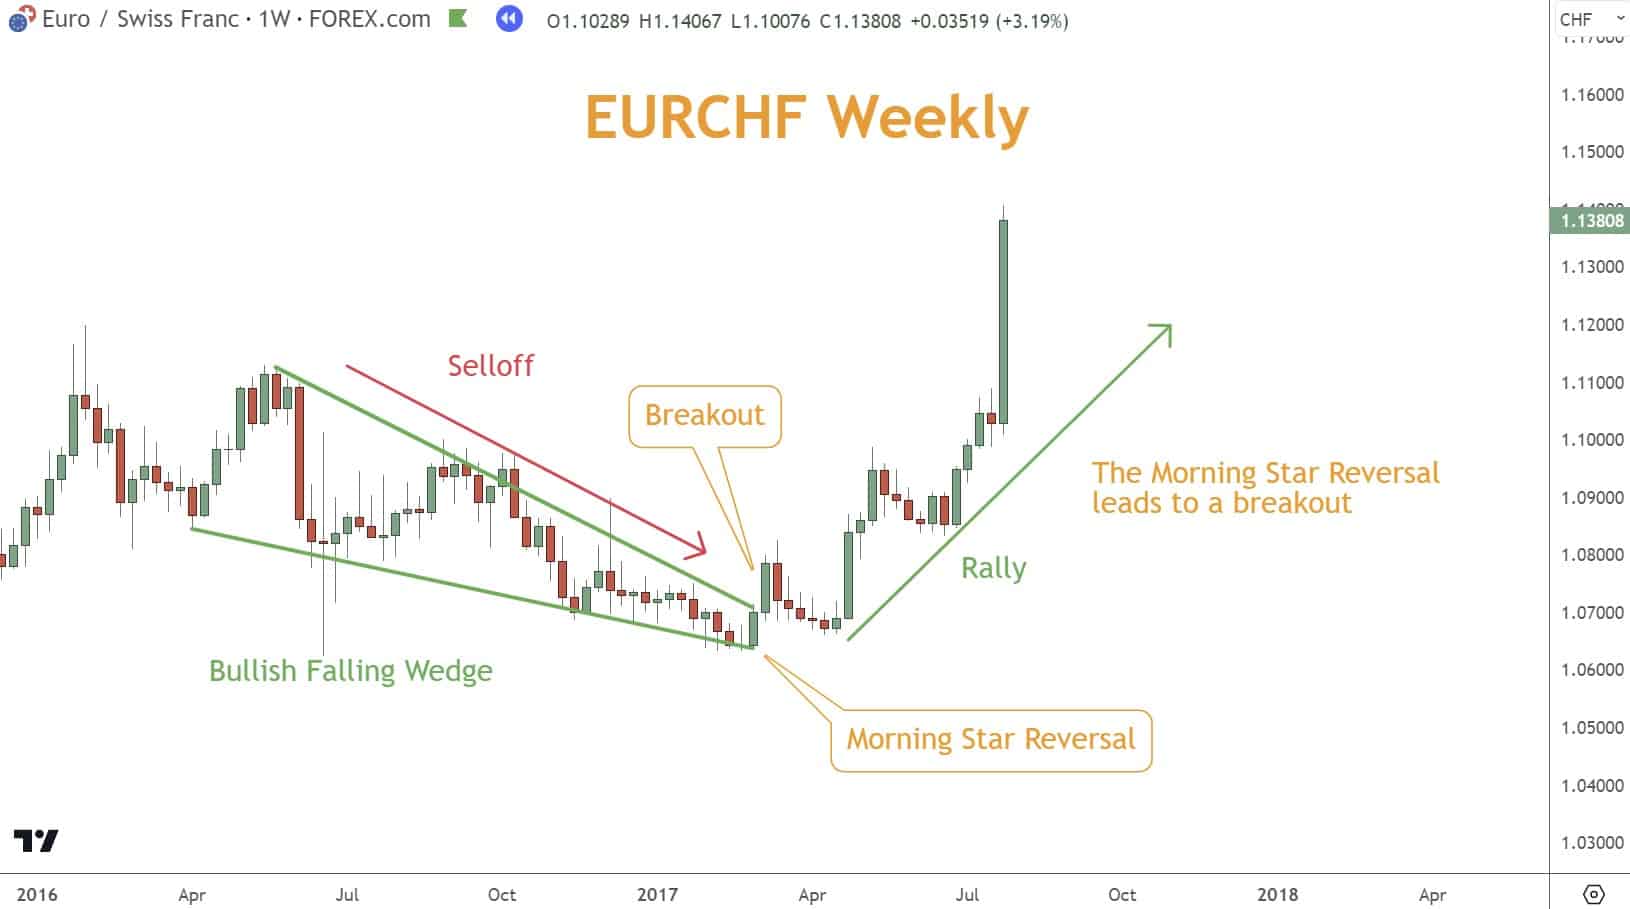
Look for:
- Morning Star inside a Falling Wedge → Bullish
- Hammer / Doji → Reversal strength confirmation
- Evening Star or Bearish Engulfing inside a Rising Wedge → Bearish
Candlesticks help validate the breakout direction before committing capital, improving win rates meaningfully.
3. Combine Wedges with Support and Resistance
Traders should seek confluence between them and the price chart’s Support or Resistance levels.
A breakout above the upper line confirms a Bullish reversal when combined with horizontal Support or Resistance.
In the example below, EURCHF breaks out into a consolidation period and ultimately moves higher.
Use it to:
- Confirm reversal zones
- Locate safe stop-loss areas
- Select realistic target levels
Examples:
- Falling Wedge → Breakout above Resistance ≈ stronger signal
- Rising Wedge → Breakdown at major Support ≈ higher probability follow-through
When wedge breakouts align with S/R zones, successful trades significantly increase.
4. Use Wedges with Momentum for Early Entries
Momentum crossovers provide early warning signs within the wedge before the breakout.
By integrating technical tools such as the Relative Strength Index (RSI) and the Stochastic Oscillator with the Rising Wedge pattern, traders can enhance their ability to identify potential reversals.
When a Rising Wedge pattern forms and is accompanied by a Bearish crossover on a Momentum indicator, it strengthens the signal for a Bearish reversal.
Applications:
- RSI bullish divergence forming as wedge contracts
- TSI crosses above the signal line inside a Falling Wedge
- Stochastic exiting oversold ahead of breakout
This improves timing and helps catch moves early.
5. Use Wedges with Candlestick Signals for Exit Timing
Candlesticks help refine:
- Profit-taking points
- Reversal exit signals
- Re-entry opportunities during retests
To enhance the reliability of your trading signals, consider combining Rising Wedges with Japanese Candlesticks.
You can strengthen your analysis by looking for bearish reversal Candlestick patterns, such as the bearish One Black Crow (imperfect) pattern shown below.
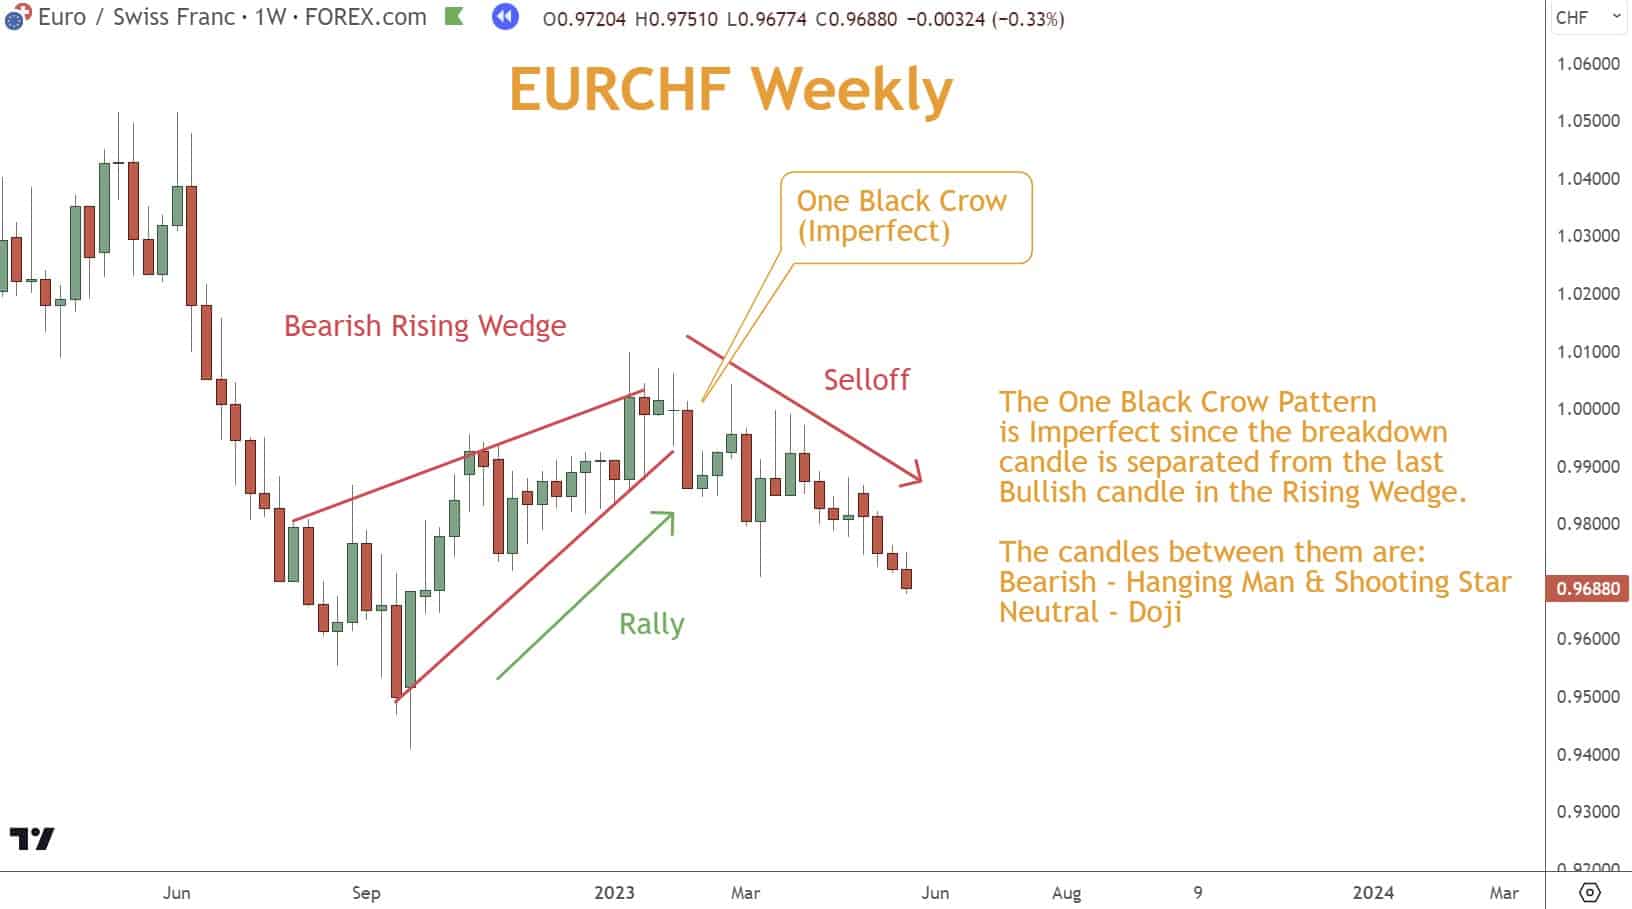
These candlesticks frequently materialize at the end of the pattern. Such occurrences often signal a possible price reversal and provide an opportunity to enter short trades.
However, exercise caution and wait to confirm these candlestick patterns before making trading decisions.
Examples:
- Shooting Star appears after a Rising Wedge breakdown → enhances exit confidence
- Bullish Marubozu after a Falling Wedge breakout → confirms continuation
6. Use Wedges with Support and Resistance for Superior Stops & Targets
An excellent technique to strengthen trading signals involving wedge patterns is to combine them with Support and Resistance levels.
When they materialize near a resistance level, it suggests a potential reversal.
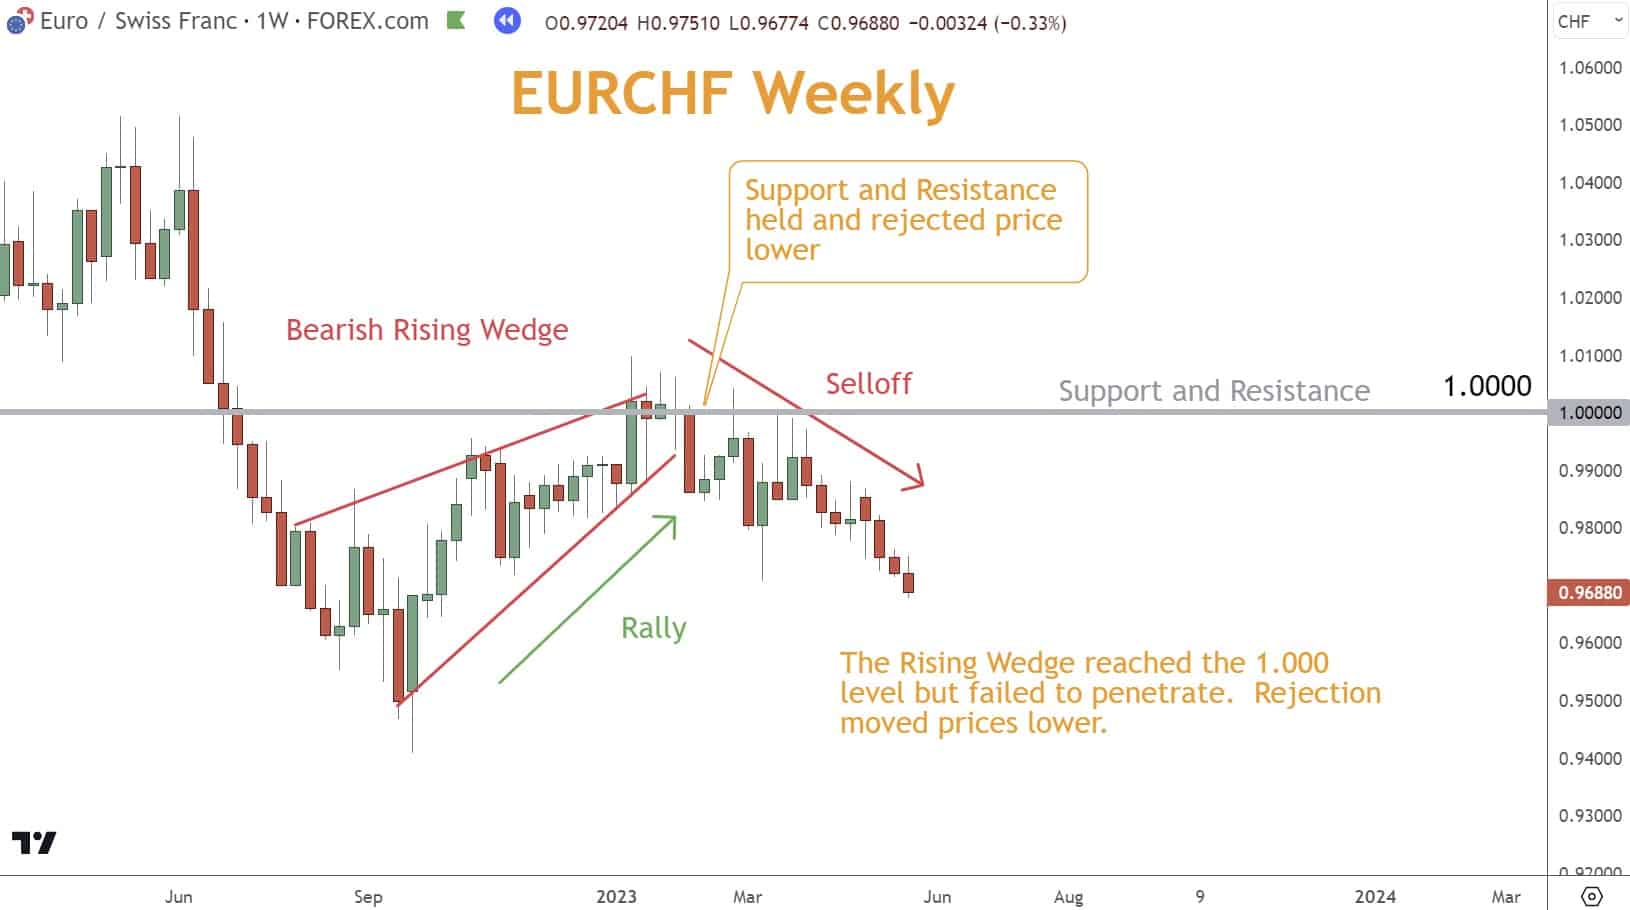
Combining Rising Wedges with Support and Resistance levels can provide stronger trading signals.
Traders should pay attention to these areas for potential reversals and exercise their risk management plan.
Use S/R to determine:
- Stops → just beyond structural levels
- First profit targets → nearest opposing S/R
- Extended targets → next major zone
This reduces reliance on measured moves, which can be inaccurate and inconsistent.
Conclusion
Wedge patterns are among the most trustworthy reversal tools in Forex trading.
When you combine them with Momentum, Japanese Candlesticks, and Support and Resistance, you dramatically improve timing, confirmation, and consistency.
By mastering the six strategies outlined above, wedge patterns become a high-probability component of your trading toolkit.
What’s the Next Step?
- Open your preferred Forex chart and look for Falling or Rising Wedges.
- Apply Momentum indicators, Candlesticks, and Support/Resistance for confirmation.
- Practice identifying confluence among tools to improve accuracy.
- If you need a structured process, start with the Six Basics of Chart Analysis — free on PositionForex.com.
When you get the Six Basics, you’ll also receive Forex Forecast every Sunday, which includes:
- Long-term trade ideas using the Six Basics
- Case studies
- Technical guides and videos
- Alerts for new articles and webinars
- PositionForex news and tools

All free and delivered weekly.
5-Question Quiz: Test Your Knowledge
1. What typically confirms the breakout of a Falling Wedge?
A. Price breaks below the lower trendline
B. Price breaks above the upper trendline
C. RSI becomes overbought
D. A Doji appears alone
2. What does a Bearish Rising Wedge indicate?
A. Continuation of a rally
B. Consolidation
C. A potential downward reversal
D. High volatility expansion
3. Which tool offers the strongest confirmation for wedge reversals?
A. Trend indicators
B. Moving averages
C. Support and Resistance
D. Bollinger Bands
4. What is the primary cause of reversals inside wedges?
A. Sudden news events
B. Momentum weakening
C. Broker manipulation
D. Increased volume
5. Which candlestick pattern best confirms a Bullish Falling Wedge?
A. Shooting Star
B. Evening Star
C. Morning Star
D. Dark Cloud Cover
Answer Key
1. B – Price breaks above the upper trendline
2. C – A potential downward reversal
3. C – Support and Resistance
4. B – Momentum weakening
5. C – Morning Star
Forex Trading Disclosure Statement
Risk Warning:
Forex trading involves significant risk and may not be suitable for all investors. You may lose more than your initial investment. Only trade with money you can afford to lose.
Market Risks and Volatility:
Currency prices move based on global events, economic data, and geopolitical changes. Volatility can cause sudden, unexpected losses.
Leverage Risks:
Leverage increases both potential gains and potential losses. Use it cautiously.
Technology Risks:
Trading platforms can experience outages, delays, or pricing errors that affect trades.
No Guaranteed Results:
Past performance does not guarantee future outcomes. No strategy eliminates all risk.
Educational Purpose Only:
The information provided is for education, not financial advice. Consult a licensed professional before trading.
Responsibility:
You are responsible for your own trading decisions and risk management.