

The True Strength Indicator (TSI) is a powerful momentum oscillator that helps Forex traders identify trend direction, confirm market reversals, and improve trade timing.
By offering a unique view of market strength, the TSI allows for better-informed decisions and enhanced risk management.
In this guide, you’ll learn:
- What the TSI is and how it works
- How to interpret TSI signals effectively
- Three proven methods to combine TSI with other tools for stronger confirmation
- Practical tips for integrating TSI into a profitable Forex strategy
I’ve been trading Forex and other markets since 2007 and have used the TSI as my primary momentum indicator over several thousand trades.
Summary: TSI Trading Methods at a Glance
This table provides a quick reference to the three primary methods covered in this guide, along with confirmation tools to strengthen signals.
| Method | How It Works | Confirmation Tools |
| LSMA Trend Alignment | Trade when TSI momentum aligns with LSMA trend direction | LSMA trend line, centerline position |
| Candlestick Pattern Confirmation | Use TSI to confirm bullish or bearish candlestick patterns | Bullish/Bearish Engulfing, Morning/Evening Star |
| Chart & Support/Resistance Integration | Confirm chart pattern or level break with matching TSI momentum | Double Top/Bottom, Head & Shoulders, major price levels |
Table of Contents
- Summary: TSI Trading Methods at a Glance
- What Is the True Strength Indicator (TSI)?
- How to Interpret TSI Signals
- Three Winning TSI Trading Methods
- Conclusion
- What’s the Next Step?
- Frequently Asked Questions
- Forex Trading Disclosure Statement
What Is the True Strength Indicator (TSI)?
The True Strength Indicator (TSI), developed by William Blau, is a momentum oscillator that measures the strength of price movements.
Unlike indicators such as the RSI or Stochastic Oscillator, the TSI uses two smoothed moving averages of price changes—short-term and long-term—then normalizes and smooths them again to produce a final value.
The TSI oscillates around a centerline (zero level), indicating bullish or bearish momentum:
- Above Zero: Bullish momentum
- Below Zero: Bearish momentum
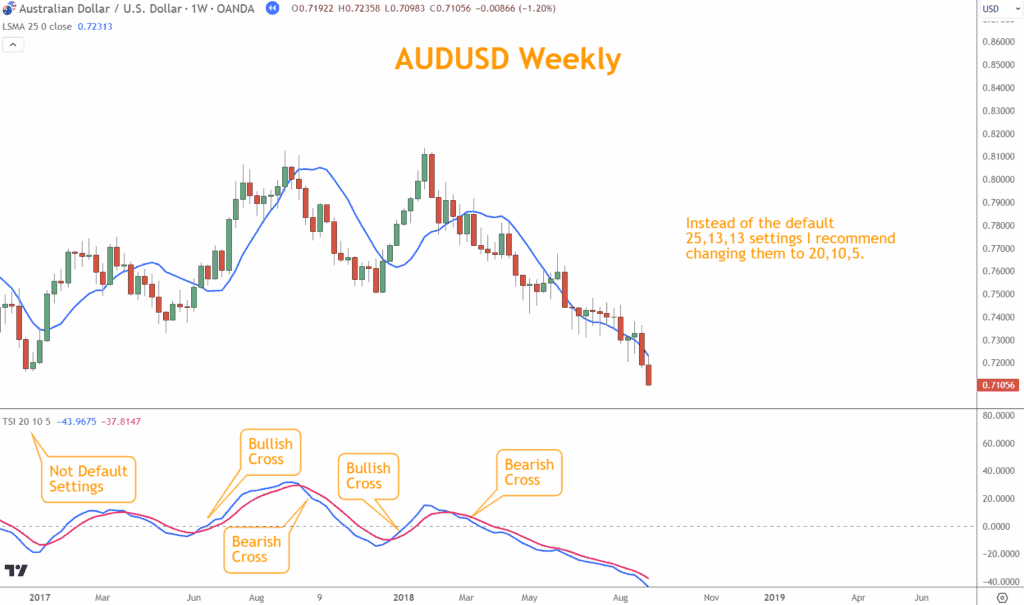
Default vs. Optimized Settings
Most platforms use:
- Long Length: 25
- Short Length: 13
- Signal Length: 13
I prefer:
- Long Length: 20
- Short Length: 10
- Signal Length: 5
Caveat: Only consider a signal line cross valid if the distance between the TSI and the signal line exceeds 2 points. This reduces lag and filters out market noise.
Example: On AUDUSD, bullish and bearish TSI crosses often align closely with trend shifts, providing both entry cues and risk management levels.
How to Interpret TSI Signals
Before applying the TSI in your trading, it’s essential to master its four core signals.
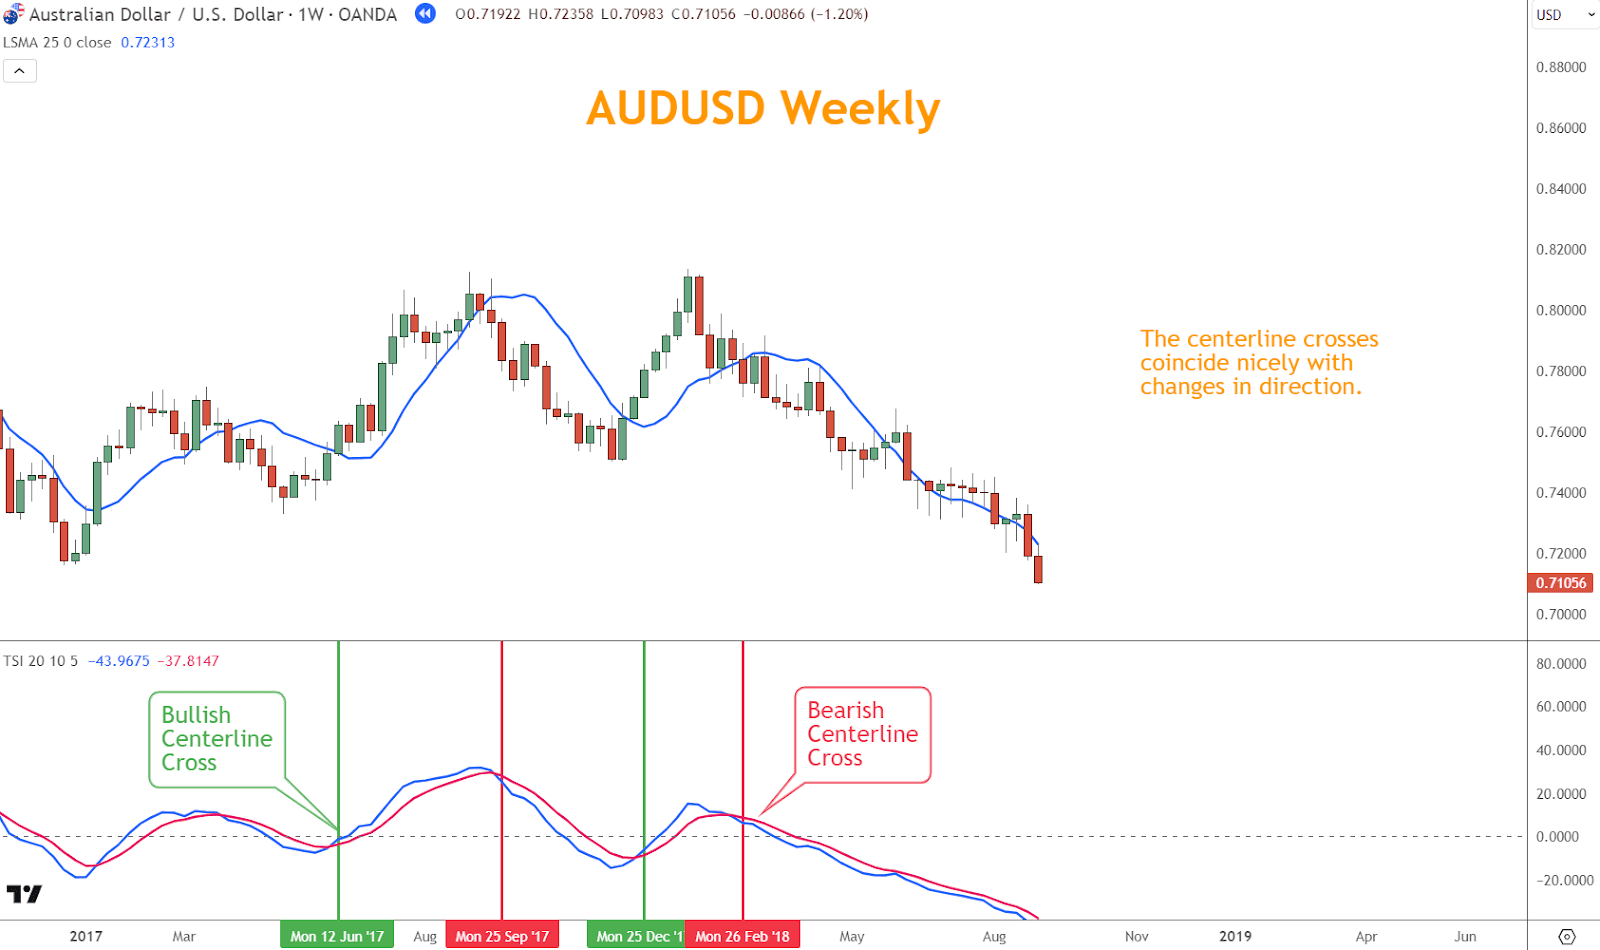
1. Centerline Crosses
When the TSI crosses above or below the zero line:
- Above Zero: Indicates bullish momentum.
- Below Zero: Indicates bearish momentum.
Pro Tip: A bullish cross below zero or a bearish cross above zero can still be valid if other confirmations are present.
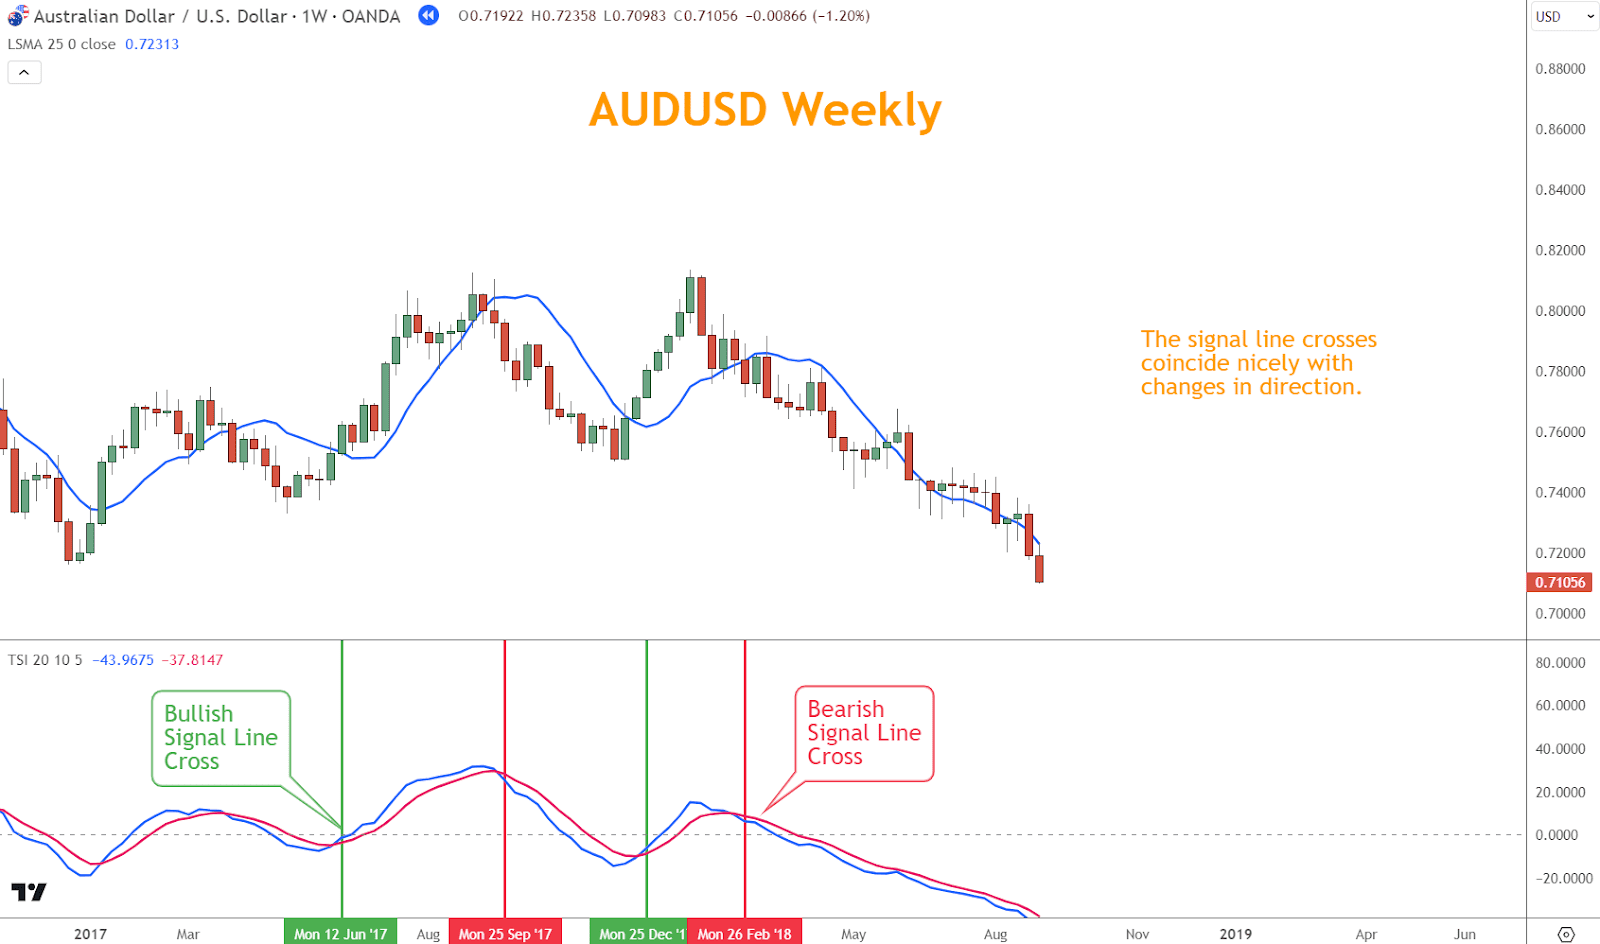
2. Signal Line Crosses
When the TSI crosses its own signal line:
- Upward Cross: Bullish momentum strengthening
- Downward Cross: Bearish momentum strengthening
Use the 2-point distance filter to avoid false moves. This simple step eliminates many whipsaws.
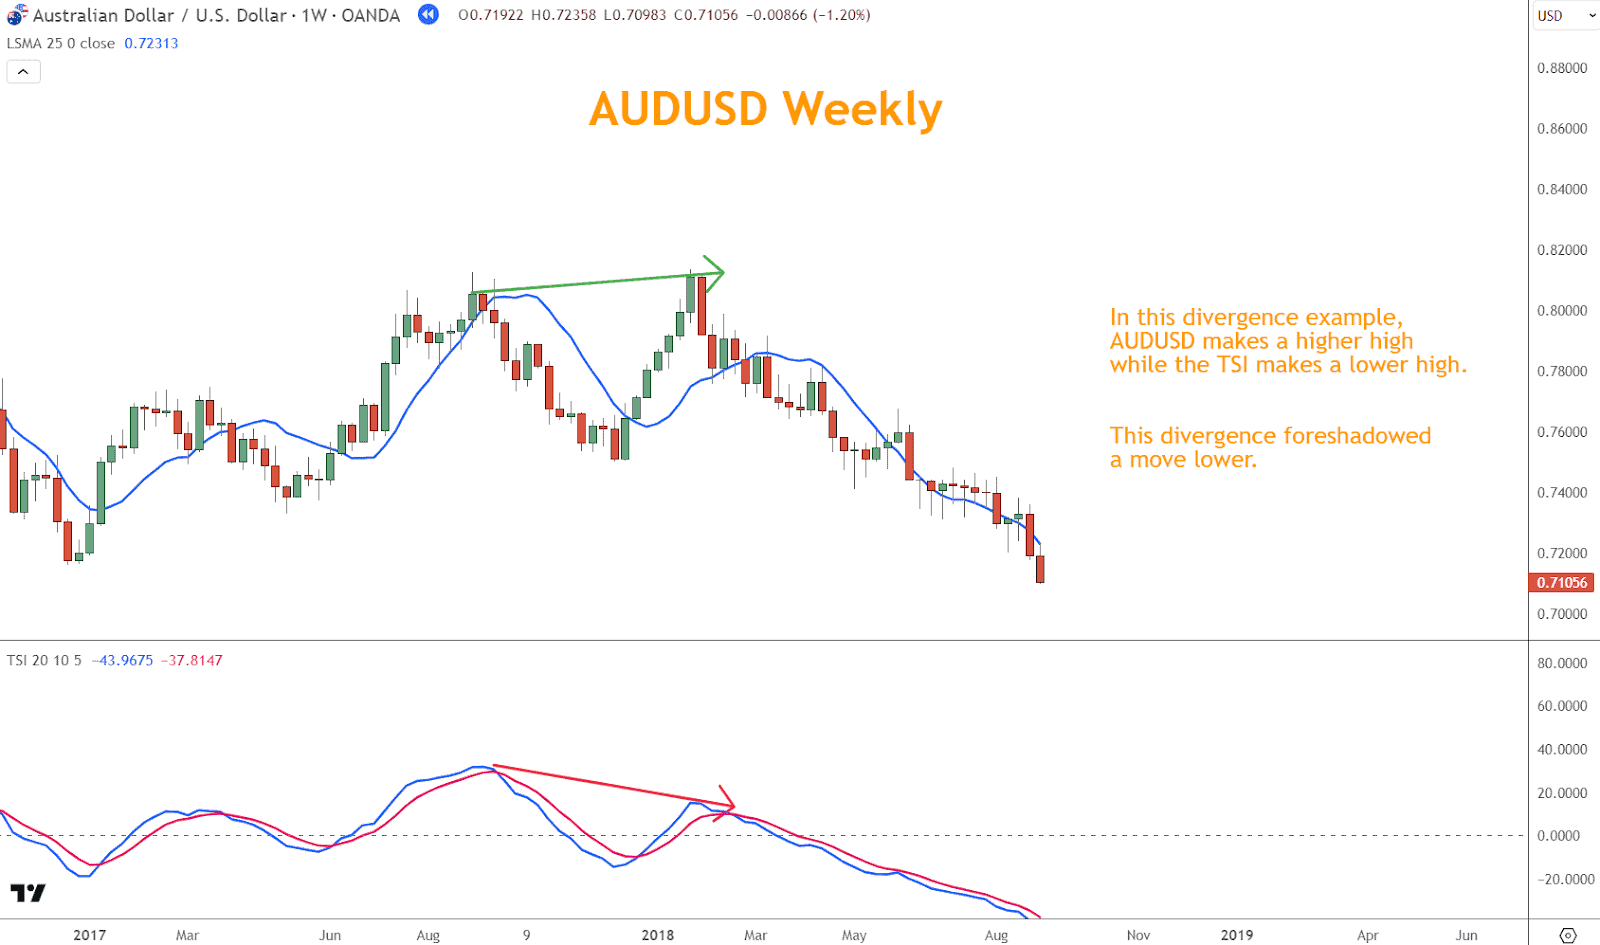
3. Divergence
TSI divergence occurs when price moves in one direction, but the TSI moves in the opposite.
- Bearish Divergence: Price makes higher highs, TSI makes lower highs
- Bullish Divergence: Price makes lower lows, TSI makes higher lows
Because of its smoothing, the TSI makes divergence easier to spot compared to more volatile oscillators.
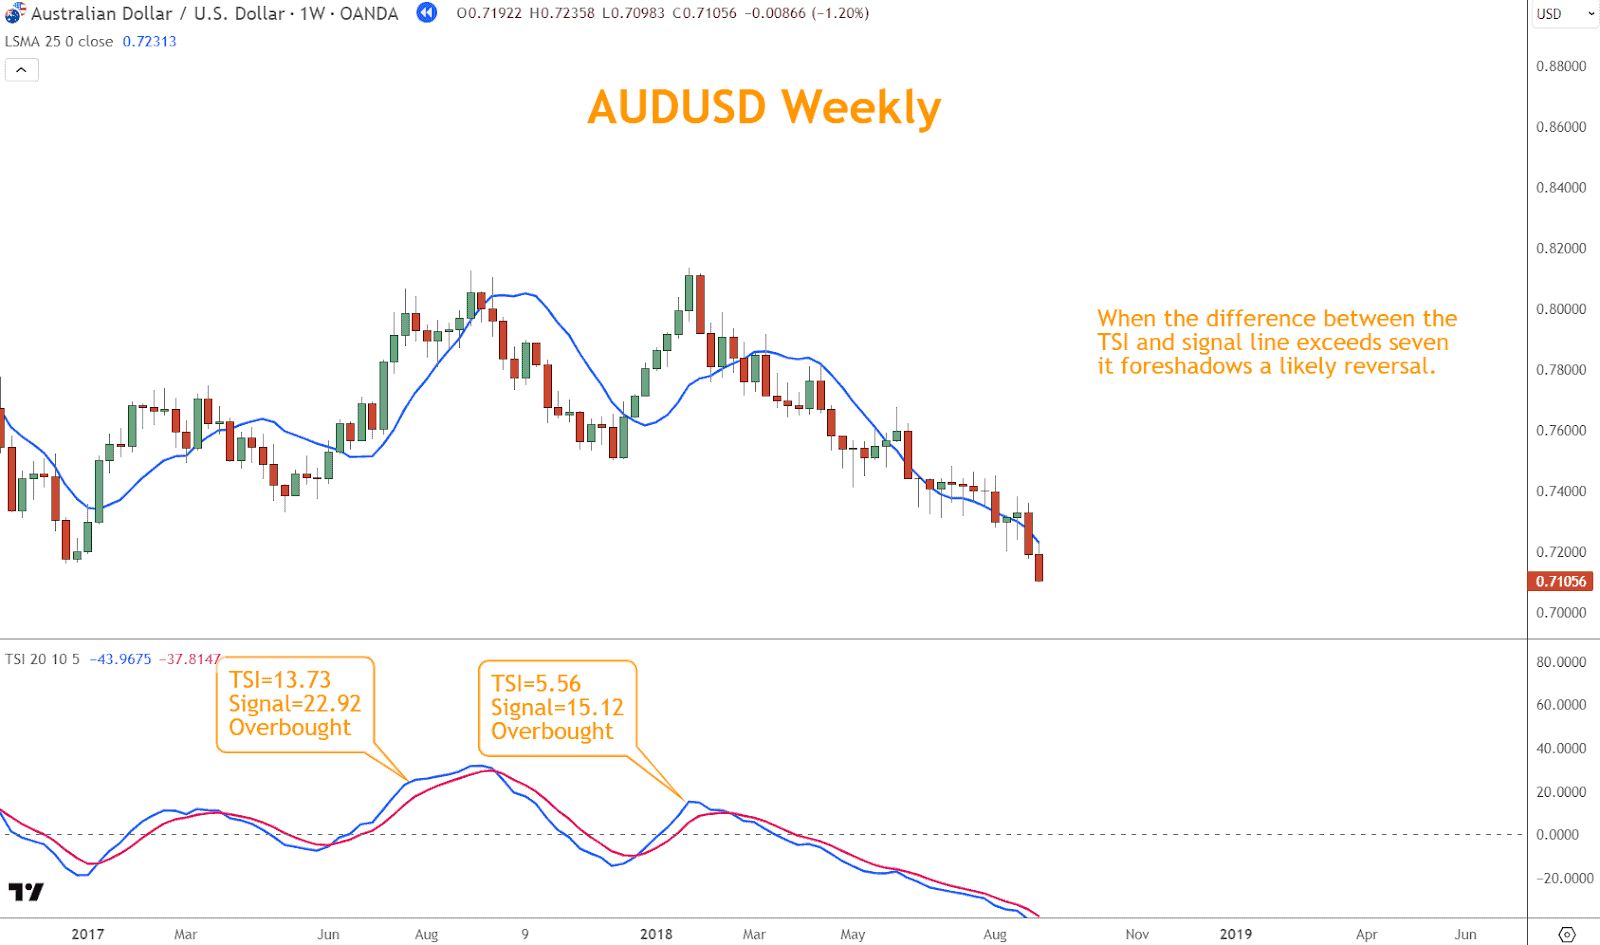
4. Overbought and Oversold Conditions
The TSI doesn’t have fixed levels, but extremes in the distance between TSI and its signal line can indicate stretched conditions.
- Filter: If the distance exceeds 7 points, conditions may be overbought (above) or oversold (below).
Caution: These are not automatic trade signals—markets can stay in these conditions for extended periods.
Looking for a Strategy?
Download the Six Basics of Chart Analysis and sign up for Forex Forecast to learn a bottom-up approach to analyzing Forex markets and weekly market updates.
Three Winning TSI Trading Methods
The TSI becomes far more powerful when combined with other tools. Here are three methods I’ve found highly effective.
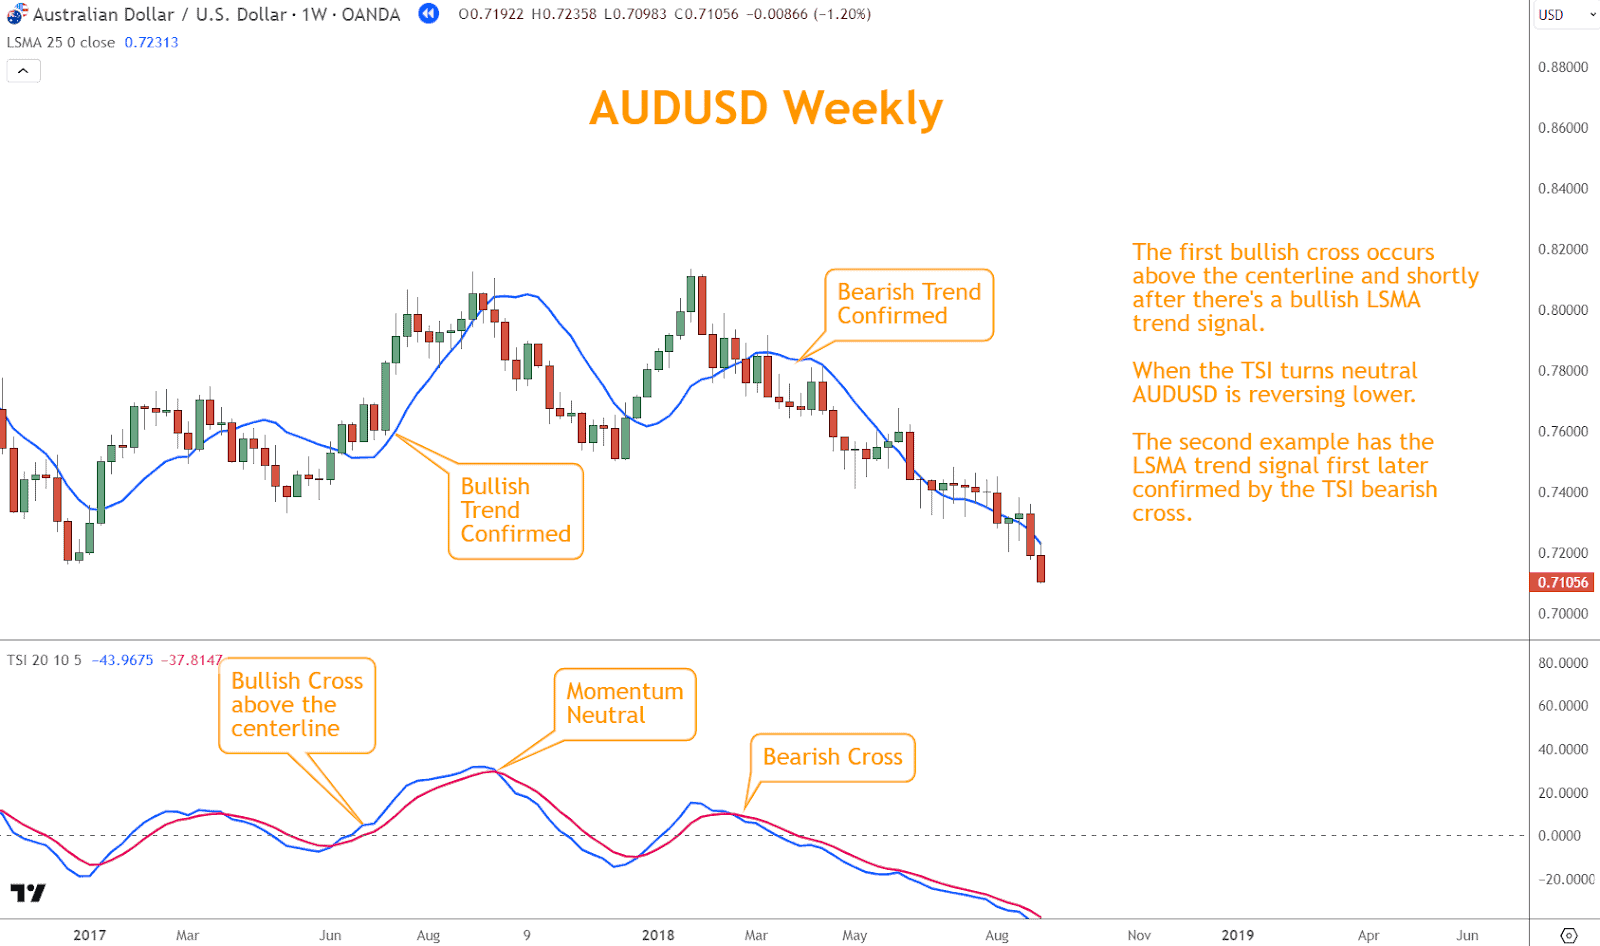
Method 1: Combining TSI with the LSMA Trend Indicator
The Least Squares Moving Average (LSMA) smooths price action to reveal the underlying trend. When TSI momentum aligns with LSMA trend direction, the probability of a successful trade increases.
How to Apply:
- Identify LSMA trend direction (up or down).
- Wait for TSI to confirm momentum in the same direction.
- Enter when both signals align.
Example: AUDUSD shows a bullish TSI cross above the centerline while the LSMA trend turns bullish. Later, when the TSI turns neutral, price reverses lower.
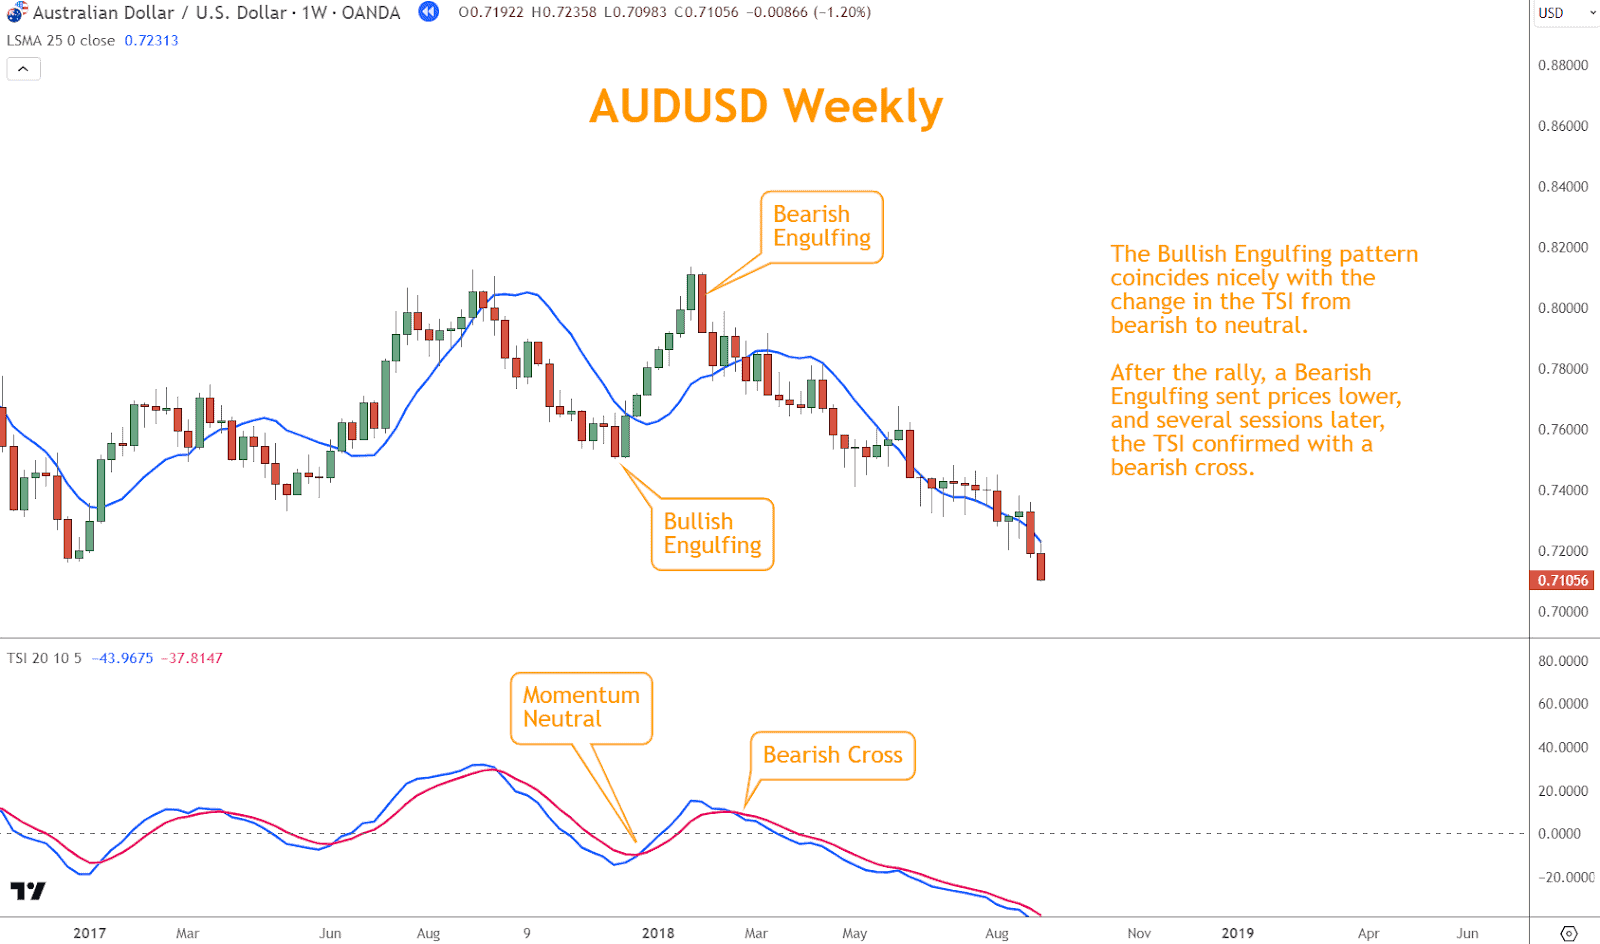
Method 2: Combining TSI with Japanese Candlestick Patterns
Japanese candlestick patterns—such as Bullish Engulfing or Evening Star—are excellent for spotting market sentiment shifts. Pairing these with TSI momentum confirmation greatly improves accuracy.
How to Apply:
- Spot a valid reversal candlestick pattern.
- Check TSI direction—rising for bullish, falling for bearish.
- Enter when both agree.
Example:
- Bullish Engulfing + TSI shift from bearish to neutral → rally.
- Bearish Engulfing + TSI bearish cross → selloff.
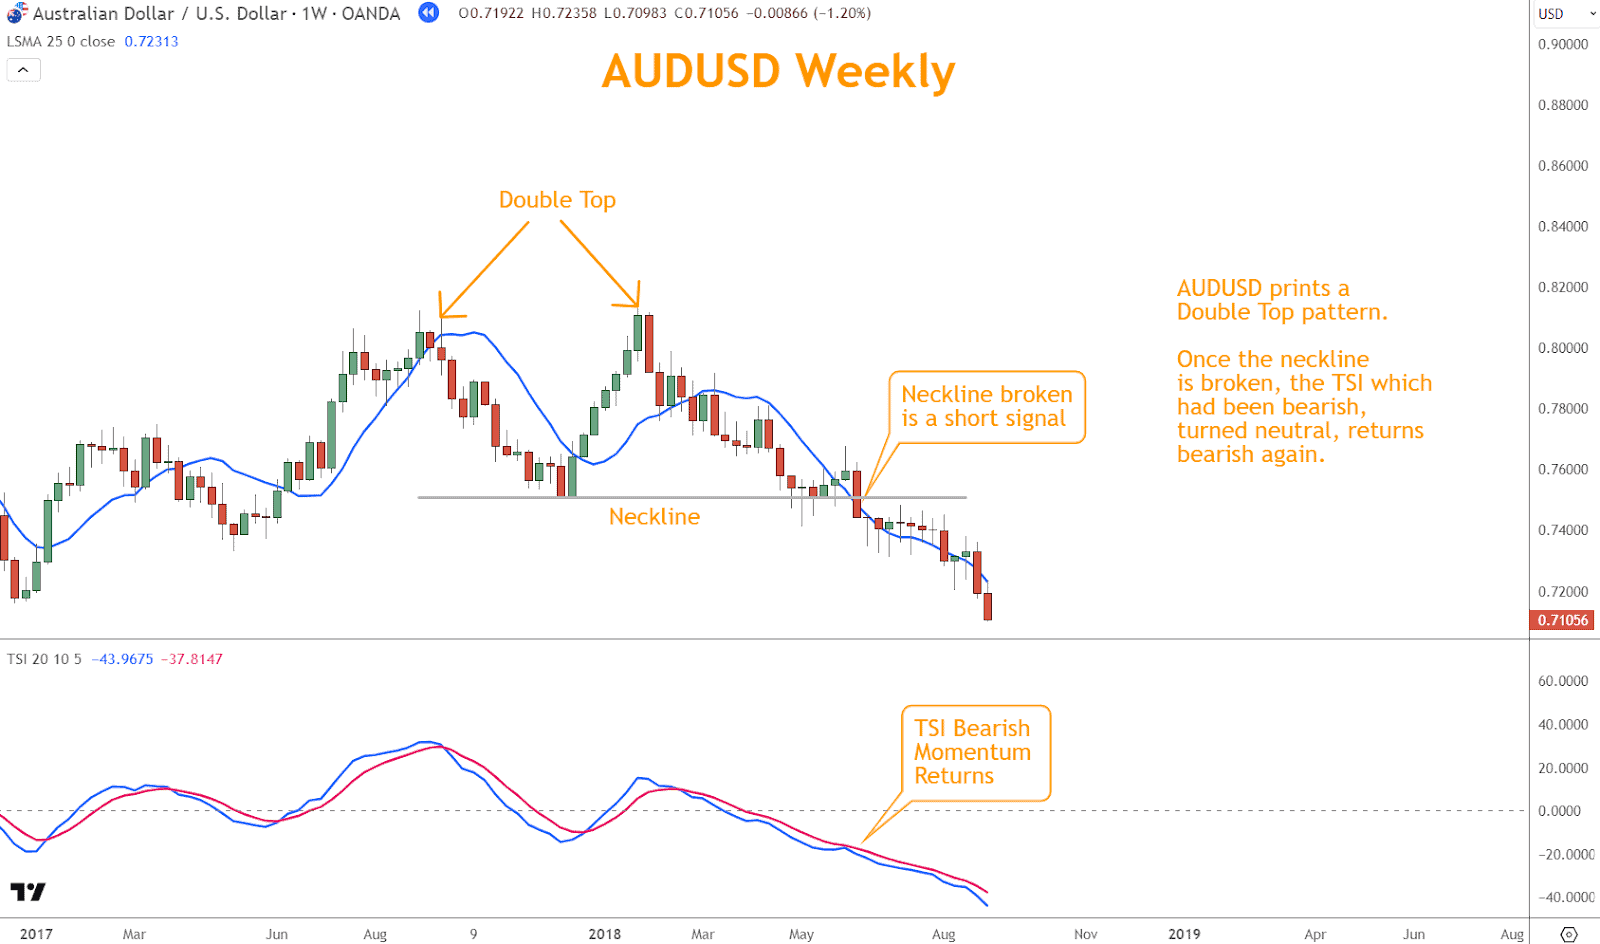
Method 3: Combining TSI with Chart Patterns and Support/Resistance
Chart patterns (Double Tops/Bottoms, Head and Shoulders) and horizontal levels are classic technical tools. Using TSI to confirm breakouts or reversals adds momentum confirmation to price structure setups.
How to Apply:
- Identify the chart pattern or key support/resistance.
- Wait for a breakout or rejection.
- Confirm momentum shift with TSI before entering.
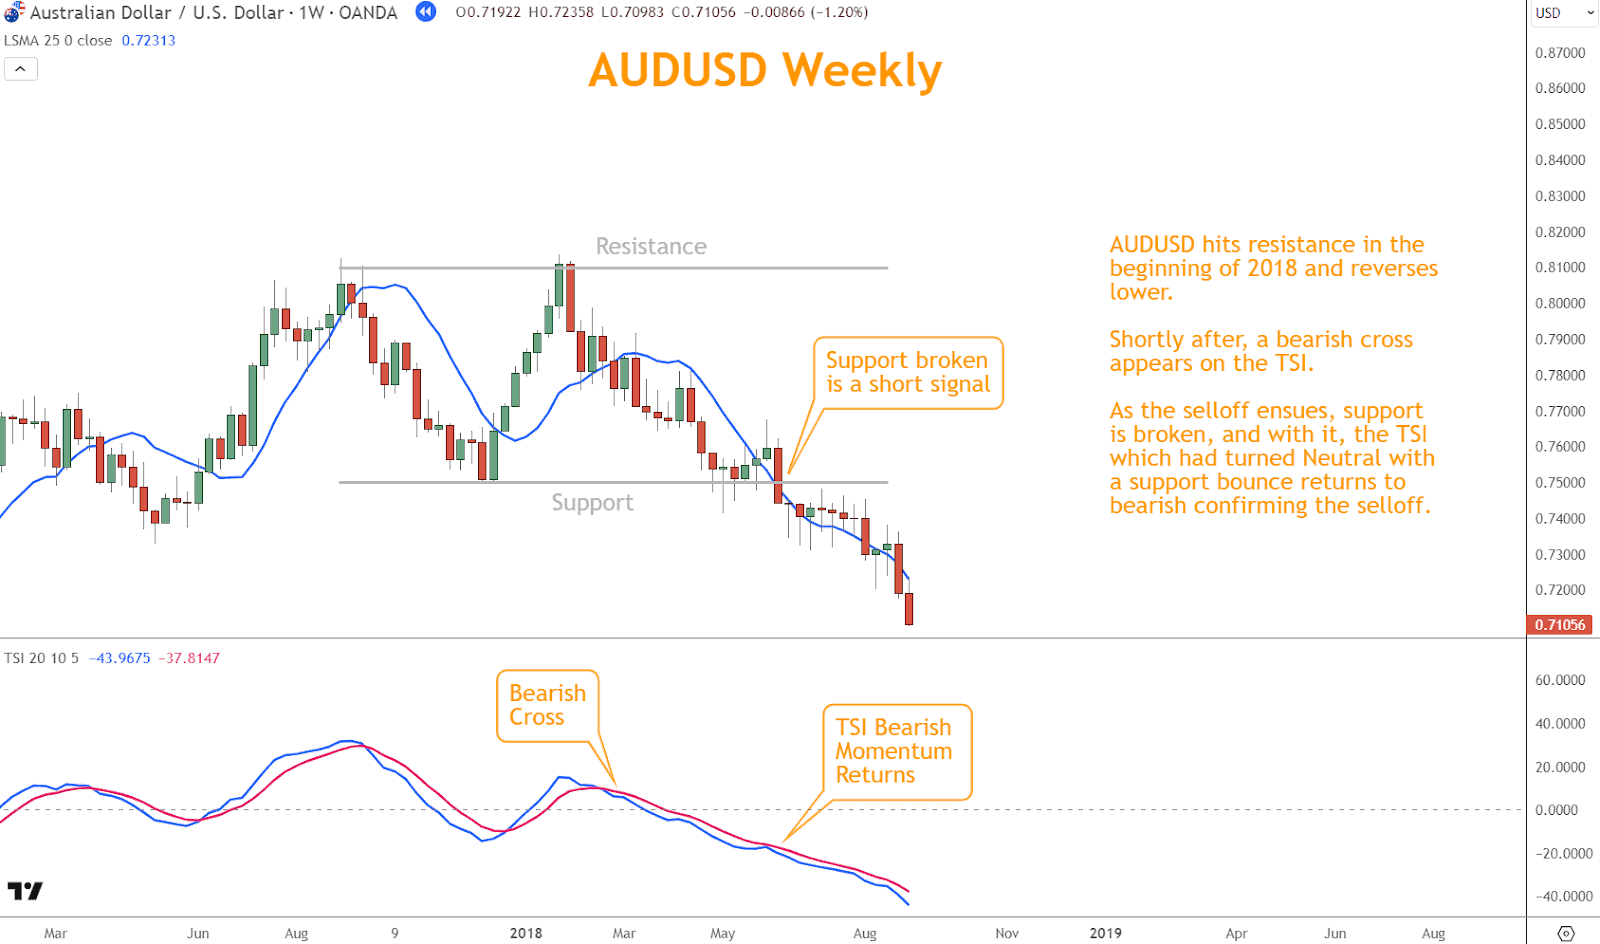
Example: AUDUSD forms a Double Top. The neckline breaks, TSI turns neutral, then bearish—an ideal short entry.
In the example below, AUDUSD hit resistance at the beginning of 2018 and reversed lower.
Shortly after, a bearish cross appears on the TSI.
As the market experiences a selloff, AUDUSD breaks the support level, causing the TSI to turn bearish again.
The TSI had briefly turned neutral after a support bounce, but the selloff confirmed the bearish trend.
Conclusion
The True Strength Indicator offers traders a reliable, momentum-based view of market conditions. By:
- Understanding its core signals
- Applying the 2-point filter for crossovers
- Combining it with LSMA, candlestick patterns, chart patterns, and support/resistance
…you can dramatically improve trade timing and reduce false entries.
Success with the TSI comes from confirmation—never rely on it in isolation.
What’s the Next Step?
- Apply the TSI to your preferred charts.
- Test the three combination methods discussed here.
- Use the Six Basics of Chart Analysis to strengthen your trade selection.
When you download the Six Basics, you’ll also receive the Forex Forecast every Sunday, featuring:
- Trade ideas using the Six Basics and advanced strategies
- Case studies from top trades
- Educational videos and guides
- Alerts to new articles, webinars, and member-only tools

The best part—it’s completely free.
Frequently Asked Questions
Q: What is the TSI, and how is it different from other momentum indicators?
A: The TSI uses two smoothed moving averages of price changes, offering a cleaner, less noisy momentum read than tools like the RSI.
Q: What are the main TSI trading signals?
A: Centerline crosses, signal line crosses, divergence, and overbought/oversold extremes.
Q: Can the TSI be combined with other tools?
A: Yes—its effectiveness increases when used with LSMA, candlestick patterns, chart patterns, and support/resistance.
Forex Trading Disclosure Statement
Risk Warning:
Forex trading involves significant risk and may not be suitable for all investors. The leveraged nature of Forex trading can work both for and against you, leading to substantial gains or losses. Before trading Forex, you should carefully consider your financial objectives, experience level, and risk tolerance. It is possible to lose more than your initial investment, and you should only trade with money you can afford to lose.
Market Risks and Volatility:
Forex markets are influenced by global economic, political, and social events, which can result in unpredictable price movements. High market volatility can lead to sudden and substantial changes in currency values, potentially causing losses that exceed your initial deposit.
Leverage Risks:
Leverage amplifies both potential gains and potential losses. While leverage can increase profitability, it also increases the risk of significant losses, including the loss of your entire trading capital.
Trading Tools and Technology Risks:
Forex trading platforms, including those offered by brokers, are subject to technology risks, such as system failures, latency issues, and potential errors in price feeds. Traders should be aware that these risks can impact the execution of trades and trading outcomes.
No Guarantee of Profitability:
Past performance in Forex trading is not indicative of future results. There is no guarantee that you will achieve profits or avoid losses when trading Forex.
Educational Purposes Only:
Any information provided about Forex trading, including strategies, analysis, or market commentary, is for educational purposes only and should not be considered financial advice.
Regulatory Compliance:
Forex trading is regulated differently in various jurisdictions. Ensure that you are trading with a licensed and compliant broker in your country of residence.
Responsibility:
You are solely responsible for your trading decisions and the associated risks.
Acknowledgment:
By engaging in Forex trading, you acknowledge that you have read, understood, and accepted this disclosure statement.