
Triangle Patterns are some of the most reliable continuation structures in technical analysis when traded correctly.
They reflect pauses in Momentum during strong market moves and often precede powerful breakouts or breakdowns.
This guide explains how Triangle Patterns work, why context matters, and the three non-negotiable rules you must follow to trade them effectively.
You’ll also learn how to trade each triangle type step by step and why these patterns are especially effective for position traders.
TL;DR — Triangle Patterns Quick Summary
- Triangle Patterns signal consolidation within an existing trend
- All triangles resolve with a breakout or breakdown
- All triangle patterns are continuation patterns
- Context is critical: triangles only work in rallies or selloffs
- The three valid triangle types are Symmetrical, Ascending, and Descending
- Best results come from combining triangles with trend, momentum, and support/resistance
Table of Contents
- TL;DR — Triangle Patterns Quick Summary
- What Are Triangle Patterns?
- Rule 1: All Triangle Patterns Resolve With a Breakout or Breakdown
- Rule 2: All Triangle Patterns Are Continuation Patterns
- Rule 3: Context Determines Whether a Triangle Is Tradable
- Can You Use a Triangle Line as a Stop?
- Why Triangle Patterns Work So Well for Position Trading
- Conclusion
- What’s the Next Step?
- Five-Question Knowledge Check
- Forex Trading Disclosure Statement
What Are Triangle Patterns?
Triangle Patterns are chart formations created by connecting at least two swing highs and two swing lows, forming a narrowing price structure.
These patterns reflect trader indecision and temporary exhaustion after a strong move.
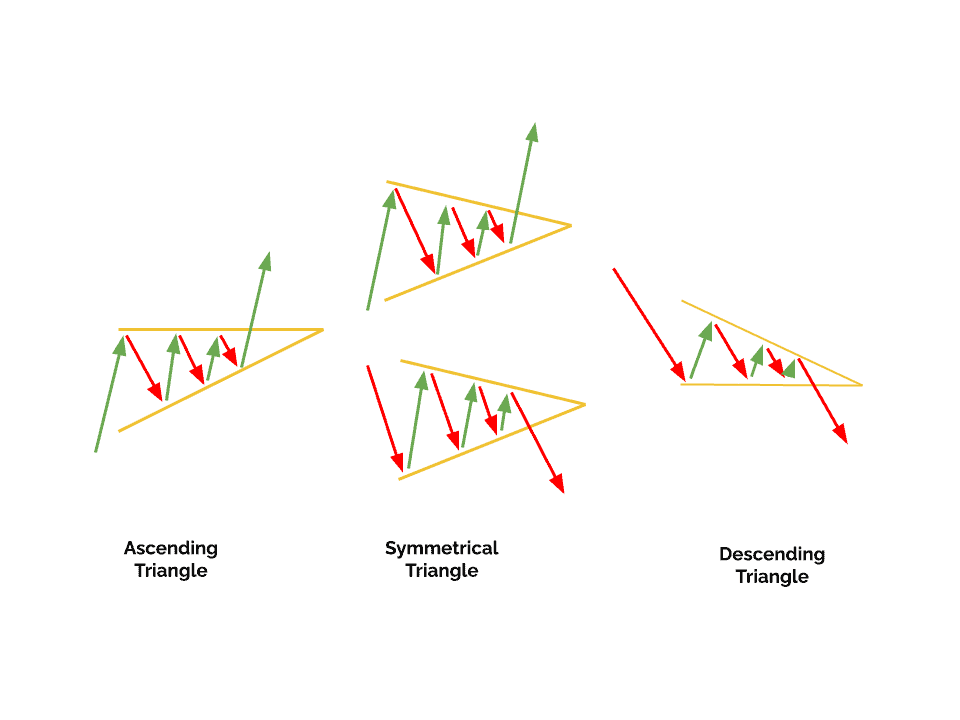
There are three primary triangle types, each with a specific directional bias.
Triangle Pattern Types Overview
| Triangle Type | Directional Bias | Market Context Required |
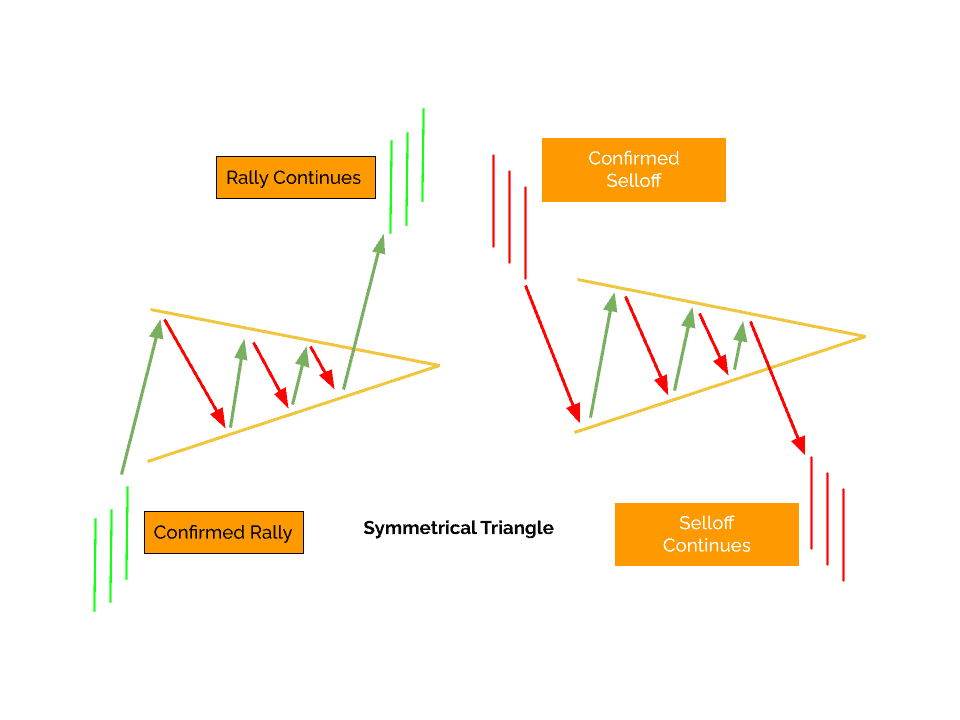
| Symmetrical | Neutral structure, continuation bias | Rally or Selloff |
| Ascending | Bullish continuation | Rally only |
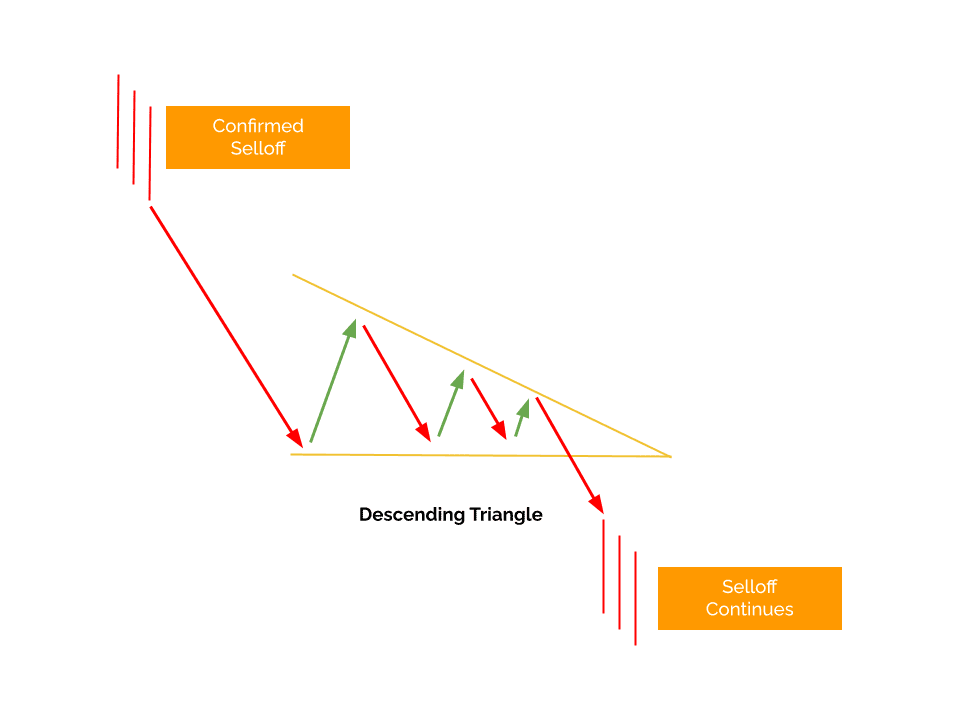
| Descending | Bearish continuation | Selloff only |
Triangles are not reversal patterns. They represent a pause, not a turning point.
Rule 1: All Triangle Patterns Resolve With a Breakout or Breakdown
Every Triangle Pattern ends the same way: price breaks out or breaks down.
The psychology behind triangles is simple. Buyers and sellers are locked in a narrowing debate over price. Once that debate resolves, price moves decisively in one direction.
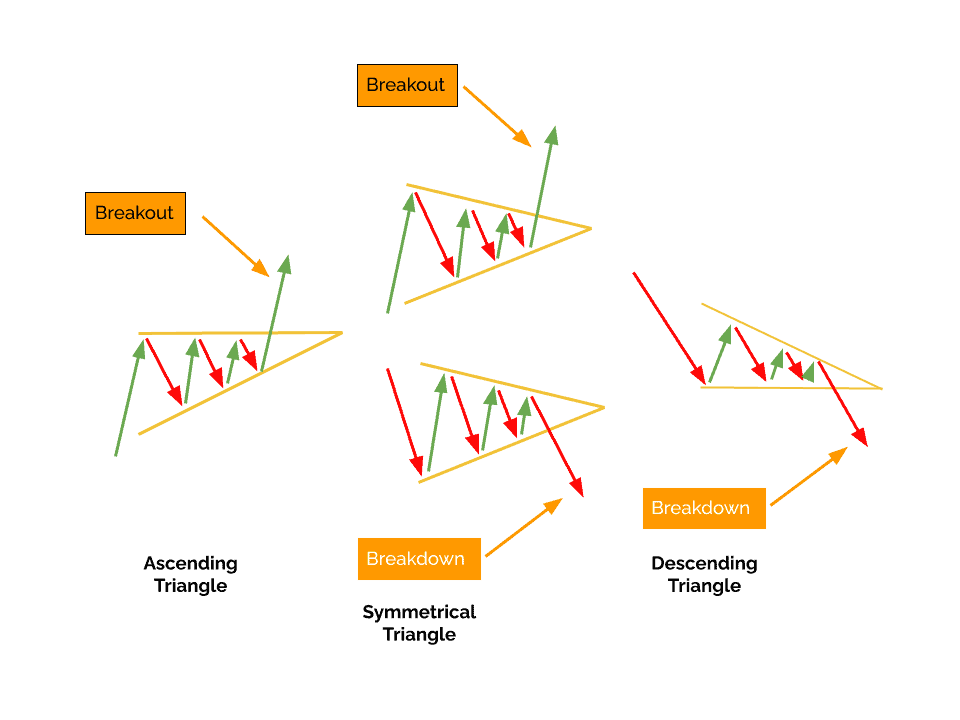
A triangle without a breakout is not a trade. Entries should occur only after confirmation, never within the pattern.
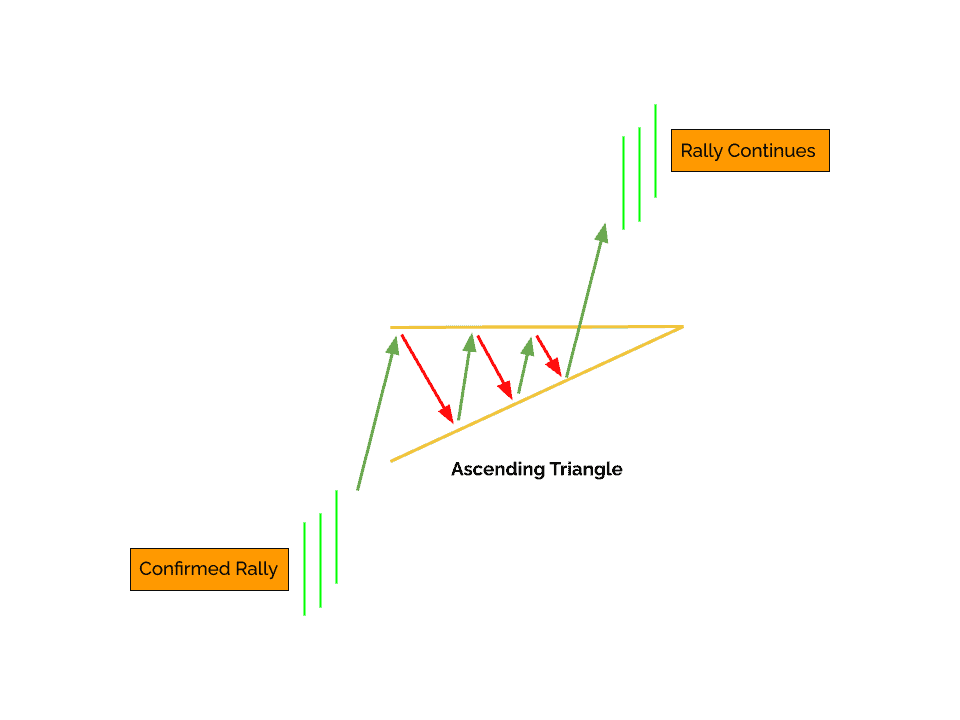
Rule 2: All Triangle Patterns Are Continuation Patterns
Triangles form during existing trends and signal that price is likely to continue in its original direction once consolidation ends.
They appear when Momentum slows, often due to:
- Profit-taking
- Overbought or Oversold conditions
- Pending economic news
- Trader uncertainty after a strong move
Once uncertainty clears, trend and momentum resume.
Continuation Logic by Triangle Type
| Triangle Type | Continues Which Direction |
| Ascending | Upward (Bullish) |
| Descending | Downward (Bearish) |
| Symmetrical | Same direction as prior trend |
If there is no clear trend before the triangle forms, do not trade it.
Rule 3: Context Determines Whether a Triangle Is Tradable
Context is the most common reason traders misread Triangle Patterns.
Required Context for Each Triangle
| Triangle Type | Valid Market Condition |
| Ascending | Confirmed Rally |
| Descending | Confirmed Selloff |
| Symmetrical | Rally or Selloff |
| Any Triangle | Not valid in Neutral markets |
Neutral markets are already consolidations.
A consolidation inside a consolidation does not create reliable breakouts.
A consolidation inside a consolidation does not create reliable breakouts.
If price breaks upward after a rally, trade long.
If price breaks downward after a selloff, trade short.
Looking for a Strategy?
Download the Six Basics of Chart Analysis and sign up for Forex Forecast to learn a bottom-up approach to analyzing Forex markets and weekly market updates.
Can You Use a Triangle Line as a Stop?
Yes — but with caution.
Pattern lines can be used for stops, but horizontal support and resistance take priority.
Why This Matters
- Position traders respect support and resistance first
- Short-term traders focus more on pattern structure
- Larger traders control price over time
When in doubt, defer to support and resistance, not pattern lines.
Why Triangle Patterns Work So Well for Position Trading
Triangle Patterns are especially effective on weekly and daily charts, where position traders operate.
Advantages for Position Traders
- Longer consolidation improves reliability
- Breakouts often trigger multi-week moves
- Cleaner structure reduces noise
- Better risk-reward opportunities
Time is a feature, not a drawback, in triangle trading.
Conclusion
Triangle Patterns are powerful continuation tools when traded with discipline and context. By following the three rules — breakout confirmation, continuation logic, and proper market context — traders can avoid false signals and improve consistency.
Used correctly, triangles offer clean structure, strong Momentum alignment, and excellent risk-reward opportunities, especially for position traders.
What’s the Next Step?
Select a few currency pairs and start identifying Triangle Patterns only after confirming trend direction. Study how price behaves before and after breakouts, and note where support, resistance, and Momentum align.
If you want a structured framework for doing this consistently, download the Six Basics of Chart Analysis. It provides a complete process for combining trend, momentum, chart patterns, and support/resistance.

When you get the Six Basics, you’ll also receive Forex Forecast every Sunday — completely free.
Five-Question Knowledge Check
Quiz: Triangle Patterns
- What market condition invalidates all Triangle Patterns?
A. High volatility
B. Neutral markets
C. Wide ranges
D. News events - Which triangle type is bullish by design?
A. Symmetrical
B. Descending
C. Rectangle
D. Ascending - When should a triangle trade be entered?
A. Inside the pattern
B. At the apex
C. After confirmed breakout
D. After first touch - Which trader group gives more weight to support and resistance?
A. Scalpers
B. Day traders
C. Swing traders
D. Position traders - Why are triangle patterns effective for position trading?
A. They require no confirmation
B. They appear frequently
C. They form quickly
D. They allow time for consolidation
Answer Key
- B
- D
- C
- D
- D
Forex Trading Disclosure Statement
Risk Warning:
Forex trading involves significant risk and may not be suitable for all investors. You may lose more than your initial investment. Only trade with money you can afford to lose.
Market Risks and Volatility:
Currency prices move based on global events, economic data, and geopolitical changes. Volatility can cause sudden, unexpected losses.
Leverage Risks:
Leverage increases both potential gains and potential losses. Use it cautiously.
Technology Risks:
Trading platforms can experience outages, delays, or pricing errors that affect trades.
No Guaranteed Results:
Past performance does not guarantee future outcomes. No strategy eliminates all risk.
Educational Purpose Only:
The information provided is for education, not financial advice. Consult a licensed professional before trading.
Responsibility:
You are responsible for your own trading decisions and risk management.