
Trend trading is one of the most widely used strategies in the foreign exchange (Forex) market and across other financial markets.
It involves identifying the prevailing market direction and trading in alignment with it. The core idea is simple: join the market’s momentum rather than fight against it.
Traders assume that if prices are moving consistently upward or downward, the trend is likely to continue.
This guide will walk you through six key trend-trading tactics, the most popular technical indicators for identifying trends, the differences between short-term and long-term trend trading, and how to combine trends with other tools for better results.
TL;DR – Master These 6 Trend Trading Tactics
This article teaches you how to identify and trade with the prevailing market direction using six core techniques: Moving Averages, MACD, ADX, RSI, Swing Highs/Lows, and Channel Lines.
You’ll learn why trend ≠ momentum, how short-term and long-term trend trading differ, and why indicators often lag and must be paired with price action.
Put it into practice by combining trend, support/resistance, momentum, and candlestick confirmation to improve entries, stops, and exits.
Quick Reference: 6 Trend Trading Tactics
|
Tactic / Indicator |
What It Measures |
How Traders Use It |
Strengths |
Weaknesses |
|
Moving Averages (MA) |
Price averages over time |
Define bullish/bearish trends |
Simple, widely followed |
Lagging, late signals |
|
MACD |
Convergence/divergence of EMAs |
Crossover & zero-line signals |
Captures shifts in momentum |
False signals, still lags |
|
ADX |
Trend strength & direction |
ADX > 25 with DI crossover |
Distinguishes trends from ranges |
Complex, inconsistent |
|
RSI |
Price momentum (0–100) |
Overbought/oversold & divergence |
Useful in ranges |
Misused as trend tool |
|
Swing Highs/Lows |
Market structure |
Identify uptrends or downtrends |
Price-action focused |
Subjective, inconsistent |
|
Channel Lines |
Trend channels |
Spot breakouts & continuation |
Tracks price behavior |
Subjective, false breaks |
Table of Contents
- TL;DR – Master These 6 Trend Trading Tactics
- Quick Reference: 6 Trend Trading Tactics
- What Does Trend Trading Mean?
- Popular Trend Trading Indicators and Techniques
- Short-Term vs. Long-Term Trading with Trends: Is There a Difference?
- Do Trends Have Strength? Are There Strong Trends or Weak Trends?
- What Trading Strategies Work Best With Trends?
- Does Trend Trading Work with Forex?
- How Should Trends Be Used in Trading?
- How to Use Trends Effectively
- Quiz: Understanding Trend Trading
- What’s the Next Step?
- Frequently Asked Questions
- Forex Trading Disclosure Statement
What Does Trend Trading Mean?
Trend trading means opening and closing trades based on the direction of a market’s prevailing trend.
The strategy assumes that a market moving higher will continue to rise, and a market moving lower will continue to fall. Since markets often move in ranges, identifying a genuine trend can provide opportunities for profitable trades.
Traders typically design rules for when to enter, where to set stop losses, and how to exit.
Popular Trend Trading Indicators and Techniques
Most traders rely on technical indicators or price action techniques to identify trends. Indicators help filter out market noise and define clear trading rules. Below are six of the most widely used approaches.
1. Moving Averages (MA)
A moving average (MA) smooths price data by averaging past prices over a chosen period.
Common settings include the 20-day, 50-day, 100-day, and 200-day simple moving averages (SMA).
If the line slopes upward, the market is in an uptrend. If the line slopes downward, the market is in a downtrend.
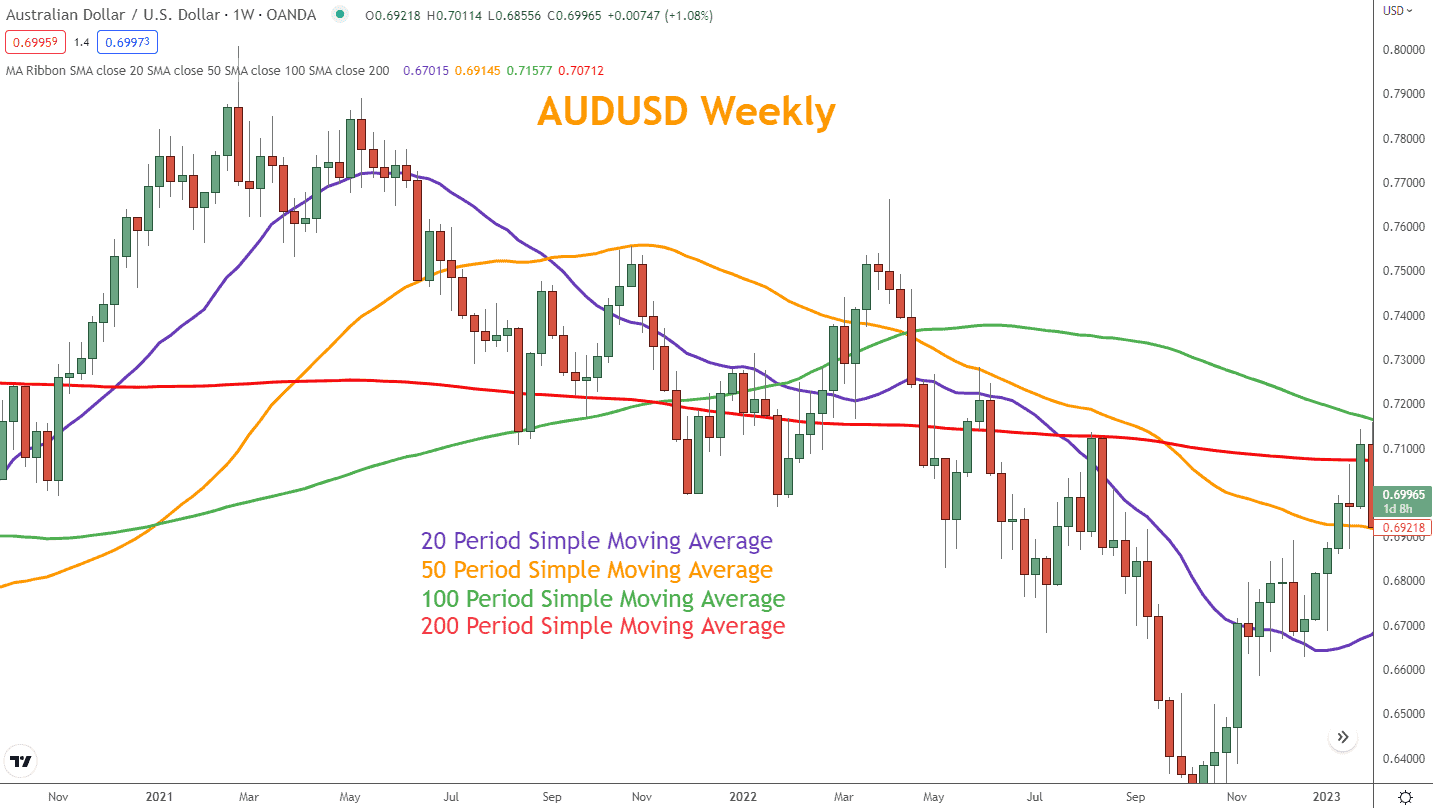
Traders often combine multiple moving averages to confirm direction. However, since MAs lag behind price, they can cause late entries and exits.
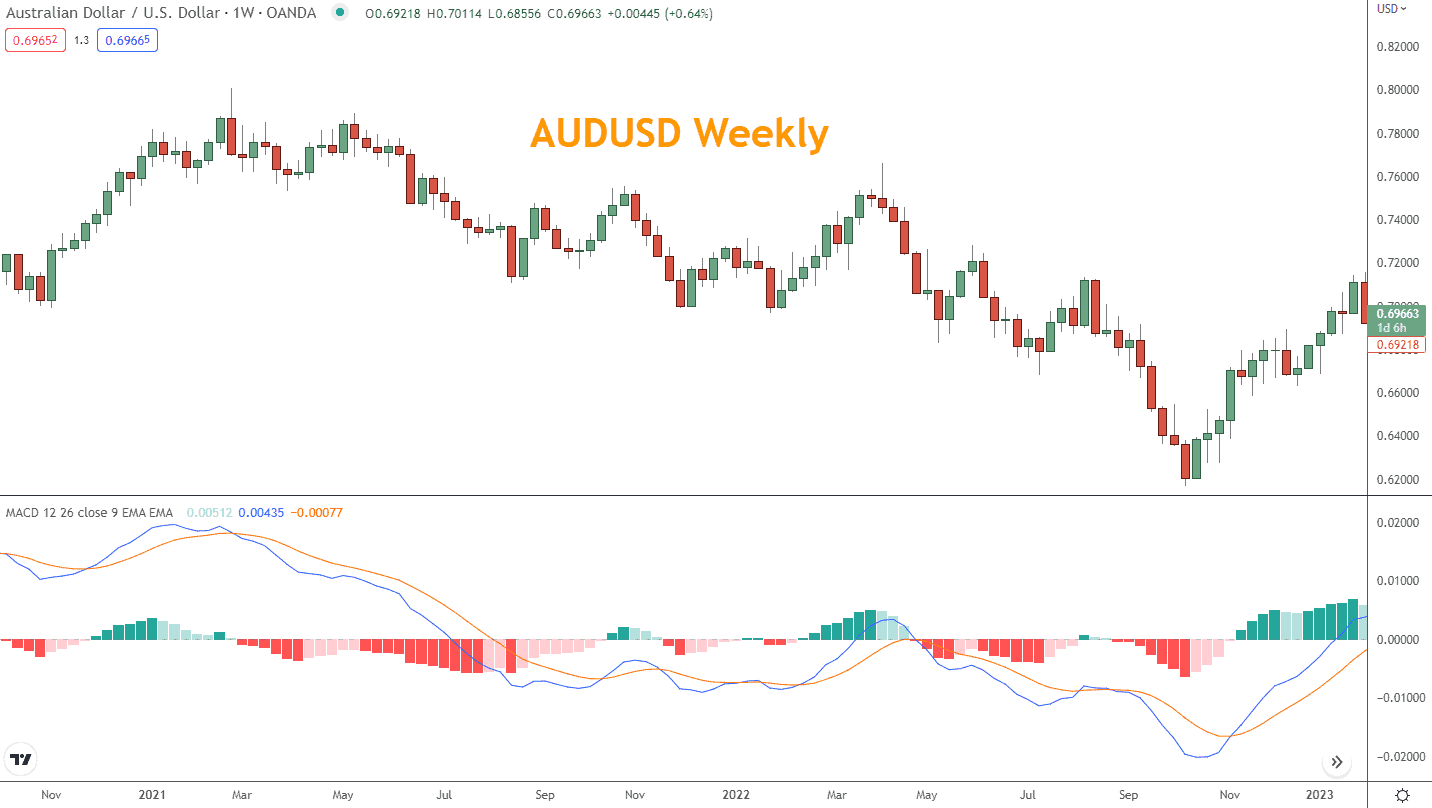
2. MACD (Moving Average Convergence/Divergence)
The MACD measures the relationship between two exponential moving averages (EMAs). It uses two lines (typically 12 and 26-period EMAs) and a histogram to signal trend shifts.
Line crossovers and moves above or below the zero line are common trade signals. Because it emphasizes recent prices, MACD reacts faster than SMAs.
Still, it remains a lagging indicator and is prone to false signals in choppy markets.
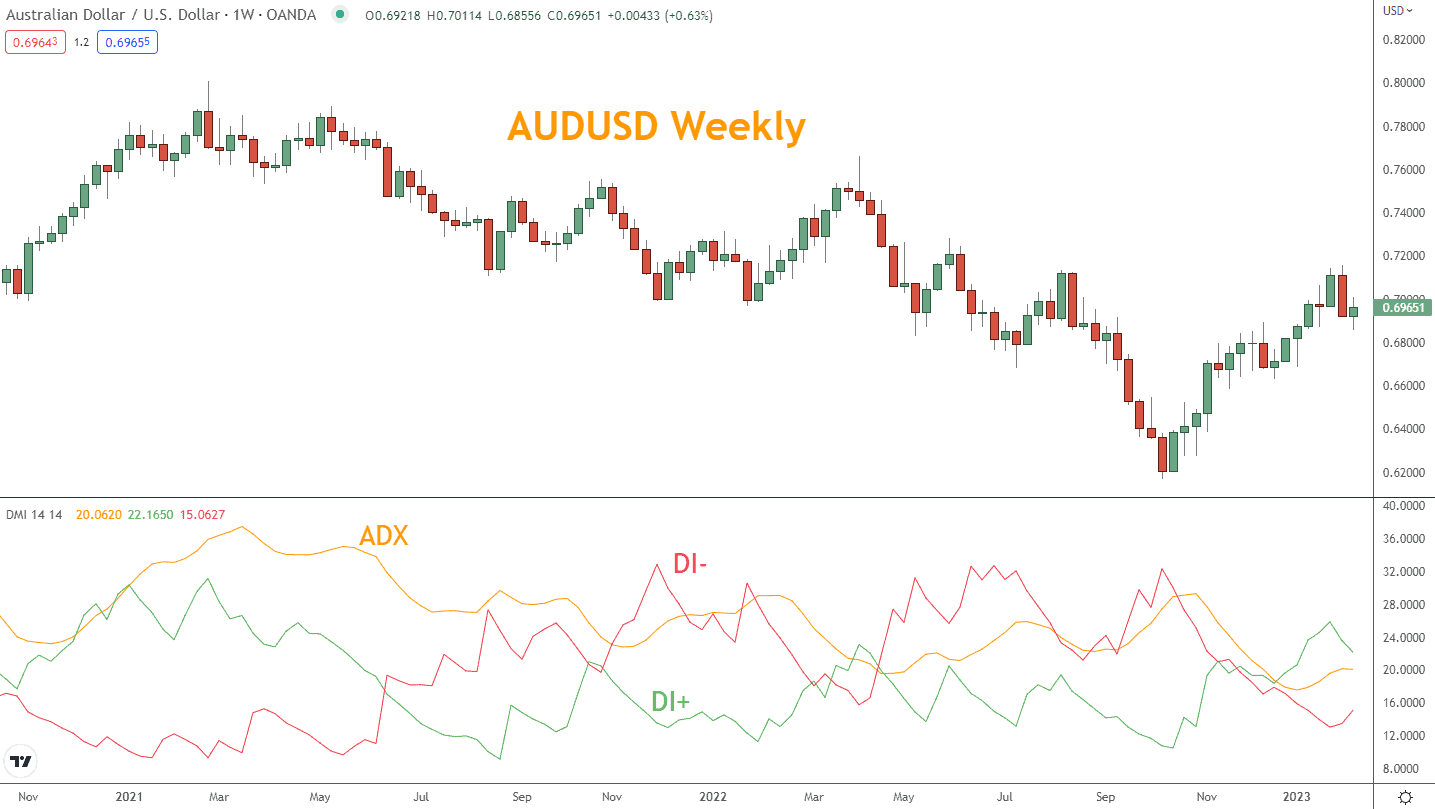
3. ADX (Average Directional Index)
The ADX indicator, developed by Welles Wilder, measures trend strength using three lines: ADX(overall strength), DI+(bullish), and DI-(bearish).
A typical rule is to trade when ADX rises above 25and one DI line crosses the other. While it can help confirm trend strength, the ADX’s smoothing and complexity often delay signals and produce inconsistent results.
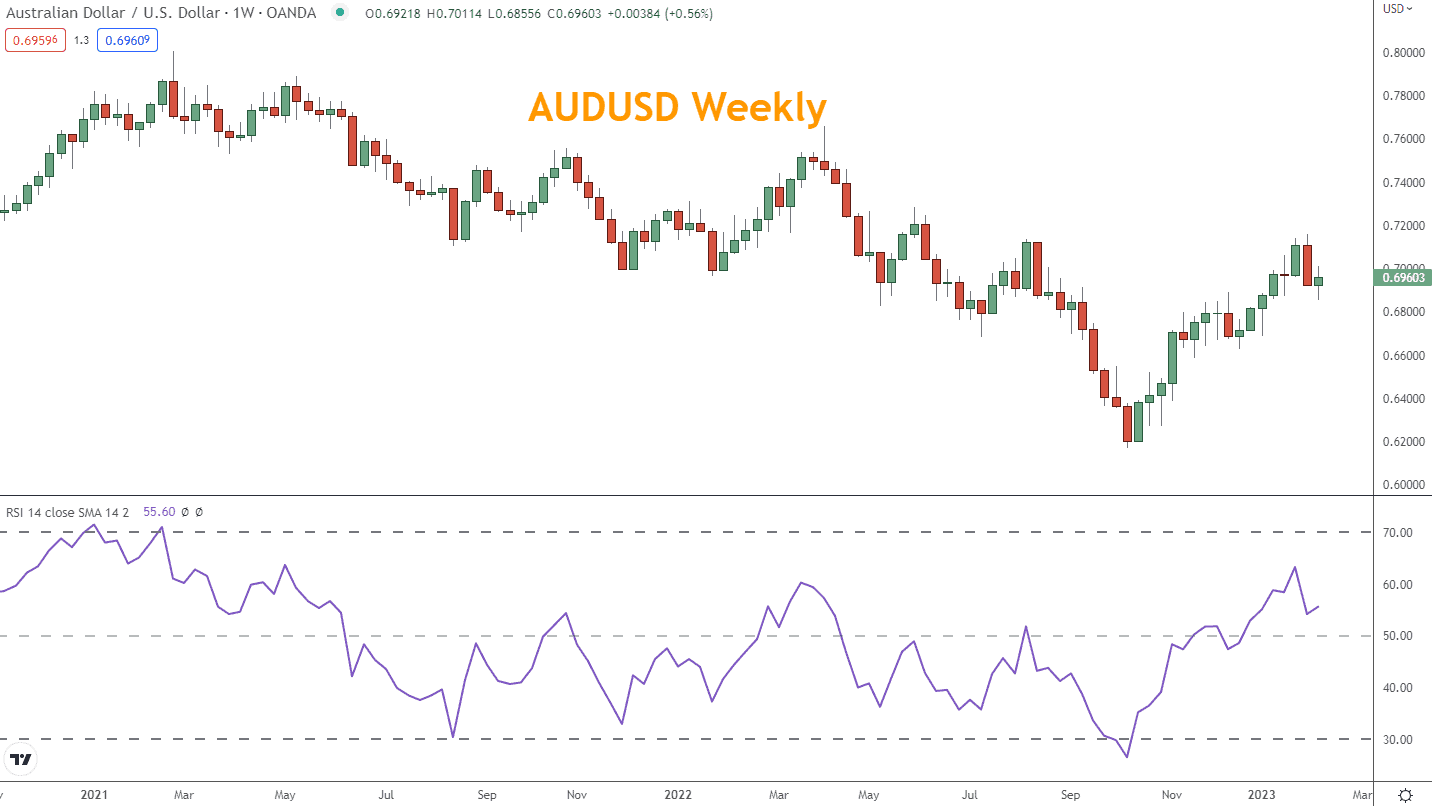
4. RSI (Relative Strength Index)
Although often cited in trend discussions, the RSI is a momentum oscillator. It measures the speed and magnitude of price changes on a scale from 0–100.
Above 70 is overbought, below 30 is oversold, and divergence between RSI and price may suggest a weakening trend. RSI works best for short-term traders; used alone, it has limited value in long-term trend trading.
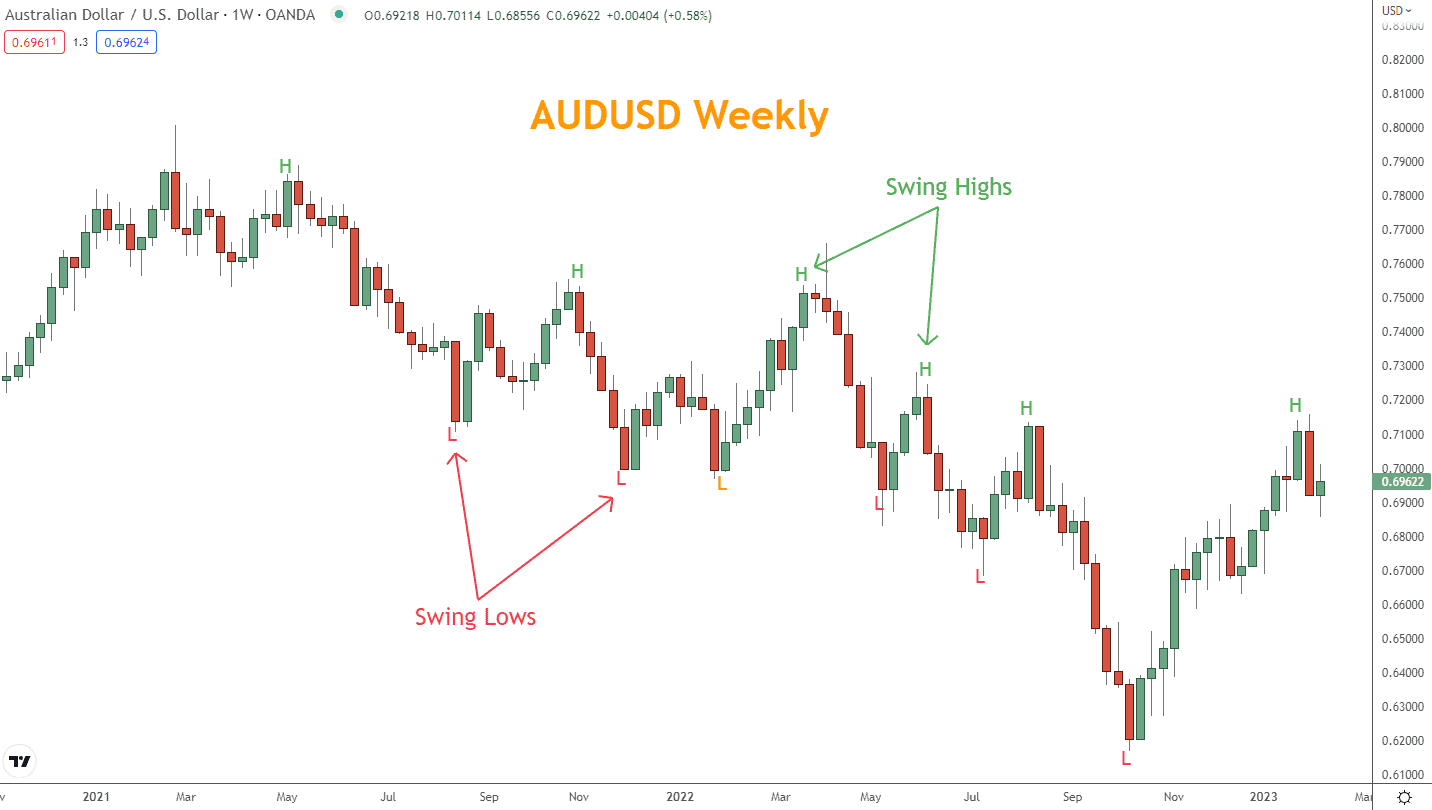
5. Swing Highs and Lows
Swing analysis focuses on identifying higher highs and higher lows (bullish trends) or lower highs and lower lows (bearish trends).
This method brings traders closer to price action and market psychology. However, it is subjective, as traders may interpret swings differently, causing inconsistent identification and missed entries.
Learn more about swing highs and lows – How to Trade Swing Highs and Swing Lows: 3 Essential Rules
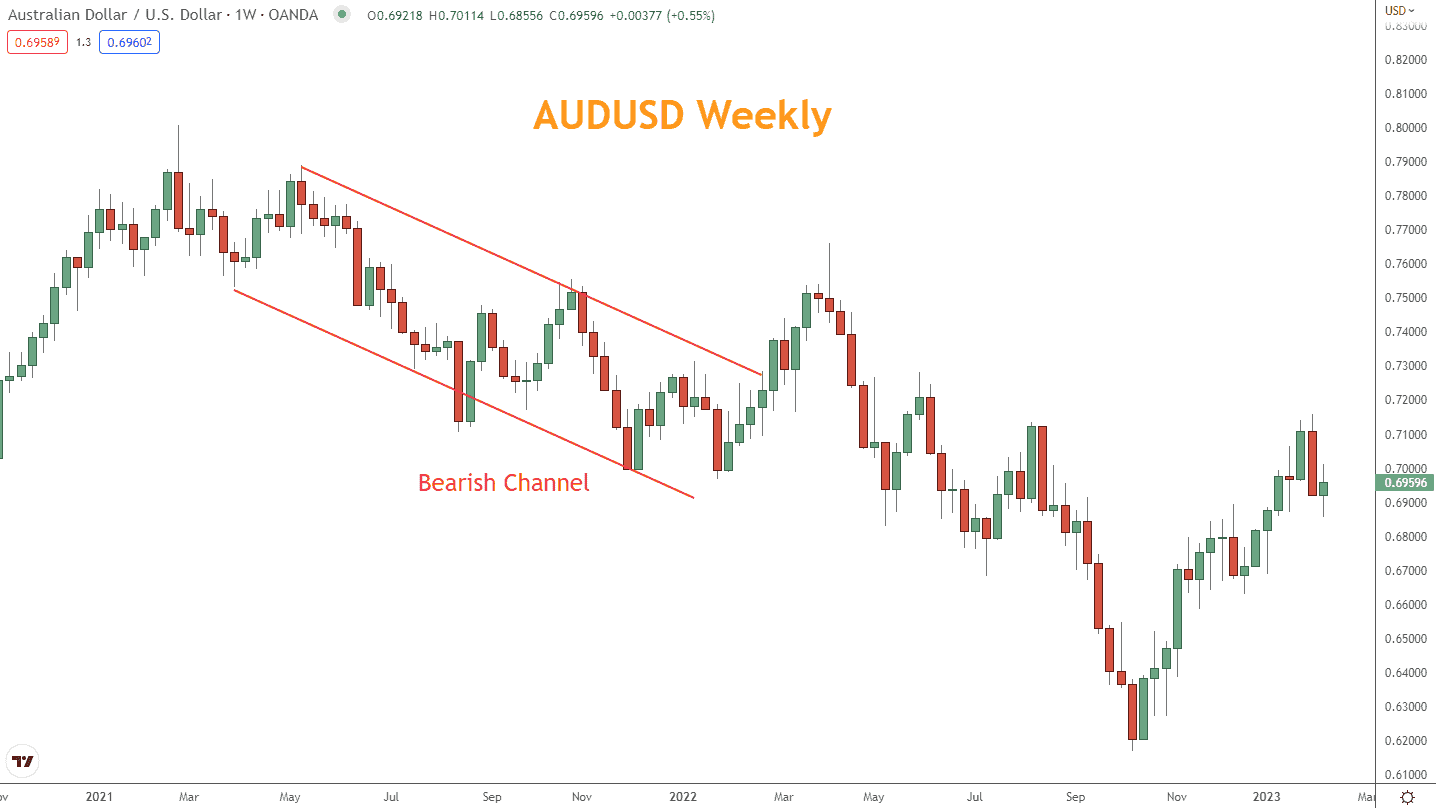
6. Channel Lines (Trendlines)
Channel lines are drawn by connecting swing highs and lows on a chart, mapping rising, falling, or sideways channels.
A breakout above a descending channel may signal a new uptrend; a breakdown below an ascending channel may confirm a bearish trend.
Like swing analysis, channel lines are subjective and prone to false signals, but they help traders stay in tune with market behavior.
Short-Term vs. Long-Term Trading with Trends: Is There a Difference?
Short-term traders aim to capitalize on intraday or multi-day moves within broader trends. In contrast, long-term trend trading aligns with institutional flows and the actions of larger market participants.
Actual trend trading is most reliable for position trading on weekly or monthly charts. Short-term versions rely more on volatility and carry higher risk. Aligning with higher timeframes generally provides better reliability.
Do Trends Have Strength? Are There Strong Trends or Weak Trends?
Many traders confuse trend with momentum. Trend refers to the general direction over time, while momentum refers to the speed or force of price movement.
A market can accelerate without changing trend, and momentum can fade without reversing trend. Keeping this distinction clear helps avoid misreading short-term surges as long-term shifts.
Looking for a Strategy?
Download the Six Basics of Chart Analysis and sign up for Forex Forecast to learn a bottom-up approach to analyzing Forex markets and weekly market updates.
What Trading Strategies Work Best With Trends?
Trend trading strategies often rely on pullbacks for better entries and on breakouts/breakdowns to time moves out of ranges.
Each approach benefits from confirmation: use momentum, candlestick signals, and support/resistance to validate setups and refine stop placement and position sizing.
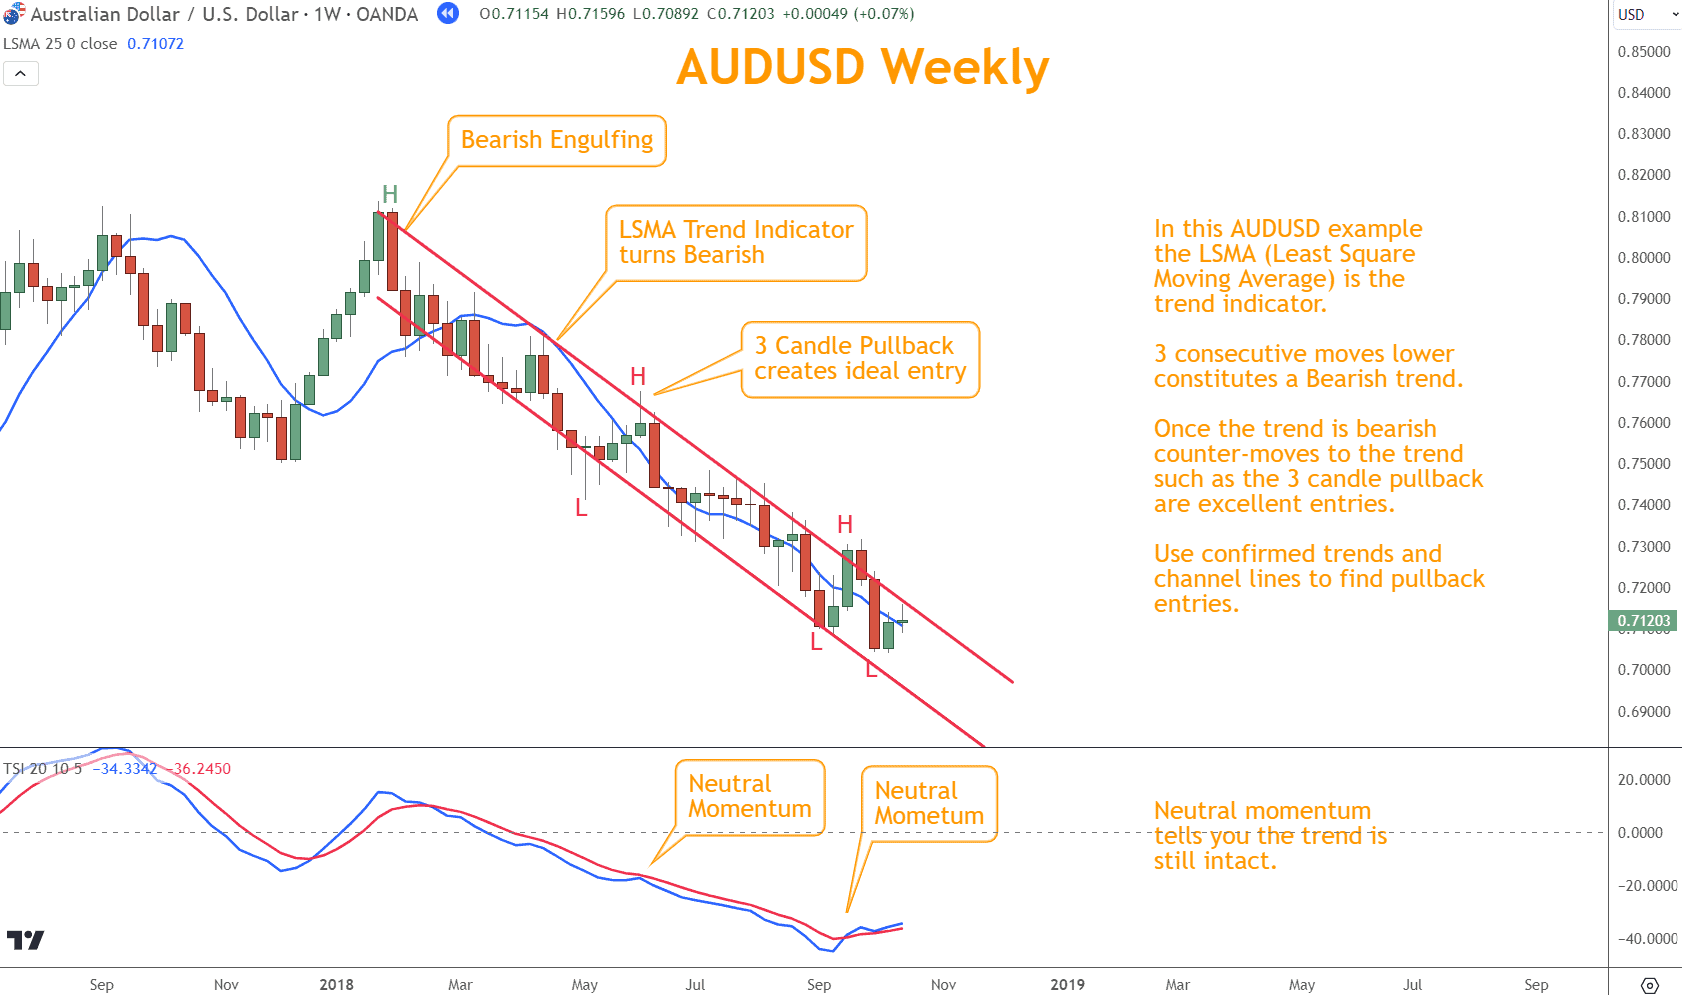
How to Use Trends to Trade Pullbacks
Trading pullbacks means entering in the direction of the broader trend after a brief counter-move.
In an uptrend, wait for a dip to buy; in a downtrend, look for a bounce to sell. Confirm with momentum indicators (e.g., RSI or TSI), the slope of your trend tool (e.g., LSMA), and a reversal candlestick like a Shooting Star or Hammer.
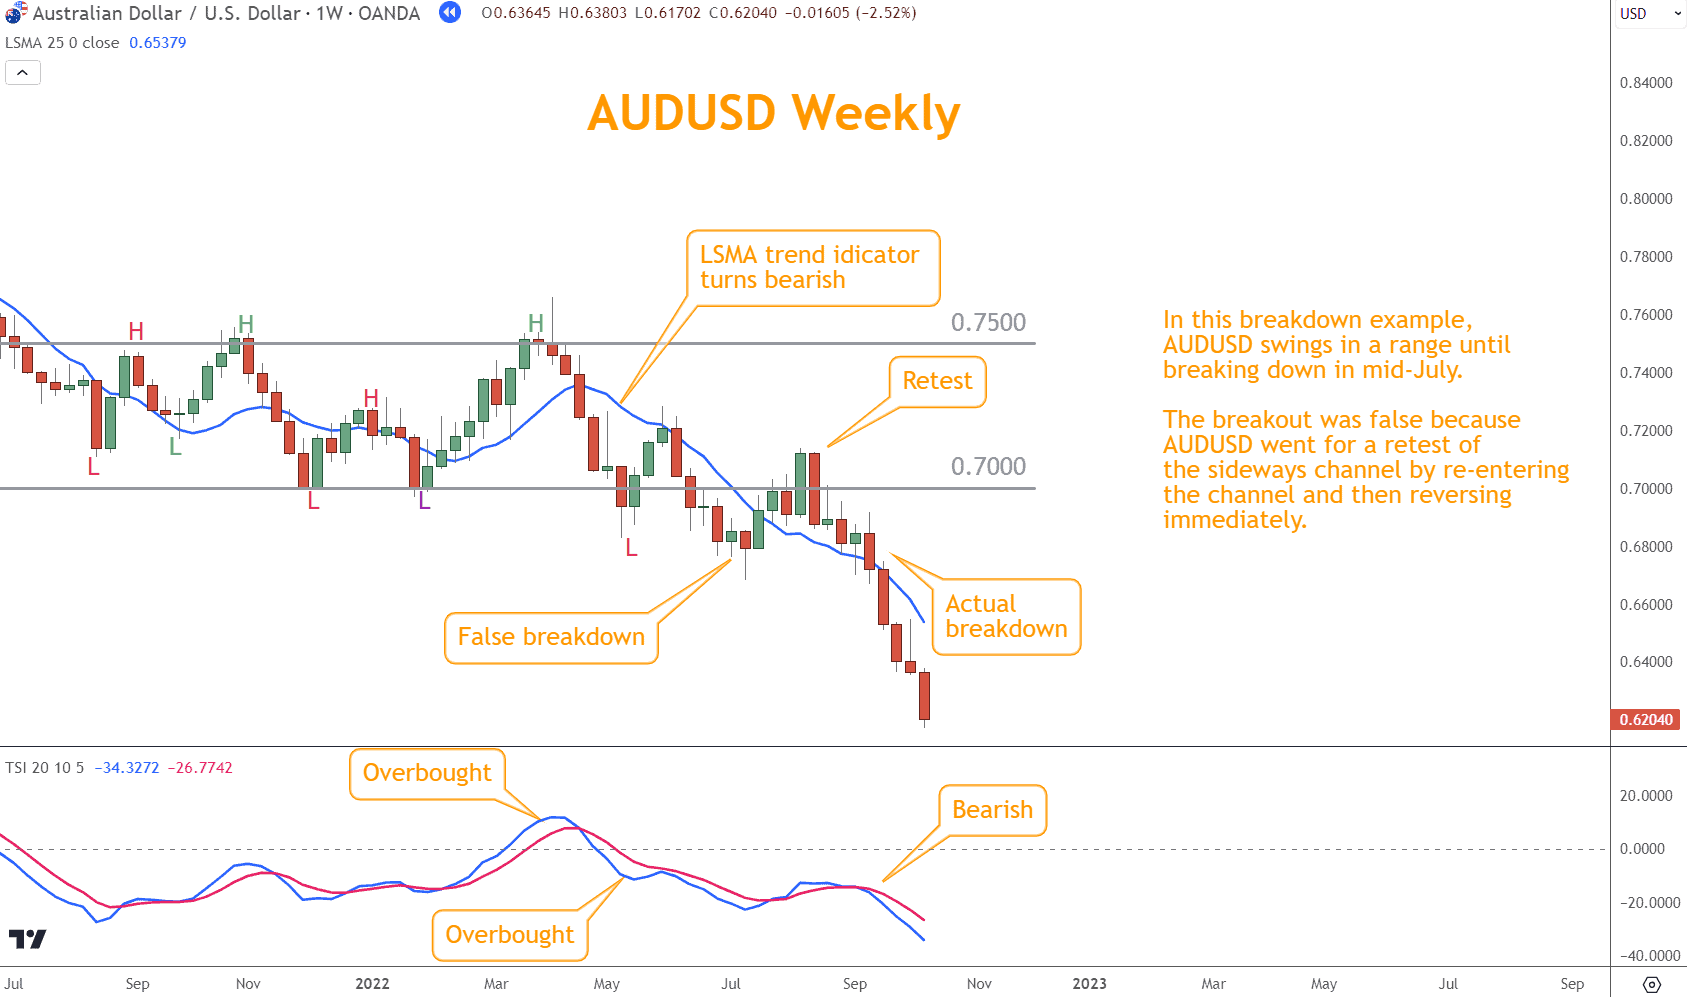
Using Trends to Trade Breakouts and Breakdowns
Breakouts occur when the price clears a resistance level; breakdowns happen when the price falls through a support level.
Confirm with a trend tool, horizontal levels, and momentum. Expect retests of broken levels and plan stops and position size accordingly. False breaks are common during shifts from neutral to trending, so allow for noise.
Does Trend Trading Work with Forex?
Trend indicators are popular in Forex, but most lag and can be inconsistent during consolidations or volatile conditions.
Moving averages and MACD often react too late; ADX can be complex without improving timing; swing and channel methods are subjective. Combining trends, momentum, candlesticks, and support/resistance yields more actionable signals than relying on any single tool.
How Should Trends Be Used in Trading?
Trends are most valuable for longer-term position trading on weekly charts. Short-term traders can reference higher timeframes, but consolidations and transitions can mislead.
Blend trend analysis with reversal tools and market structure to inform entries, exits, and position sizing. The aim is not only to identify direction, but to execute with confirmation and discipline.
How to Use Trends Effectively
Using trends effectively means anchoring your view to the higher timeframe, then drilling down for precise entries.
Build confluence by layering trend direction, support/resistance, momentum, and candlestick confirmation. This integrated approach strengthens the quality of trades and reduces noise-driven errors.
- Start with the higher timeframe to define the primary trend.
- Mark key support and resistance levels, as well as channel boundaries.
- Validate with momentum readings and look for reversal candles at decision points.
- Set stops based on structure, not just indicator lines, and size positions accordingly.
Quiz: Understanding Trend Trading
Test your comprehension with five quick questions. Aim for clear, principle-based answers that reflect the distinctions and best practices covered above.
- Which statement best distinguishes trend from momentum?
a) Trend is speed; momentum is direction
b) Trend is direction; momentum is speed/force
c) Both trend and momentum mean the same thing
d) Trend only applies to intraday charts - What is the primary weakness of moving averages and MACD for timing?
a) They are subjective
b) They repaint
c) They lag price and give late signals
d) They cannot be backtested - Which combination best builds confluence for a breakout entry?
a) Trend tool + support/resistance + momentum confirmation
b) RSI alone
c) ADX alone
d) Round numbers alone - Which statement about short-term vs. long-term trend trading is most accurate?
a) Short-term trend trading is always safer
b) Long-term trend trading aligns with institutional flows and is generally more reliable
c) Trends only exist on daily charts
d) Short-term and long-term trends never conflict - What is the recommended role of candlestick patterns within a trend strategy?
a) Replace all other indicators
b) Provide confirmation at decision levels within the broader trend framework
c) Determine stop placement without structure
d) Only signal exits, never entries
Answer Key
- b – Trend is direction; momentum is speed/force
- c – They lag price and give late signals
- a – Trend tool + support/resistance + momentum confirmation
- b – Long-term trend trading aligns with institutional flows and is generally more reliable
- b – Confirm decision levels within the broader trend framework
What’s the Next Step?
Choose a Forex pair and identify its current trend. Then, test it against other tools, such as candlesticks, momentum indicators, and support/resistance levels.
To build a stronger foundation, download the Six Basics of Chart Analysis (free) and subscribe to the Forex Forecast for weekly trade setups, case studies, and education. Both resources help you refine your use of trends and apply them more effectively.

Frequently Asked Questions
What is Trend Trading?
Trend trading is a strategy where traders follow the overall market direction to make buy or sell decisions. The goal is to profit from sustained price movement.
How Can I Identify a Trend?
Traders use moving averages, swing highs/lows, and channel lines. Higher highs and higher lows confirm an uptrend; lower highs and lower lows indicate a downtrend.
What Are the Best Tools for Trend Trading?
Moving averages, MACD, RSI, and trendlines are popular. Combining them with candlestick patterns and momentum indicators provides stronger confirmation.
Forex Trading Disclosure Statement
Risk Warning:
Forex trading involves significant risk and may not be suitable for all investors. The leveraged nature of Forex trading can work both for and against you, leading to substantial gains or losses. Before trading Forex, you should carefully consider your financial objectives, experience level, and risk tolerance. It is possible to lose more than your initial investment, and you should only trade with money you can afford to lose.
Market Risks and Volatility:
Forex markets are influenced by global economic, political, and social events, which can result in unpredictable price movements. High market volatility can lead to sudden and substantial changes in currency values, potentially causing losses that exceed your initial deposit.
Leverage Risks:
Leverage amplifies both potential gains and potential losses. While leverage can increase profitability, it also increases the risk of significant losses, including the loss of your entire trading capital.
Trading Tools and Technology Risks:
Forex trading platforms, including those offered by brokers, are subject to technology risks, such as system failures, latency issues, and potential errors in price feeds. Traders should be aware that these risks can impact the execution of trades and trading outcomes.
No Guarantee of Profitability:
Past performance in Forex trading is not indicative of future results. There is no guarantee that you will achieve profits or avoid losses when trading Forex. Market conditions and individual trading strategies vary, and no trading system can eliminate the inherent risks of Forex trading.
Educational Purposes Only:
Any information provided about Forex trading, including strategies, analysis, or market commentary, is for educational purposes only and should not be considered financial advice. Consult a qualified financial advisor or tax professional before making any trading decisions.
Regulatory Compliance:
Forex trading is regulated differently in various jurisdictions. Ensure that you are trading with a licensed and compliant broker in your country of residence.
Responsibility:
You are solely responsible for your trading decisions and the associated risks. It is your duty to understand the terms and conditions of Forex trading, including margin requirements, stop-losses, and other risk management tools.
Acknowledgment:
By engaging in Forex trading, you acknowledge that you have read, understood, and accepted this disclosure statement. You accept full responsibility for the outcomes of your trading decisions and agree to trade at your own risk.