Trend following in Forex trading is a method that can help you profit from significant market movements.
By identifying the direction in which a currency pair moves, you can make informed decisions and open positions on its continued movement.
The importance of trend following cannot be overstated. It is foundational for achieving long-term success in the financial markets.
Understanding Market Trends: Bullish, Bearish, and Neutral
In Forex trading, a trend represents the general direction in which the market or a currency pair is moving.
Understanding these trends is crucial for developing effective trading strategies.
Trends can be classified into three main types: bullish, bearish, and neutral. Each type has distinct characteristics and implications for trading.
A bullish trend, often called an uptrend, is characterized by steadily rising prices.
In a bullish market, each successive peak (high) and trough (low) is higher than the ones found earlier in the trend. This pattern indicates that buyers control the market, pushing the prices upward.
Characteristics:
- Higher Highs and Higher Lows: This is the hallmark of a bullish trend, where the market consistently reaches higher prices.
- Strong Demand: A bullish trend usually indicates strong demand for the currency, often driven by positive economic indicators, optimistic market sentiment, or other factors that attract buyers.
- Slope of Moving Averages: In a bullish trend, moving averages (such as the 50-day or 200-day moving average) will slope upwards.
Trading Strategy: Consider entering long positions to profit from rising prices. Key strategies include buying on dips or at the breakout of resistance levels, with stop-losses placed below recent swing lows to protect against potential reversals.
Bearish Trend
Conversely, a bearish trend, or downtrend, is identified by declining prices. In this scenario, sellers dominate the market, resulting in lower highs and lower lows. This pattern suggests negative market sentiment, with prevailing selling pressure.
Characteristics:
- Lower Highs and Lower Lows: This pattern defines a bearish trend, indicating sustained selling pressure.
- Increasing Supply: An increase in supply relative to demand, possibly due to unfavorable economic developments or bearish market sentiment, drives prices down.
- Slope of Moving Averages: Moving averages will slope downwards in a bearish trend.
Trading Strategy: In a bearish trend, consider taking short positions. Selling on rallies or at the breakdown of support levels can be effective, with stop-losses appropriately placed above recent swing highs to mitigate risks.
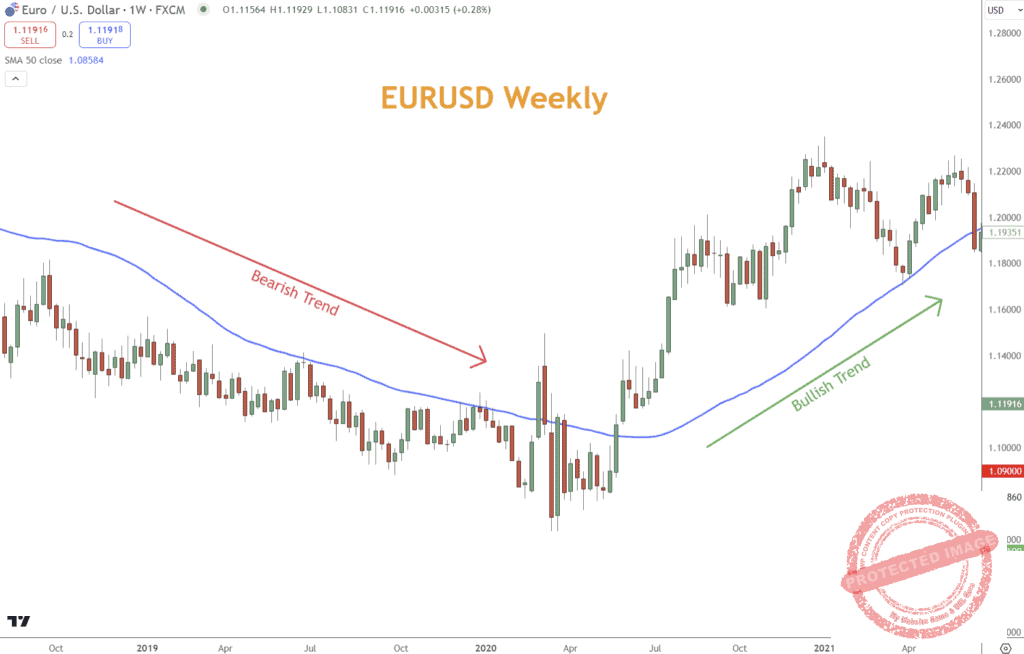
In the example below, prices run under the 50 simple moving average and eventually cross over.
When EURUSD is below the moving average, consider opening short positions on Rallies, whereas when prices run above the moving average, you can consider buying on dips in prices.
Neutral Trend
A neutral or sideways trend occurs when the price moves within a relatively stable range without forming new highs or lows. This trend indicates that neither the buyers nor the sellers are in total control and that the market is in equilibrium.
Characteristics:
- Flat Price Movements: Prices oscillate within a narrow range, reflecting a balance between supply and demand.
- Indecision: A neutral trend often represents a period of consolidation, where market participants are unsure or waiting for more information before making further commitments.
- Convergence of Moving Averages: During neutral trends, moving averages tend to flatten and converge, reflecting the lack of clear direction in the market.
Trading Strategy: Trading in a neutral market can be challenging due to the need for apparent directional movement. You might focus on range trading strategies, buying at the lower boundary of the range and selling at the upper boundary, with tight stop-losses to manage the risk of a breakout.
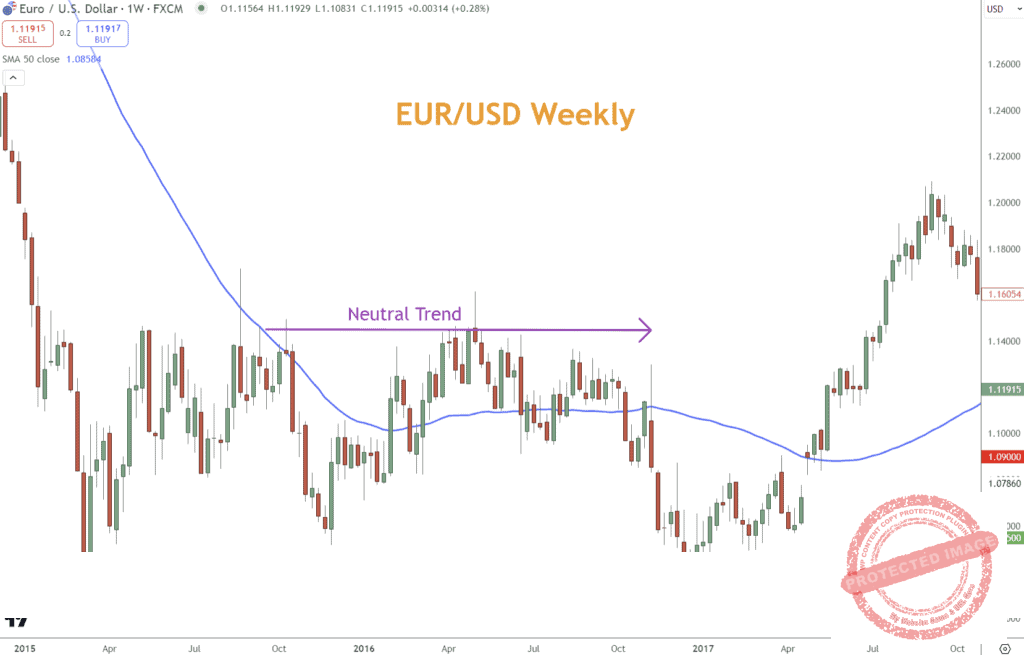
In the example below, EURUSD moves sideways, and buying and selling opportunities best present themselves at price extremes.
By accurately identifying a market’s trend, you can tailor your strategies to align with the prevailing market conditions, enhancing their potential for profitability and reducing risk exposure.
Understanding Trend Following Indicators
To effectively follow trends, utilize various technical indicators that help indicate the direction and strength of the trend. Here are some of the most commonly used indicators:
- Moving Averages (MA): Moving averages are essential tools in a trend follower’s arsenal.
- The Simple Moving Average (SMA) and the Exponential Moving Average (EMA) are two types commonly used.
- These averages help smooth out price data to create a single flowing line, which makes it easier to identify the trend’s direction.
- For example, a common trading strategy might involve looking for instances where a short-term moving average crosses over a long-term moving average, known as a “golden cross,” signaling the potential start of an uptrend.
- The Simple Moving Average (SMA) and the Exponential Moving Average (EMA) are two types commonly used.
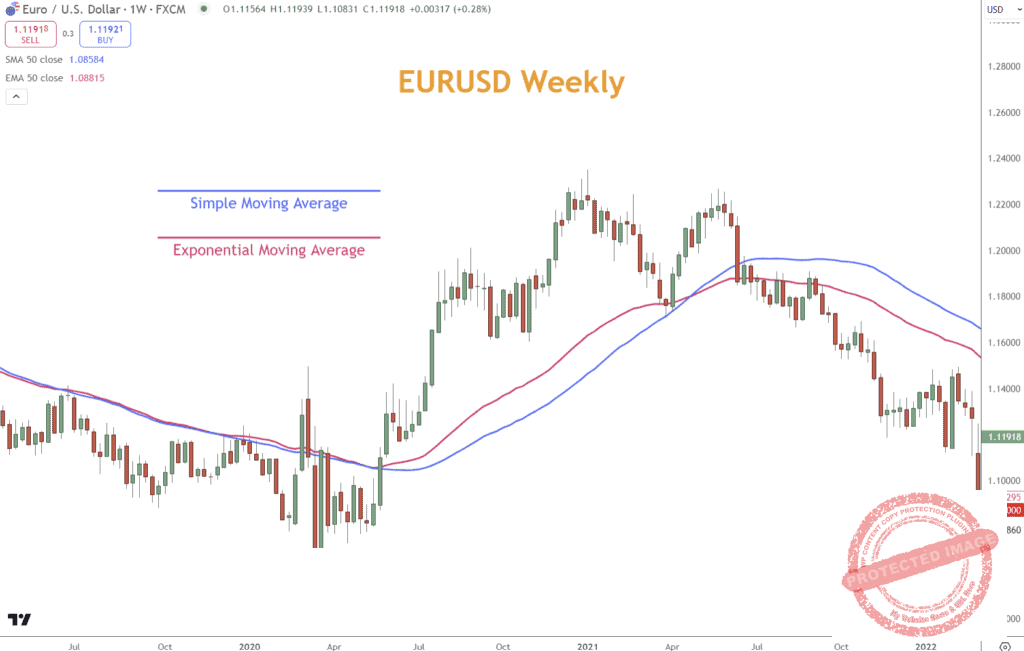
The example below shows the difference between a simple moving average (SMA) and an exponential one. The exponential moving average (EMA) is more sensitive to recent price changes and reacts more quickly.
- Moving Average Convergence Divergence (MACD): The MACD is a more complex tool that helps demonstrate the speed of price change and the direction of a trend.
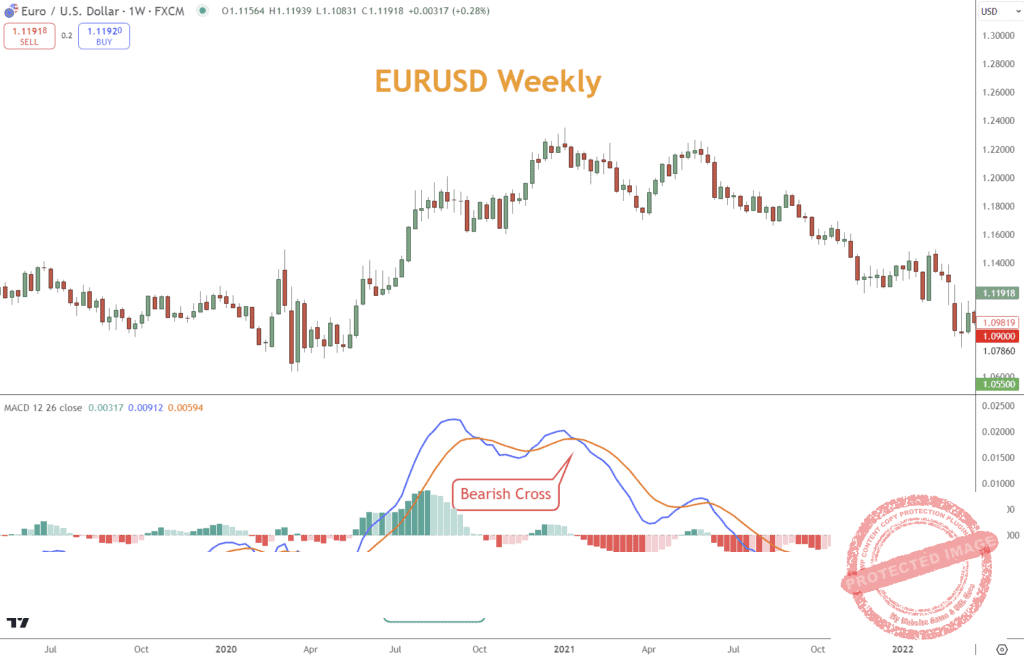
- It consists of two moving averages that converge, diverge, and cross. Look for the crossover of these lines as signals of potential market turns from bullish to bearish or vice versa.
The example below illustrates a MACD bullish cross coinciding with a rally and a bearish cross coinciding with a selloff.
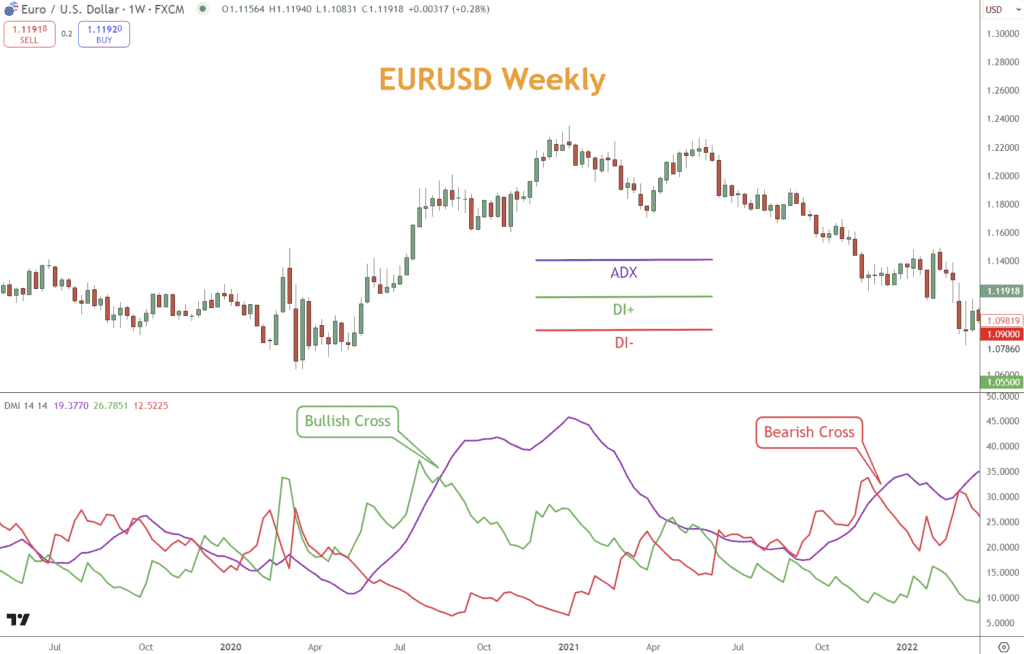
- Average Directional Index (ADX) and Directional Movement Indicators (DMI): The ADX, part of the Directional Movement System, measures the strength of a trend, while the accompanying Directional Movement Indicators (DMI) consist of two lines: the Positive Directional Indicator (+DI) and the Negative Directional Indicator (-DI).
- These components help you determine a trend’s presence and strength.
- The +DI measures the upward trend strength, while the -DI measures the downward trend strength.
- Look for crossovers between these two lines as signals for potential trend changes and use the ADX to confirm that the market is in a strong trend, either up or down.
- These components help you determine a trend’s presence and strength.
In the example below, the ADX crosses above the bullish DI+, indicating a rally, and after a correction, does the same with the bearish DI- line.
Pros and Cons of Trend Following
Trend following is a fundamental trading strategy widely used in Forex trading due to its potential to harness significant market movements.
However, like any trading strategy, it has advantages and disadvantages.
Understanding these can help you optimize your approach, manage risks effectively, and increase your chances of success in the volatile Forex market.
Pros of Trend Following
- Profitability in Large Movements: One of the most significant benefits is its ability to provide substantial returns during extended market trends.
- Since trends can last from several days to months or even longer, this strategy allows you to accumulate significant gains from these movements.
- Simplicity and Accessibility: Trend following strategies are relatively simple to understand and implement.
- Traders of all levels can utilize trend indicators to make informed decisions, making them accessible to novices and experienced traders.
- Risk Management: Effective strategies include strict risk management rules, such as stop-losses and position sizing, which help protect you against significant losses.
- These tools allow you to set precise points where they will exit a losing trade, thus managing potential losses proactively.
- Diversification: Trend following does not depend on a specific asset class or market, making it a versatile strategy applicable across different instruments, including currencies, commodities, and stocks.
- This flexibility allows you to diversify your portfolios and spread risk across various markets.
- Emotional Detachment: Trend followers can minimize emotional decision-making by relying on objective indicators to dictate their entries and exits.
- This detachment helps maintain discipline and adherence to strategy, even in volatile or uncertain market conditions.
Cons of Trend Following
- Lagging Nature of Indicators: Most trend indicators are based on historical price data and are, as a result, inherently lagging.
- This delay can lead to missed opportunities or late entries and exits, which might reduce potential profits or increase losses.
- Underperformance in Range-Bound Markets: These strategies typically perform poorly when the market lacks a clear direction or is in a sideways trend.
- These conditions can lead to numerous false signals and entry points, resulting in unprofitable trades.
- Capital-Intensive: Maintaining open positions in a trend following system can be capital-intensive, as trades may stay open for an extended period.
- This long exposure requires substantial capital, which might be locked up and unavailable for other trading opportunities.
- Psychological Challenges: Despite the advantages of emotional detachment, the long periods of inactivity and the necessity to endure pullbacks within a trend can test a trader’s patience and discipline.
- This aspect can be challenging for those accustomed to more frequent trading action.
- Dependence on Extended Trends: Since the success of this strategy hinges on the presence of long, sustained market trends, periods of consolidation or when the market is choppy can lead to significant drawdowns or stagnant performance.
By weighing these pros and cons, you can better prepare yourself for trading with trends.
Awareness of these factors not only aids in strategy optimization but also enhances overall trading discipline and risk management.

Combining Trend Following Indicators with Additional Analytical Tools
Integrating other analytical tools can enhance the effectiveness of all strategies in Forex trading.
While trend indicators like Moving Averages (MA), Moving Average Convergence Divergence (MACD), and the Average Directional Index with Directional Movement Indicators (ADX/DMI) provide a solid foundation for identifying and confirming trends, combining these with momentum indicators, Japanese candlestick patterns, chart patterns, and support and resistance levels can significantly refine trading strategies.
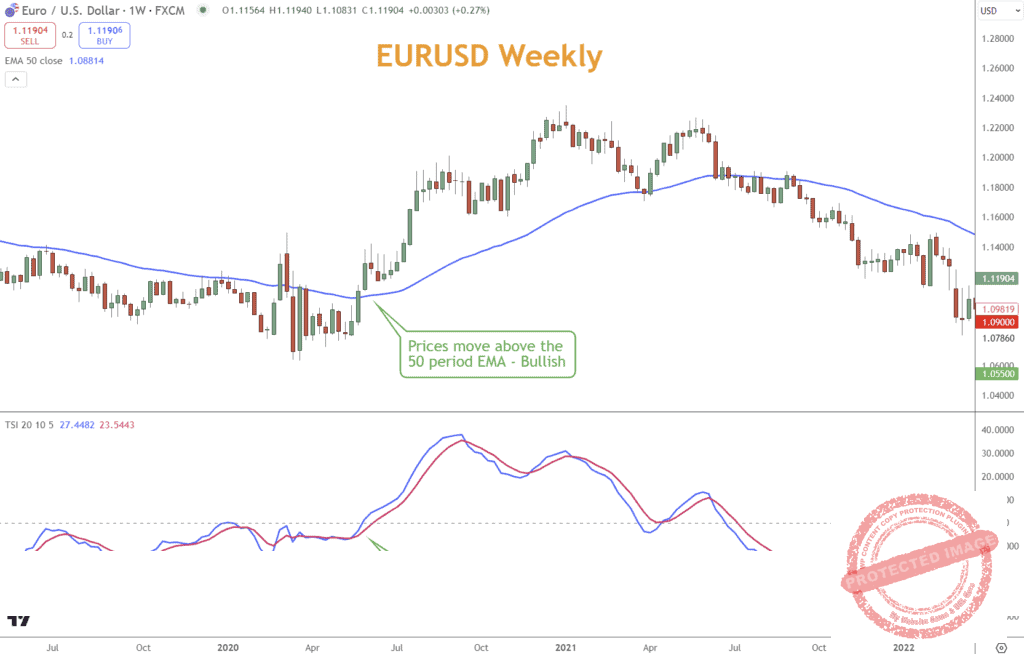
- Integration with Momentum Indicators: The True Strength Index (TSI) is a powerful momentum indicator confirming trends identified by MAs, MACD, or ADX/DMI.
- By gauging the velocity and direction of price movements, TSI can help confirm whether the momentum is strong enough to sustain the trend, providing a double confirmation alongside traditional trend indicators.
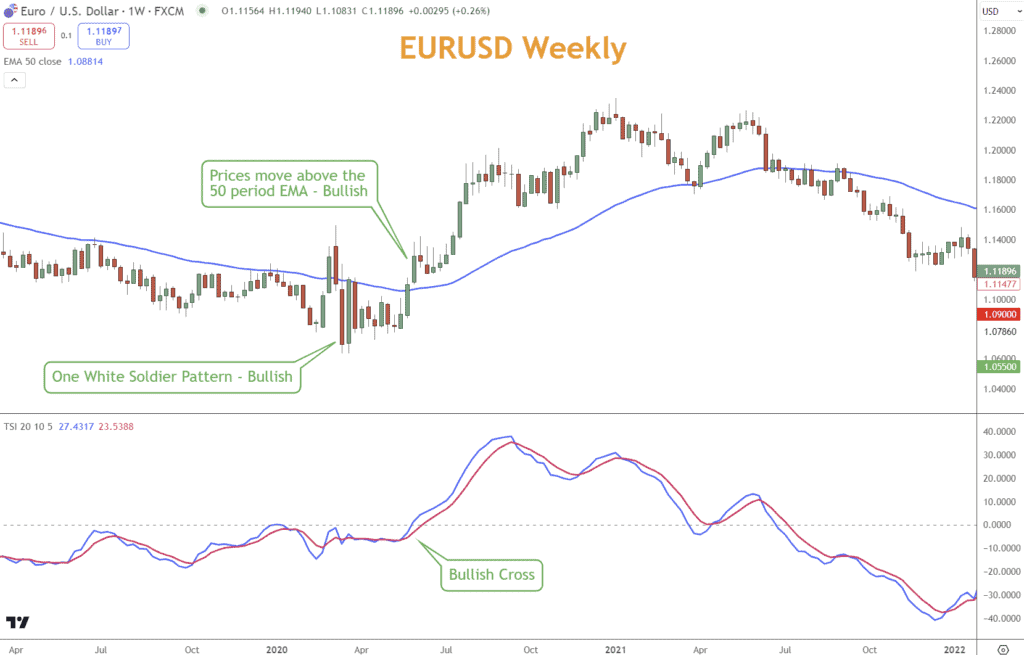
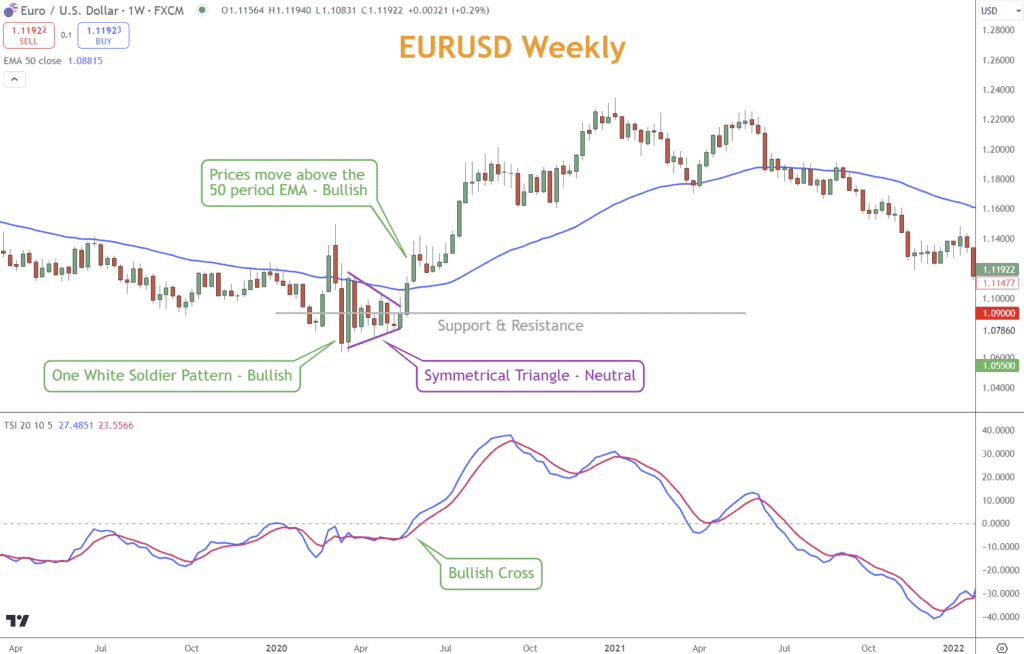
In this example, EURUSD crossing the 50 period EMA earns additional confirmation when the TSI bullish cross confirms, too.
- Utilizing Japanese Candlestick Patterns: Japanese candlestick patterns offer visual insights into market sentiment and potential reversals or continuation of trends.
- For instance, patterns like the ‘Hammer’ or ‘Bullish Engulfing’ can suggest trend reversals or strength when they occur in line with a trend suggested by MA or MACD. These patterns can help you make more informed decisions about entering or exiting trades when used with trend indicators.
The confirmation improves in the EURUSD example when we add the One White Soldier Japanese candlestick confirmation.
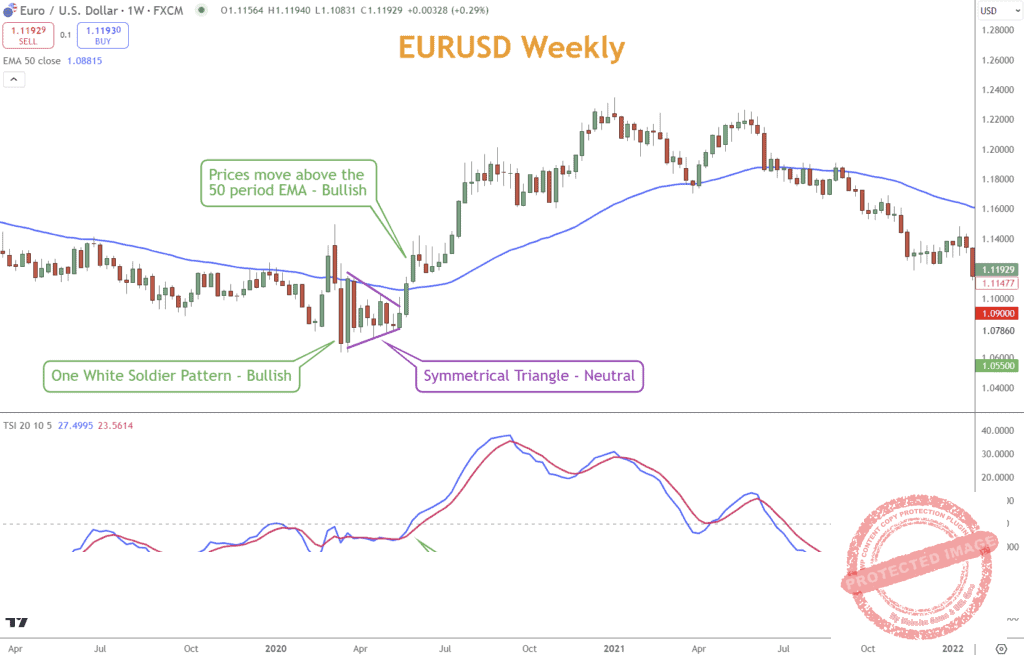
- Incorporating Chart Patterns: Chart patterns such as Triangles, Flags, and Head and Shoulders indicate continuation or reversal and the potential of a move.
- When these patterns are identified in the context of a prevailing trend indicated by MA, MACD, or ADX/DMI, they can provide strategic entry and exit points, enhancing the trader’s ability to capture profitable moves.
Finding additional confirmation sources will improve your confidence in any signal. Before EURUSD moved above the 50-period EMA, a Symmetrical Triangle formed, foreshadowing EURUSD’s preparation to leave consolidation.
- Applying Support and Resistance: Support and resistance levels are pivotal in defining boundaries within which currency pairs tend to operate.
- These levels can define clear points for trading decisions.
- For example, a moving average might indicate an upward trend, but approaching a strong resistance level could signal a potential slowdown or reversal, prompting a strategy adjustment.
The final confirmation option is to add a support and resistance level. For EURUSD, 1.0900 is a long-term support and resistance level that has been visited many times.
In this case, it cuts right through the center of the Symmetrical Triangle, confirming this level’s significance.
You can better understand market dynamics by synthesizing the insights provided by trend indicators with these additional tools.
This comprehensive approach helps identify the most opportune moments to enter and exit trades and significantly mitigates the risks associated with reliance on single indicators.
Thus, you are better equipped to navigate the complexities of the Forex market, enhancing both the profitability and consistency of their trading activities.
Why Trend Following Alone Is Ineffective
While trend following is a robust and popular trading strategy in the Forex market, it has limitations when used in isolation.
These limitations can affect the strategy’s effectiveness, leading to missed opportunities or potential losses. Understanding why one strategy alone may not yield the best results is crucial for traders developing comprehensive trading strategies.
Market Conditions and Volatility
One of the most significant challenges with trend following is its dependency on stable and continuous market trends. In reality, financial markets are complex and influenced by a myriad of factors that can disrupt or obscure trend patterns:
- Volatility Spikes: Economic reports, geopolitical events, and sudden market news can cause significant volatility spikes.
- These spikes can quickly reverse or end trends, leading to potential losses for trend followers who rely solely on historical trend patterns without considering broader market conditions.
- Consolidation Periods: Markets do not always trend. Prices often consolidate, and clear trends fail to materialize.
- These strategies frequently generate false signals in such range-bound markets, leading you into unprofitable trades.
- Market Noise: Trend indicators, especially those based on moving averages, smooth out price data to identify trends. However, they also filter out short-term fluctuations, which can be informative.
- This “noise” can sometimes indicate an impending reversal or slowdown in momentum, which these tools might overlook.

Inadequacy of Single Analytical Approach
Relying solely on one set of indicators without incorporating other analytical tools can lead to an incomplete understanding of market dynamics:
- Lack of Confirmation: Trend indicators are inherently lagging; they react to price movements that have already occurred.
- Without real-time confirmation from other types of analysis, such as momentum indicators, you may enter or exit trades based on outdated information.
- Overlooking Support and Resistance Levels: Trends do not operate in a vacuum. They often encounter key levels of support and resistance that can halt or reverse them.
- Strategies that do not account for these levels may miss critical turning points in the market.
- Ignoring Fundamental Analysis: Economic indicators, central bank decisions, and financial news profoundly impact currency values.
- A strategy that excludes fundamental analysis may fail when expectations or real economic data drive market sentiment and price action.
While trends are important in Forex trading strategy, they are most effective as part of a broader, multifaceted trading approach.
By integrating other analytical tools and methods, you can create a more resilient trading strategy that can adapt to the complexities of the Forex market.
Conclusion
Trend following strategies are a fundamental part of Forex trading. However, they must be used wisely and in conjunction with other tools to overcome their inherent weaknesses.
You can improve your chances of success in the Forex markets by understanding and applying these strategies disciplined. Continual learning and adaptation to evolving market conditions are crucial for maintaining an edge in Forex trading.
What’s the Next Step?
Consider how to use trend following and how to use it with other Forex trading strategies you use today.
In addition, look for opportunities to use what you’ve learned and incorporate it into your trading habits.
If you need help developing an analysis process, you can use our Six Basics of Chart Analysis. If you’re unfamiliar with the Six Basics, you can learn them here for free.
The “Six Basics” will give you a strong foundation in chart analysis, which you can incorporate with what you’ve learned about Forex trading strategies.
In addition, when you get the “Six Basics,” you’ll also get Forex Forecast delivered to your inbox every Sunday.
Forex Forecast includes:
- Trade Ideas and Analysis
- I will use the Six Basics of Chart Analysis and Advanced Strategies to show you the trade opportunities I’m watching.
- Case Studies from Around the Web
- Watch how applying the Six Basics worked on some of the best, most profitable trades.
- Trading Education Guides and Videos
- Want to learn most Six Basics techniques and advanced strategies?
- I produce videos and guides to help you learn and improve trading practices.
- Links to New Articles
- I publish new articles on topics traders will want to know about every week, and you can find out when they post.
- Positionforex.com News
- Did something change at positionforex.com? Learn about it here first!
- Links to upcoming webinars
- Attend free webinars to improve your trading.
- And Much More
- Tools, Membership-only Videos, and more will be released in the Forex Forecast.
The best part – it’s completely free.

Frequently Asked Questions
What Is a Bullish Trend in Forex Trading?
A bullish trend, also known as an uptrend, occurs when the market consistently creates higher highs and higher lows.
This indicates that buyers dominate the market, pushing the prices upward due to strong demand, often driven by positive economic indicators or optimistic market sentiments.
How Does a Bearish Trend Affect My Trading Strategy?
In a bearish trend, where the market shows a pattern of lower highs and lower lows, sellers have taken control, driving prices down. Traders might consider taking short positions during such a trend.
Effective strategies include selling on rallies or when the price breaks below support levels, with stop-loss orders placed above recent swing highs to manage risk.
What Defines a Neutral Trend in Forex Trading?
A neutral trend in Forex trading is characterized by price movements oscillating within a narrow and well-defined range, indicating a balance between supply and demand.
This trend suggests market indecision, with neither buyers nor sellers taking control. It often leads to a consolidation phase before establishing a clearer market direction.
Can These Strategies Be Used in All Market Conditions?
These strategies are most effective in markets with clear directional upward or downward movements. They perform poorly in choppy or sideways markets where no discernible trends exist.
Under these conditions, traders might need to employ different strategies, such as range trading, or adjust their tactics to incorporate other analytical tools, like momentum indicators or volume analysis.
How Do I Combine Indicators with Other Analytical Tools?
Combining indicators with other analytical tools enhances the robustness of your trading strategy.
For example, integrating momentum indicators like the True Strength Index (TSI) can confirm the trend’s strength detected by Moving Averages or MACD.
Additionally, using support and resistance levels alongside Japanese candlestick patterns can confirm trend reversals or continuations, helping refine entry and exit points for better trading outcomes.

