
Trading divergence is a cornerstone concept in technical analysis that helps traders anticipate potential market reversals.
It involves comparing price movement with Momentum indicators such as the Relative Strength Index (RSI), True Strength Index (TSI), and Commodity Channel Index (CCI).
When price and indicator momentum move out of sync, it often signals a shift in market sentiment before it appears on the chart.
In this article, you’ll learn how to identify and trade divergence effectively using RSI, TSI, and CCI—plus how to combine this analysis with other tools for stronger, more confident trades.
Quick Reference Table: Divergence Types and Their Signals
| Type of Divergence | Market Implication | Price Behavior | Indicator Behavior | Typical Action |
| Regular Bullish | Potential trend reversal upward | Lower low | Higher low | Consider long entries |
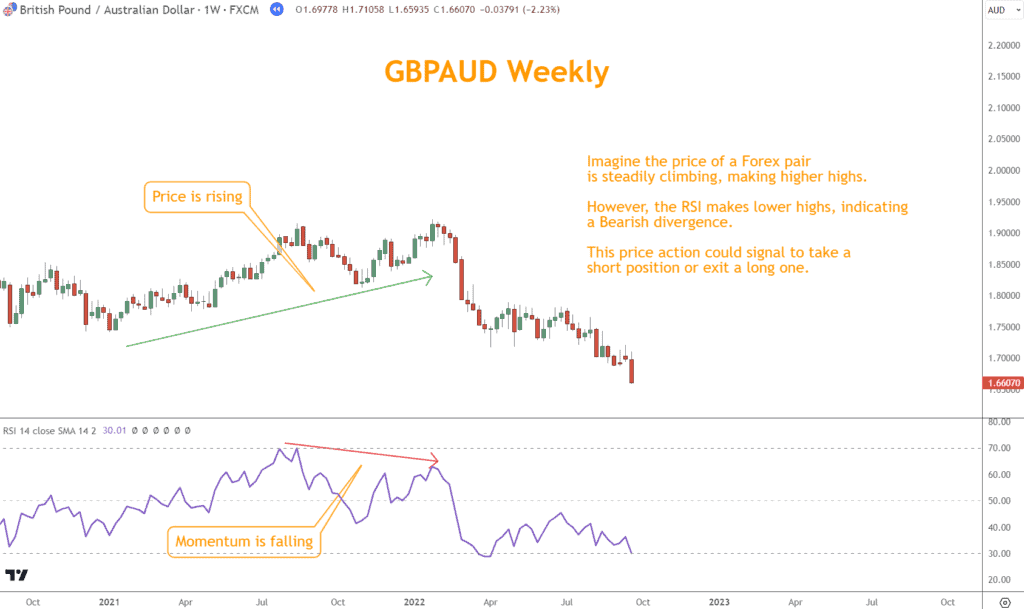
| Regular Bearish | Potential trend reversal downward | Higher high | Lower high | Consider short entries |
| Hidden Bullish | Trend continuation upward | Higher low | Lower low | Add to existing long |
| Hidden Bearish | Trend continues downward | Lower high | Higher high | Add to existing short |
TL;DR – Trading Divergence in Forex
Divergence occurs when price movement and indicator momentum move in opposite directions, often signaling a weakening trend or an upcoming reversal.
This guide covers:
- How to identify regular and hidden divergence.
- Step-by-step strategies for using RSI, TSI, and CCI.
- How to confirm divergence using candlesticks, chart patterns, and support/resistance.
- Why combining indicators enhances trading accuracy.
Divergence trading isn’t foolproof, but when applied with discipline, it can dramatically improve timing and decision-making in Forex trades.
Table of Contents
- Quick Reference Table: Divergence Types and Their Signals
- TL;DR – Trading Divergence in Forex
- What Are Momentum Indicators?
- How to Define Divergence
- How to Trade Divergence with RSI, TSI, and CCI
- Combining Divergence with Other Technical Tools
- Final Thoughts on Trading Divergence
- What’s the Next Step?
- Quiz: Understanding Divergence in Forex
- Forex Trading Disclosure Statement
What Are Momentum Indicators?
Momentum indicators measure the speed and strength of price movements over time.
They help traders identify whether a trend is gaining or losing power, confirming or contradicting price action.
Used correctly, these tools reveal the “energy” behind market moves and provide early warnings of reversals or continuation.
Below is a quick reference comparison of three key Momentum indicators often used to identify divergence signals:
Quick Reference Table: Momentum Indicators for Divergence
| Indicator | What It Measures | Key Levels / Interpretation | Best Use Case | Advantages |
| Relative Strength Index (RSI) | Magnitude of recent price changes | Oscillates between 0–100. Above 70 = overbought; below 30 = oversold | Spotting overbought/oversold conditions and early reversal signals | Simple to use, widely recognized, effective for trend exhaustion |
| True Strength Index (TSI) | Double-smoothed momentum based on price changes | Moves around zero line. Positive = bullish, negative = bearish | Filtering out short-term noise and confirming trend shifts | Smooths out volatility, highlights momentum reversals more clearly |
| Commodity Channel Index (CCI) | Deviation of price from its average over a period | Typically above +100 = overbought; below -100 = oversold | Detecting emerging trends and identifying extremes in market conditions | Versatile across markets, good for both trend and reversal analysis |
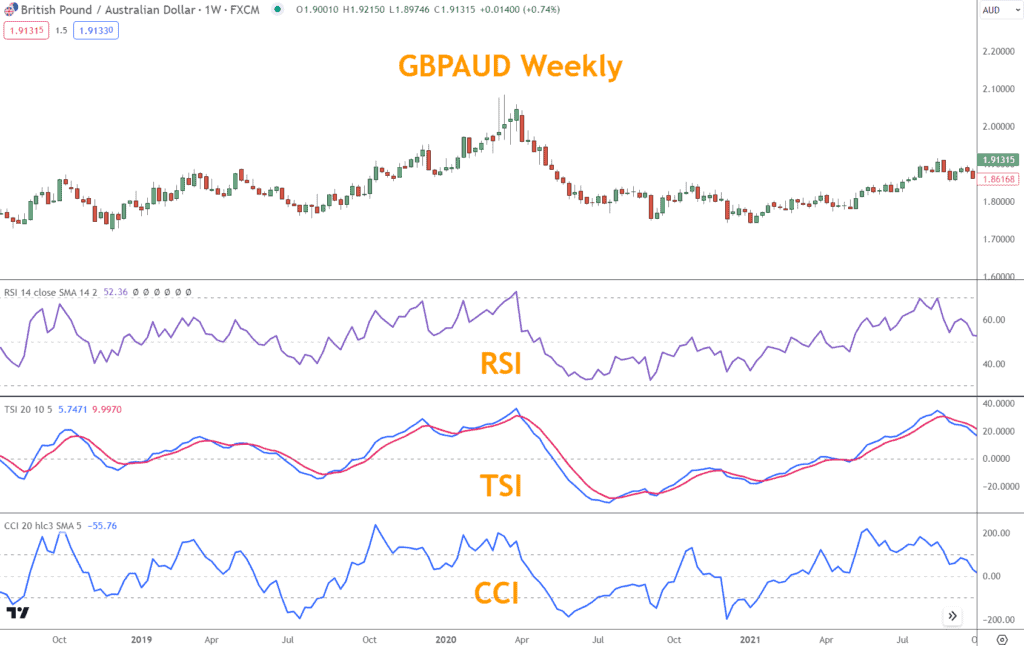
How They Work Together
Each of these indicators measures momentum differently, but they complement one another well:
- RSI excels at timing reversals when the market becomes overstretched.
- TSI refines that signal by filtering short-term noise, offering cleaner momentum insights.
- CCI captures shifts between trend and range conditions, helping traders confirm or reject signals from RSI and TSI.
When used together, they provide a multi-dimensional view of price momentum—ideal for identifying divergence and validating trade setups.
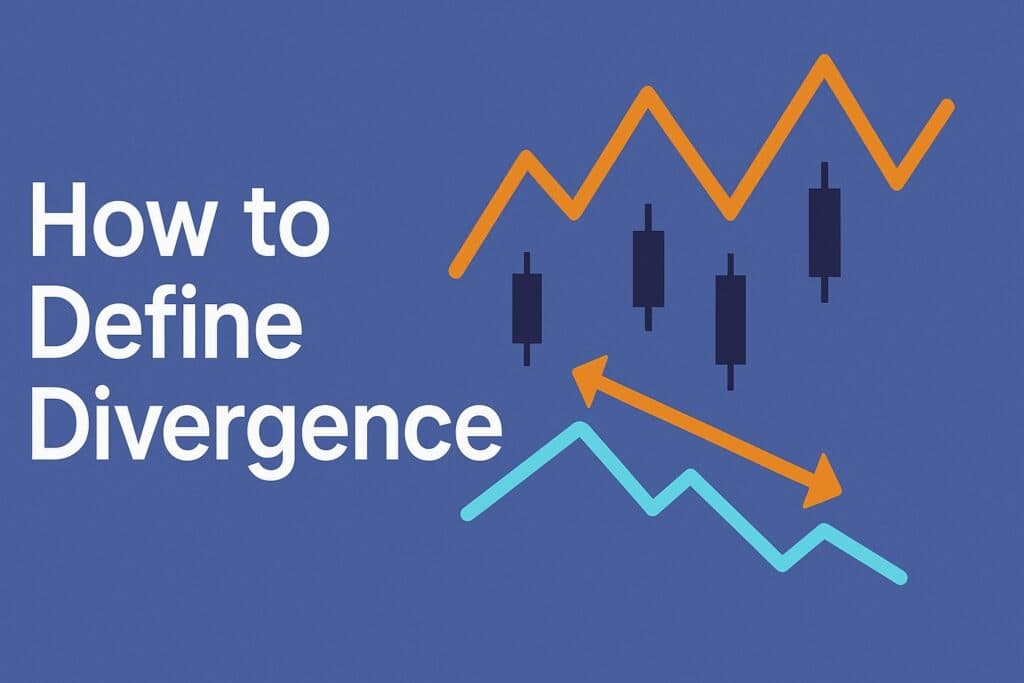
How to Define Divergence
Divergence forms when price action and indicator movement head in opposite directions, revealing an imbalance in momentum.
This divergence suggests that the current price trend is losing strength and may soon reverse or continue depending on its type.
There are two primary types of divergence every trader should know:
Regular Divergence
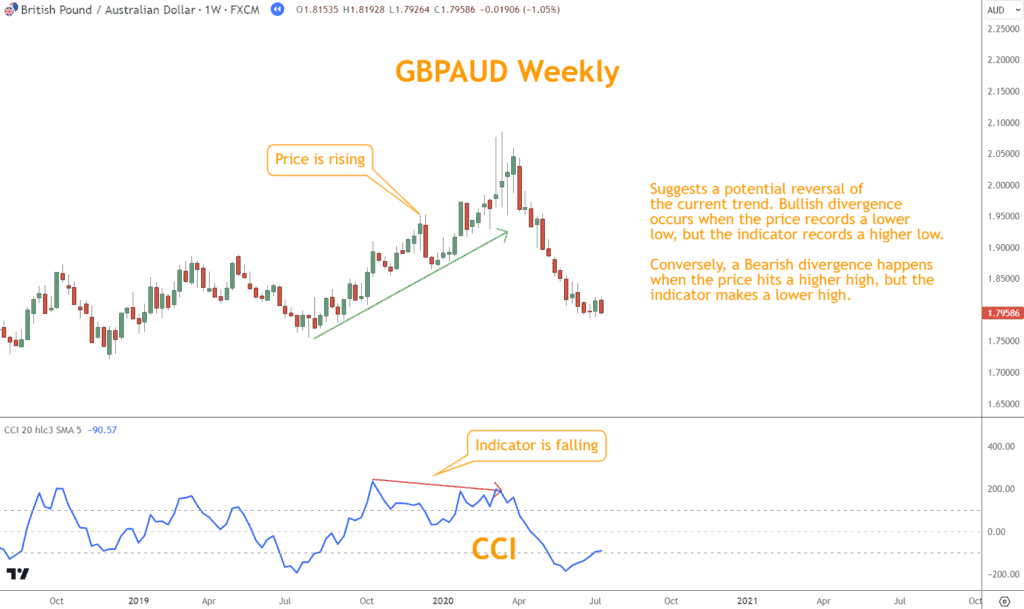
Regular divergence typically signals a potential trend reversal.
- Bullish: Price makes a lower low, but the indicator makes a higher low—suggesting selling pressure is fading.
- Bearish: Price makes a higher high, but the indicator makes a lower high—implying buyers are losing momentum.
Hidden Divergence
Hidden divergence indicates trend continuation rather than reversal.
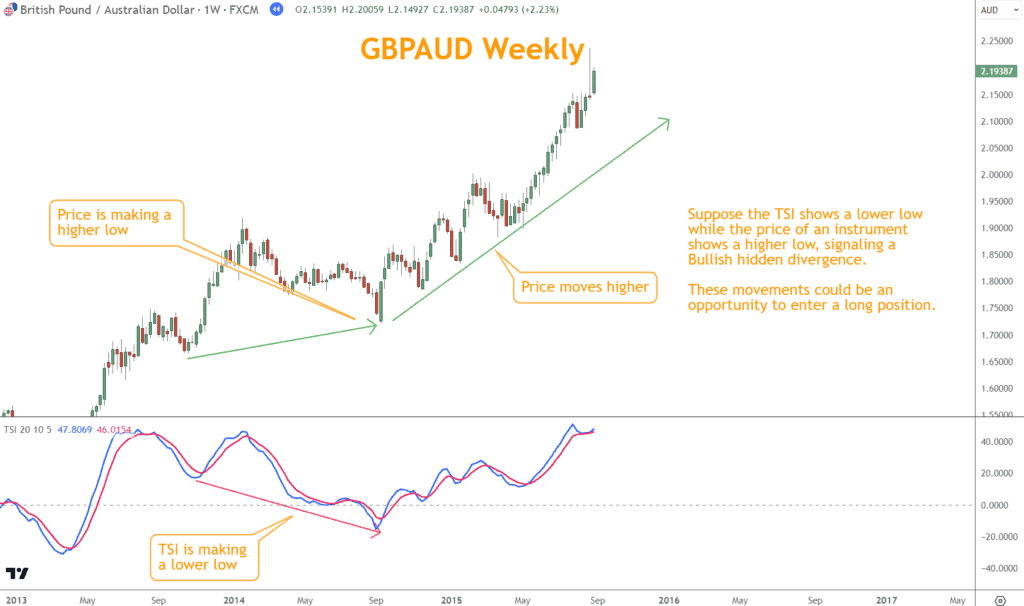
- Bullish Hidden Divergence: In an uptrend, price makes a higher low, while the indicator makes a lower low—showing the trend is intact.
- Bearish Hidden Divergence: In a downtrend, price makes a lower high, but the indicator makes a higher high—suggesting sellers remain in control.
Looking for a Strategy?
Download the Six Basics of Chart Analysis and sign up for Forex Forecast to learn a bottom-up approach to analyzing Forex markets and weekly market updates.
How to Trade Divergence with RSI, TSI, and CCI
Trading divergence involves combining observation, confirmation, and discipline. Follow these steps to execute divergence strategies effectively:
Step 1: Identify the Direction
Determine the market’s dominant trend using moving averages, trendlines, or channel lines.
Context is essential—divergence within a strong trend may not always signal reversal.
Step 2: Spot the Divergence
Compare the indicator’s price highs and lows.
Regular divergence implies a possible reversal.
Hidden divergence implies trend continuation.

Step 3: Confirm the Signal
Wait for additional confirmation before entering a trade.
Look for:
- Candlestick reversal patterns (e.g., Morning Star, Shooting Star)
- Trendline or channel breakouts
- Indicator crossovers or alignment across multiple timeframes
Example Scenarios
RSI Divergence: Price makes higher highs, but RSI shows lower highs—indicating bearish divergence.
TSI Divergence: Price makes higher lows while TSI makes lower lows—showing bullish hidden divergence.
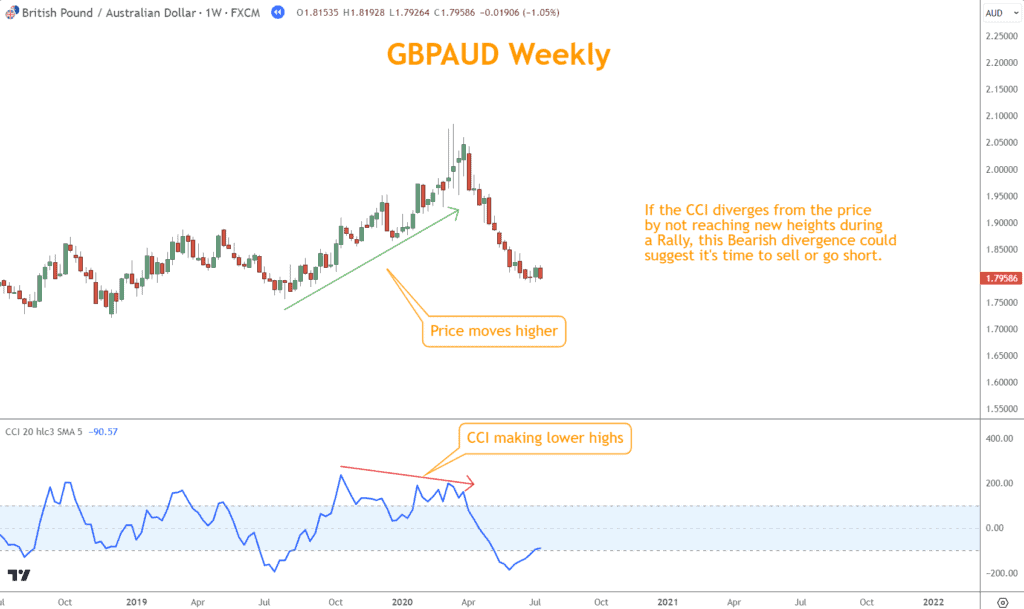
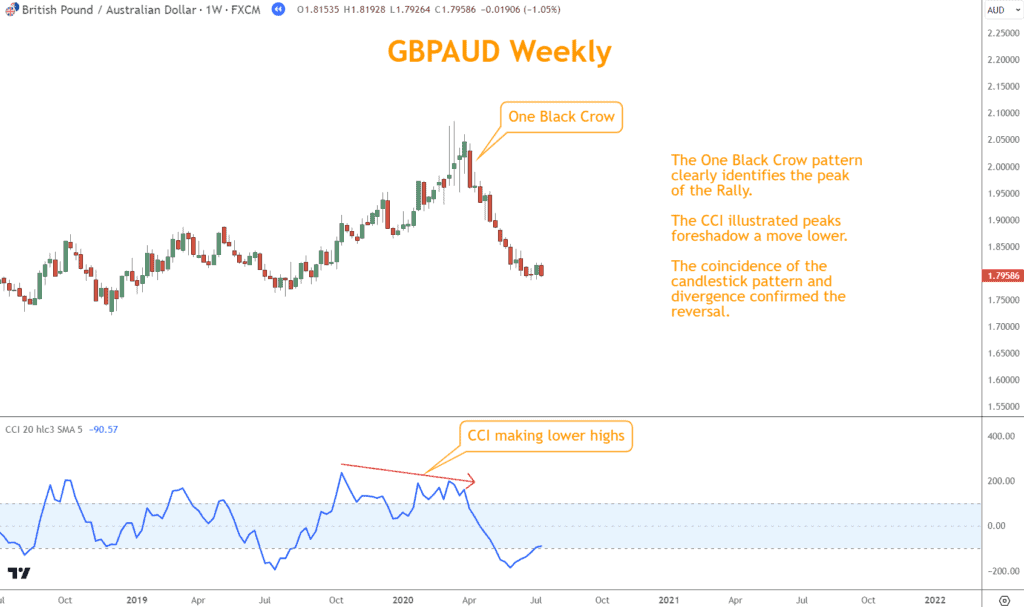
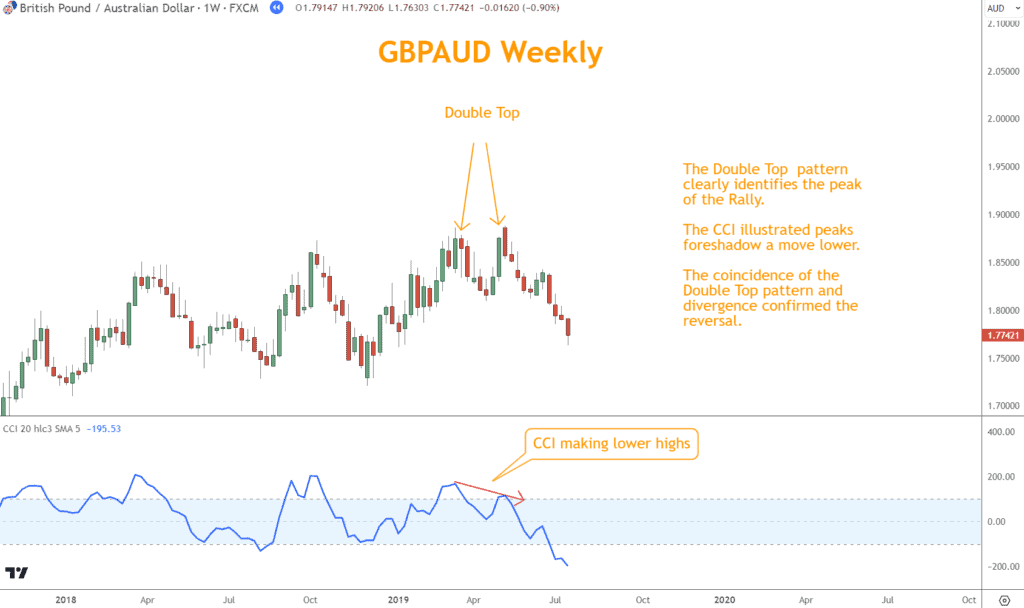
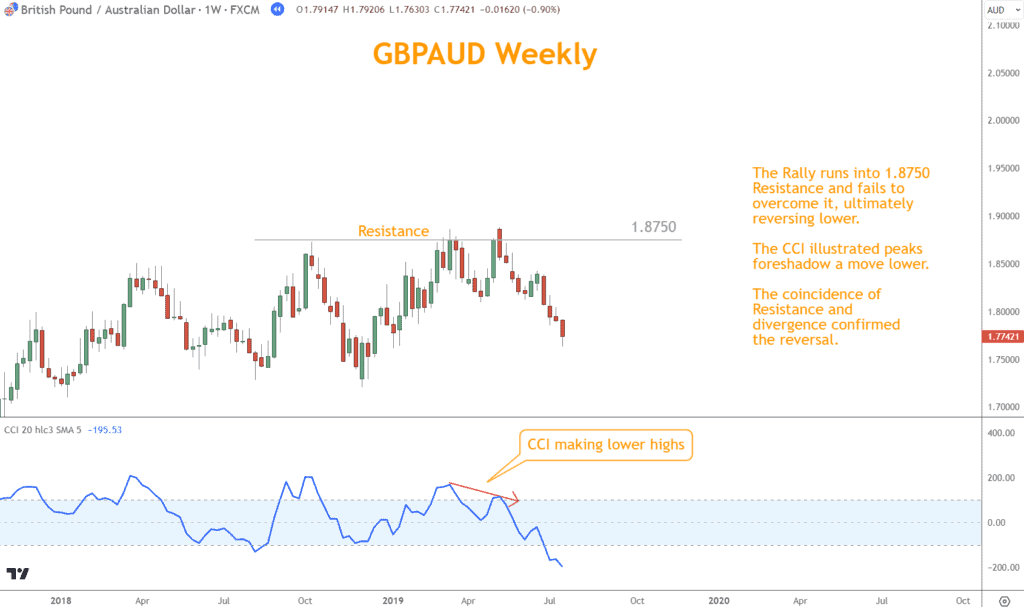
CCI Divergence: CCI fails to reach new highs during a rally—warning of bearish reversal potential.
Combining Divergence with Other Technical Tools
Divergence works best when supported by other forms of analysis.
These tools enhance the reliability of your signals and reduce false entries.
1. Channel Lines and Swing Points
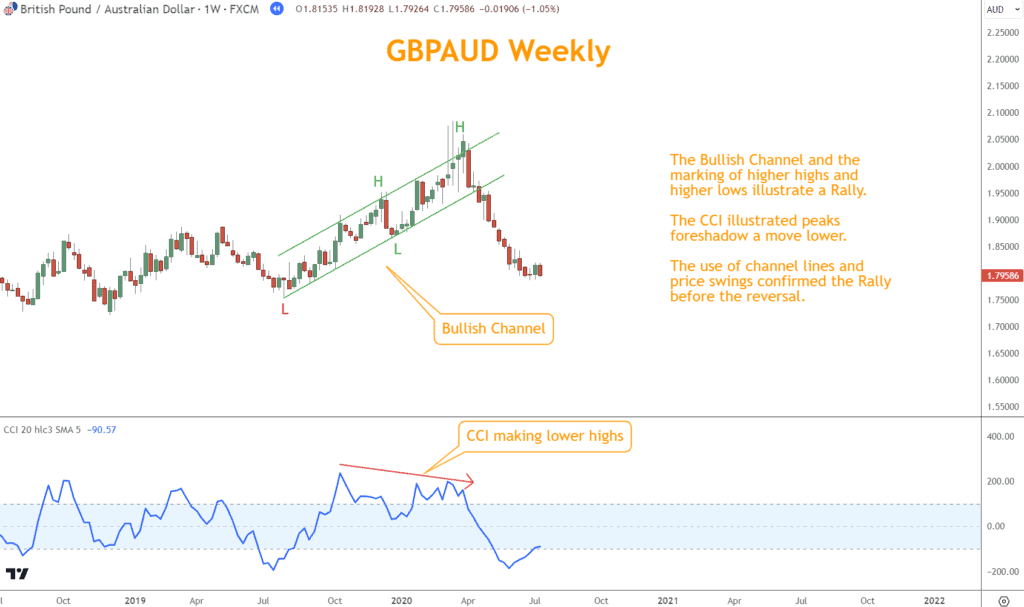
Use channel boundaries or swing highs/lows to define price structure.
When divergence forms near these levels, it strengthens the case for either a reversal or a continuation.
2. Japanese Candlestick Patterns
Candlestick formations such as Engulfing, Morning Star, or Hammer confirm divergence visually. They often provide earlier cues of shifting sentiment.
3. Chart Patterns
Patterns like Triangles, Double Tops/Bottoms, and Head and Shoulders often align with divergence signals, providing additional confluence for entries or exits.
4. Support and Resistance Levels
When divergence aligns with a major support or resistance zone, it adds credibility to the setup and increases the probability of a meaningful move.
5. Combine Multiple Confirmations
Avoid acting on divergence alone. A confluence of signals—momentum, pattern, and structure—creates the strongest setups and minimizes risk.
Final Thoughts on Trading Divergence
Divergence trading can reveal early signs of changing market momentum, helping traders anticipate reversals before they happen.
To use it effectively:
- Master RSI, TSI, and CCI interpretation.
- Always confirm divergence with trend analysis, candlestick formations, or support/resistance zones.
- Apply disciplined risk management—no setup is guaranteed.
- Refine your skills through chart review and backtesting.
With consistent practice, divergence trading can become a cornerstone of your technical analysis toolkit.
What’s the Next Step?
Choose a chart and start applying what you’ve learned about divergence. Test how RSI, TSI, and CCI behave across different timeframes.
If you want a structured framework, download The Six Basics of Chart Analysis—a free guide that will strengthen your market interpretation skills.
When you join Forex Forecast, you’ll also receive:
- Weekly trade ideas and analysis using the Six Basics
- Case studies of profitable trades
- Educational videos and strategy guides
- Alerts for new articles and webinars
- Exclusive PositionForex updates and tools

Get started for free at PositionForex.com.
Quiz: Understanding Divergence in Forex
1. What does divergence indicate in technical analysis?
a. A guaranteed trend reversal
b. A disagreement between price and momentum
c. A sign of trend continuation only
d. A high-volume trading condition
2. Which of the following describes regular bullish divergence?
a. Price makes a higher high, indicator makes a lower high
b. Price makes a lower low, indicator makes a higher low
c. Price and indicator move in the same direction
d. Price makes a higher low, indicator makes a lower low
3. Which Momentum indicator uses double smoothing to filter market noise?
a. RSI
b. TSI
c. CCI
d. MACD
4. What should traders do before acting on a divergence signal?
a. Enter immediately
b. Wait for confirmation from other tools
c. Ignore the signal entirely
d. Rely only on indicator readings
5. What enhances divergence trading accuracy the most?
a. Increasing trade size
b. Combining with support, resistance, and candlesticks
c. Ignoring fundamental factors
d. Trading only on lower timeframes
Answer Key:
- b
- b
- b
- b
- b
Forex Trading Disclosure Statement
Risk Warning:
Forex trading involves significant risk and may not be suitable for all investors. The leveraged nature of Forex trading can work both for and against you, leading to substantial gains or losses. Before trading Forex, you should carefully consider your financial objectives, experience level, and risk tolerance. It is possible to lose more than your initial investment, and you should only trade with money you can afford to lose.
Market Risks and Volatility:
Forex markets are influenced by global economic, political, and social events, which can result in unpredictable price movements. High market volatility can lead to sudden and substantial changes in currency values, potentially causing losses that exceed your initial deposit.
Leverage Risks:
Leverage amplifies both potential gains and potential losses. While leverage can increase profitability, it also increases the risk of significant losses, including the loss of your entire trading capital.
Trading Tools and Technology Risks:
Forex trading platforms, including those offered by brokers, are subject to technology risks, such as system failures, latency issues, and potential errors in price feeds. Traders should be aware that these risks can impact the execution of trades and trading outcomes.
No Guarantee of Profitability:
Past performance in Forex trading is not indicative of future results. There is no guarantee that you will achieve profits or avoid losses when trading Forex. Market conditions and individual trading strategies vary, and no trading system can eliminate the inherent risks of Forex trading.
Educational Purposes Only:
Any information provided about Forex trading, including strategies, analysis, or market commentary, is for educational purposes only and should not be considered financial advice. Consult a qualified financial advisor or tax professional before making any trading decisions.
Regulatory Compliance:
Forex trading is regulated differently in various jurisdictions. Ensure that you are trading with a licensed and compliant broker in your country of residence.
Responsibility:
You are solely responsible for your trading decisions and the associated risks. It is your duty to understand the terms and conditions of Forex trading, including margin requirements, stop-losses, and other risk management tools.
Acknowledgment:
By engaging in Forex trading, you acknowledge that you have read, understood, and accepted this disclosure statement. You accept full responsibility for the outcomes of your trading decisions and agree to trade at your own risk.