
Trading breakouts is a powerful way to capitalize on price momentum and directional moves in the foreign exchange (Forex) market. When executed with discipline and confirmation, breakout trading can deliver high-reward opportunities across timeframes.
In this guide, you’ll learn what a trading breakout is, how to identify it using both technical and fundamental tools, and four essential techniques for entering trades with confidence. Whether you’re a beginner or seasoned trader, this guide will strengthen your approach.
Quick Reference: Breakout Techniques and Tools
| Technique | Primary Tool | Confirmation Tools |
|---|---|---|
| Support & Resistance | Horizontal levels | Candle closes, failed retests, consolidation breaks |
| Channel Breakouts | Channel lines | Retests, momentum indicators, structural confirmation |
| Chart Pattern Breakouts | Triangles, flags, rectangles | Pattern completion, price confirmation |
| Fundamental Breakouts | Economic news, sentiment shifts | Correlation with key levels and technical confirmation |
Table of Contents
- Quick Reference: Breakout Techniques and Tools
- What Are Trading Breakouts?
- How Do I Identify Trading Breakouts?
- Strategies for Trading Breakouts
- Conclusion
- What Are Your Next Steps?
- Looking for a Strategy?
- Frequently Asked Questions
- Forex Trading Disclosure Statement
What Are Trading Breakouts?
A trading breakout occurs when the price of a currency pair decisively breaks through a key level of support or resistance. This shift in market sentiment often marks the beginning of a trend or continuation of an existing one.
Breakouts typically follow periods of consolidation or hesitation and are fueled by increased trading volume, news events, or technical triggers. Traders who recognize and act on breakouts can ride strong directional moves—if they wait for confirmation.
How Do I Identify Trading Breakouts?
Identifying potential breakout zones is one of the most essential skills in Forex trading. Breakouts are most reliable when supported by multiple technical or fundamental factors. Below are four methods you can use to identify them with precision.
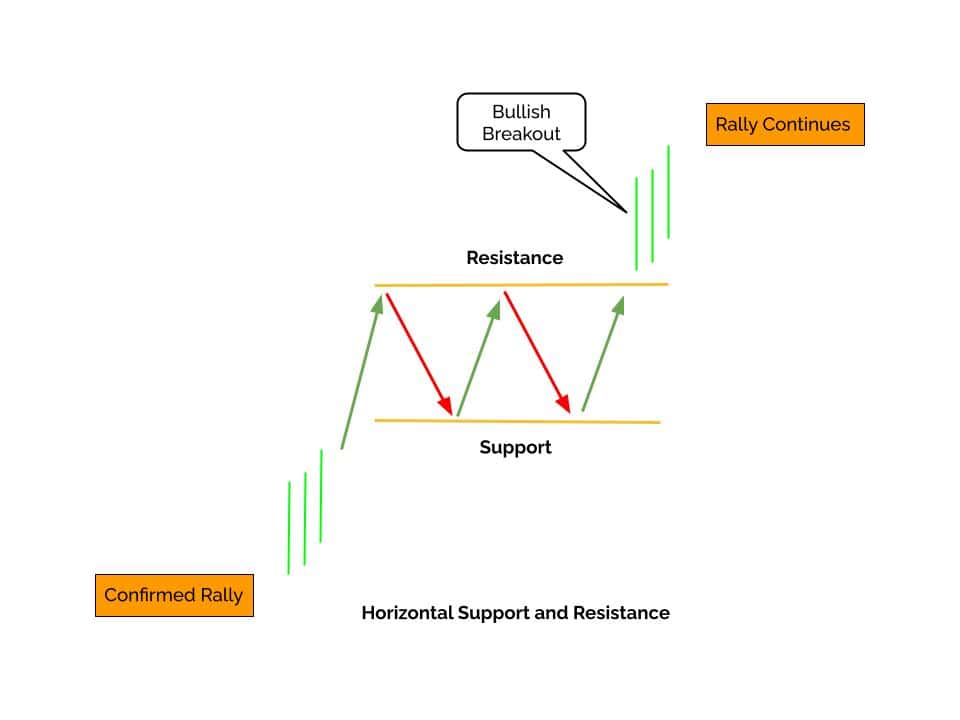
Support and Resistance Levels
Support and resistance zones are horizontal price levels at which buying or selling activity previously reversed the price direction. These levels are magnets for orders and often precede significant price breaks.
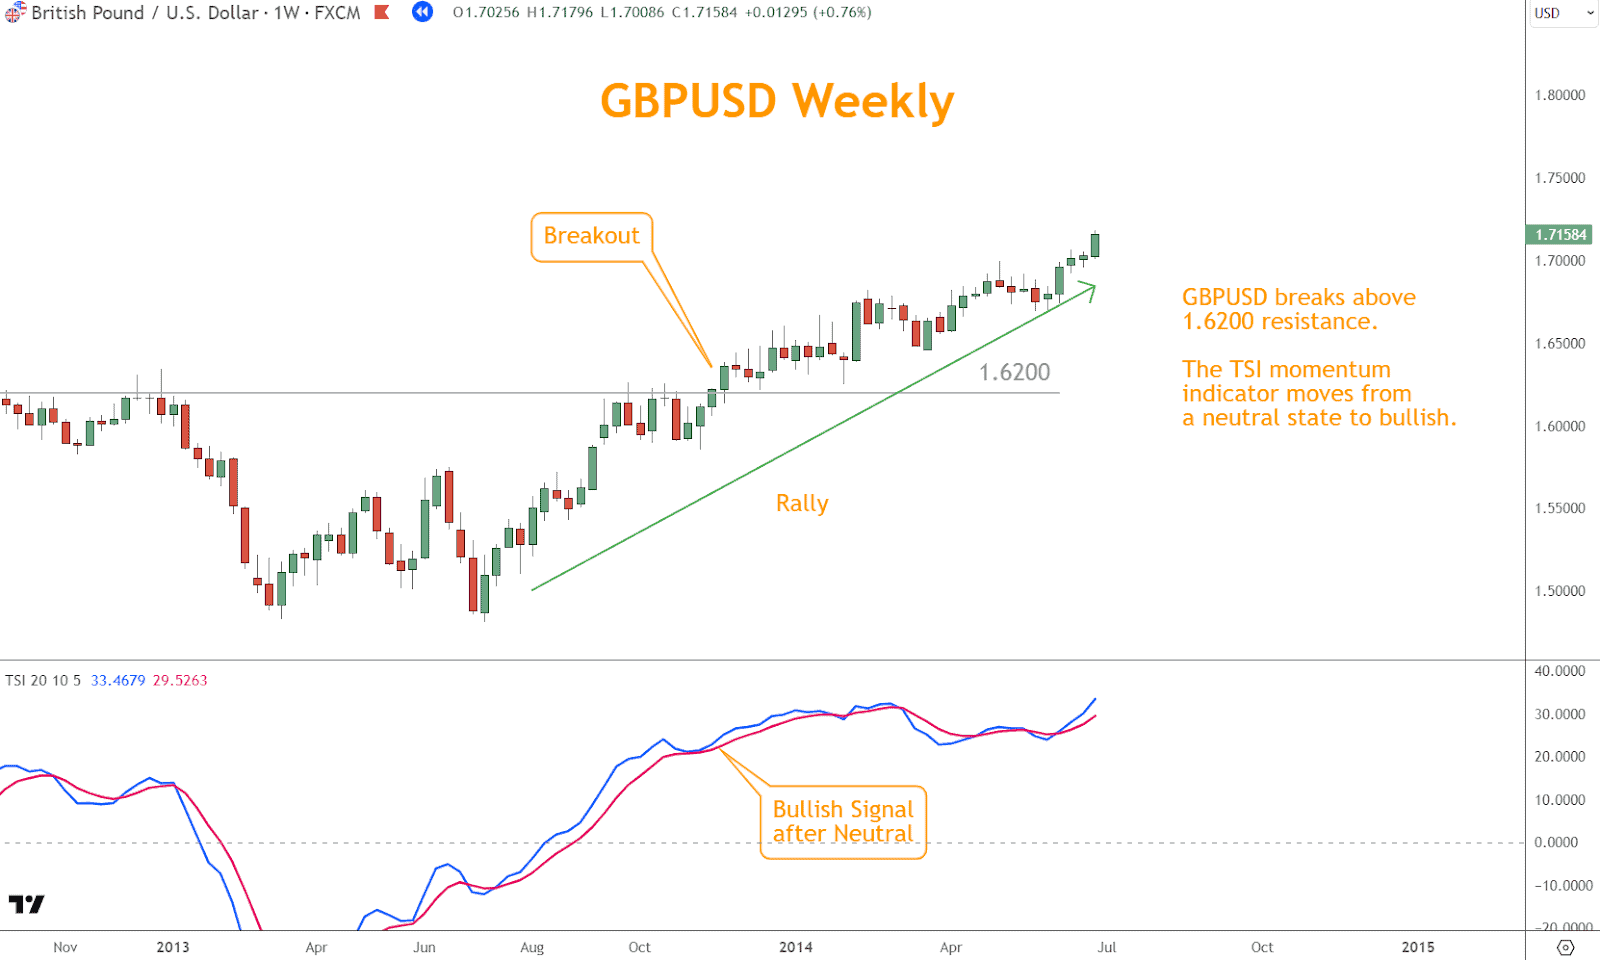
- Example: GBP/USD struggles multiple times at 1.6200 before breaking above with strength.
- Tip: Wait for a candle to close beyond its previous high for validation. If it retests and holds, that’s stronger confirmation.
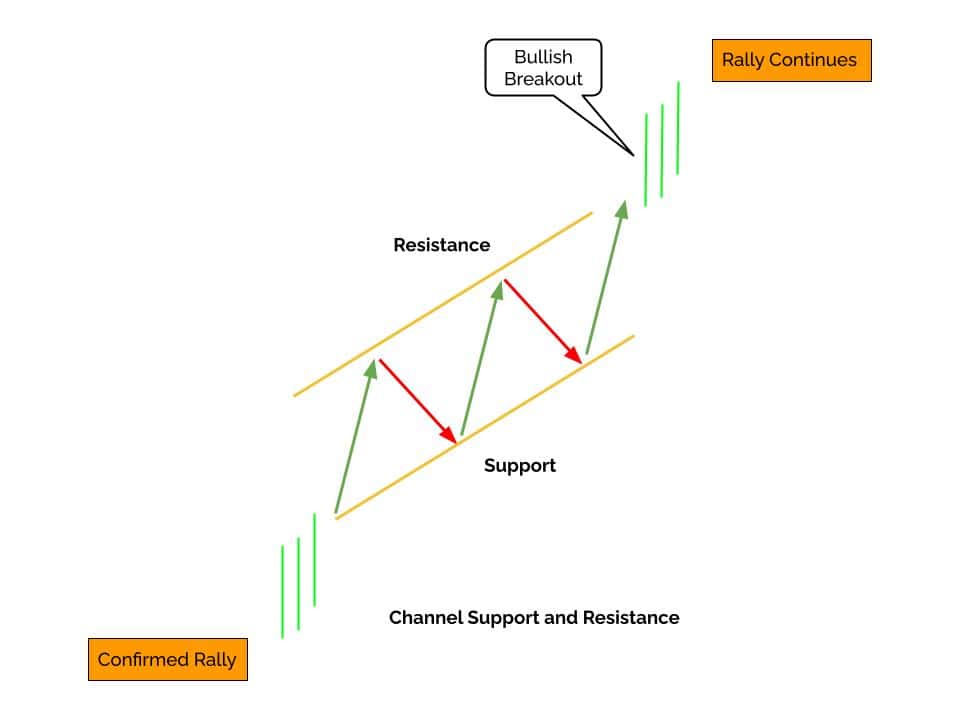
Channel Lines
Channels show price movement between rising or falling parallel trendlines. When price breaks out above or below these lines, it suggests trend acceleration or reversal.
- Example: GBP/USD creates a bullish channel, then breaks above 1.3300 resistance after testing the lower channel line.
- Tip: Confirm with momentum indicators or a retest of the channel line.
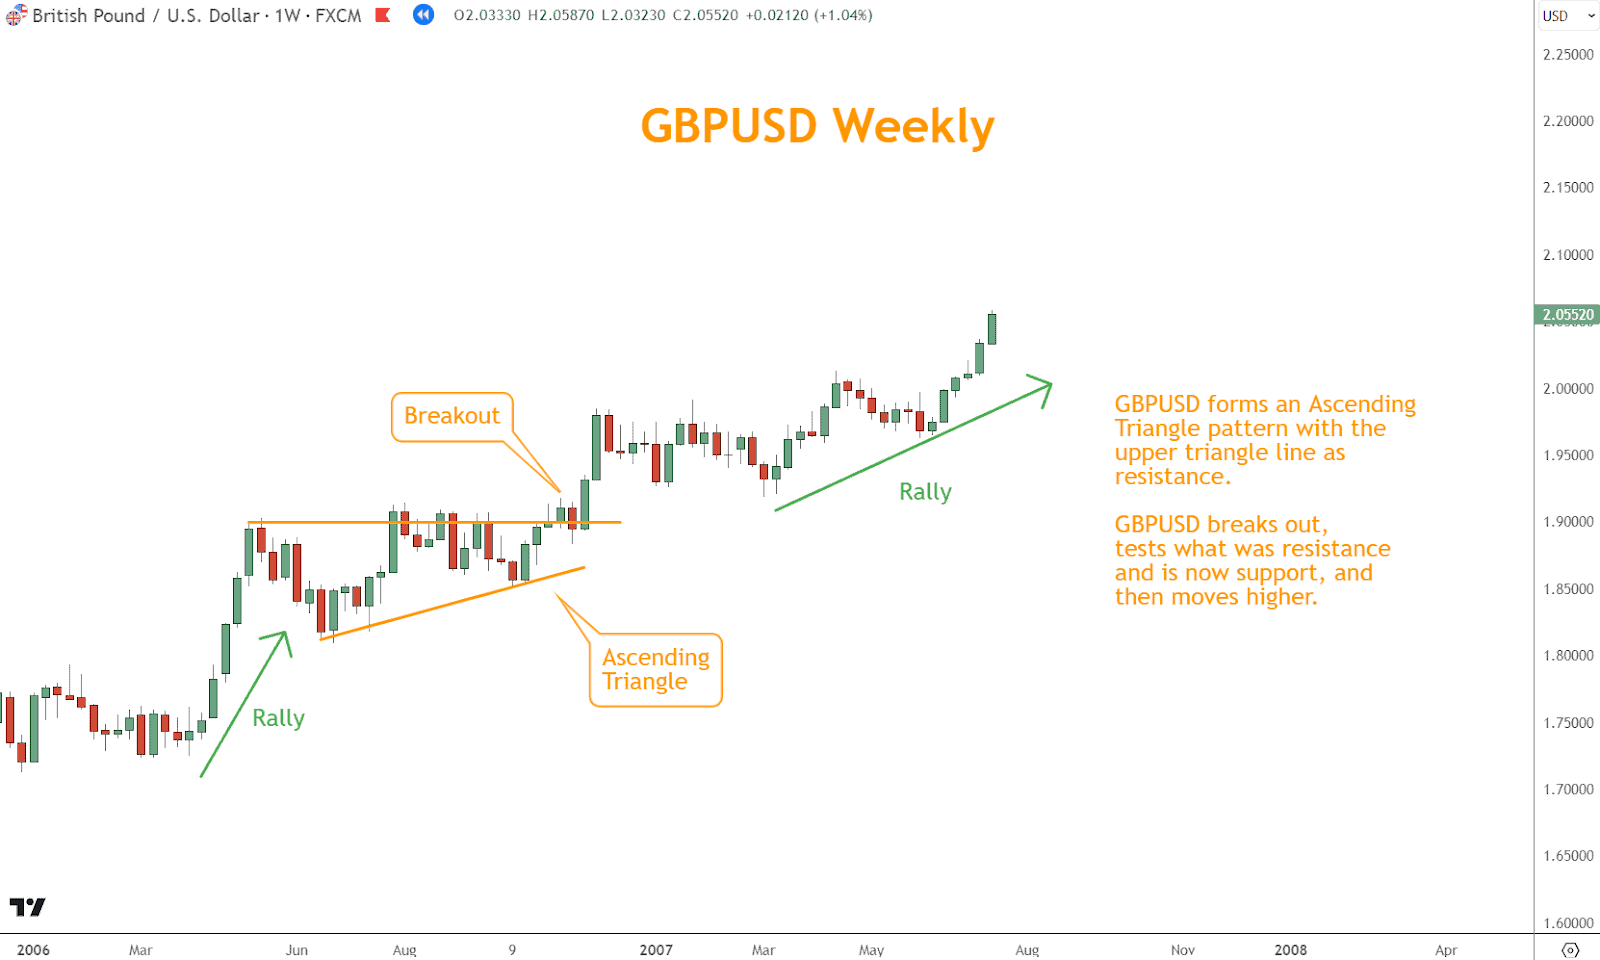
Chart Patterns
Chart patterns, such as triangles, flags, and rectangles, indicate price compression or consolidation before a breakout. These visual formations help you anticipate the direction and strength of the move.
- Example: The GBP/USD forms an ascending triangle, then breaks above the resistance level, signaling a bullish breakout.
- Tip: The breakout candle should be decisive, and retests of the broken level increase the reliability.
Fundamental Analysis
Economic events—such as central bank decisions, employment data, or geopolitical developments—can trigger breakouts by shifting sentiment or driving volatility.
- Tip: Track upcoming economic events and overlay them with technical setups. Breakouts driven by fundamentals tend to be stronger and longer-lasting.
Looking for a Strategy?
Download the Six Basics of Chart Analysis and sign up for Forex Forecast to learn a bottom-up approach to analyzing Forex markets and weekly market updates.
Strategies for Trading Breakouts
Breakout strategies require patience, structure, and confirmation. Entering too early can lead to false breakouts; waiting too long may mean missing the move. Here are two core strategies to improve timing and execution.
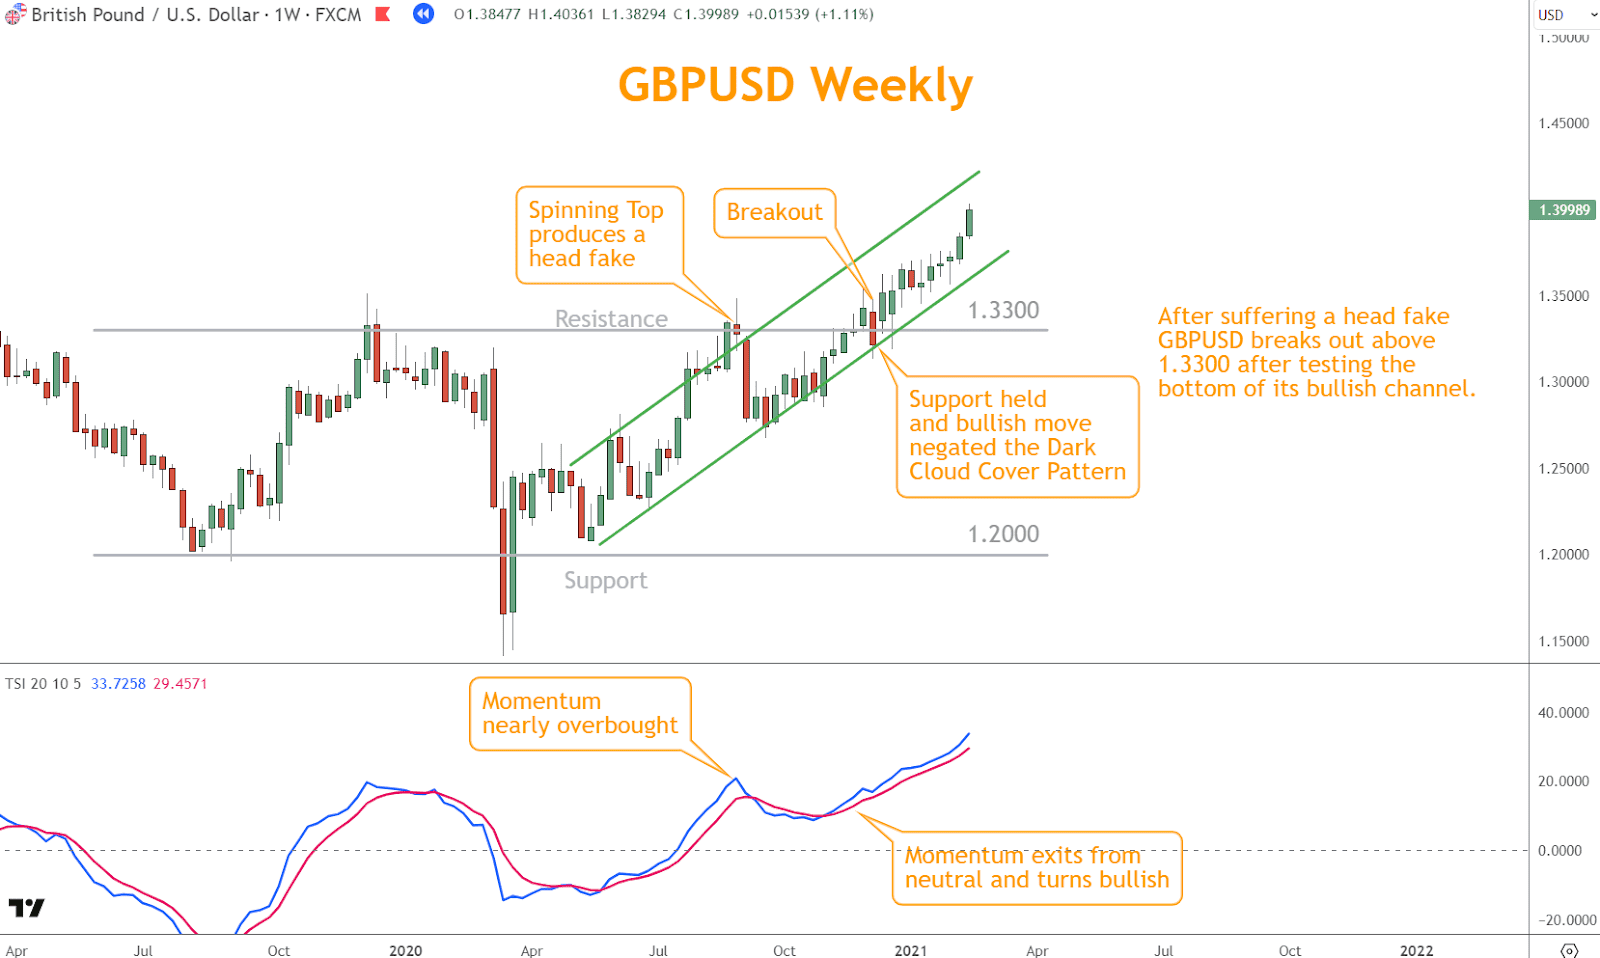
Breakout Confirmation
Confirmation is the process of validating a breakout before committing capital. This prevents entering on false moves and increases trade success.
Confirmation Signs:
- Strong candle close beyond key level
- Indicator alignment (e.g., TSI moving from neutral to bullish)
- Failed candlestick reversal (e.g., a failed Dark Cloud Cover pattern)
- Example: GBP/USD breaks resistance with TSI turning bullish and a failed bearish reversal, confirming the breakout.
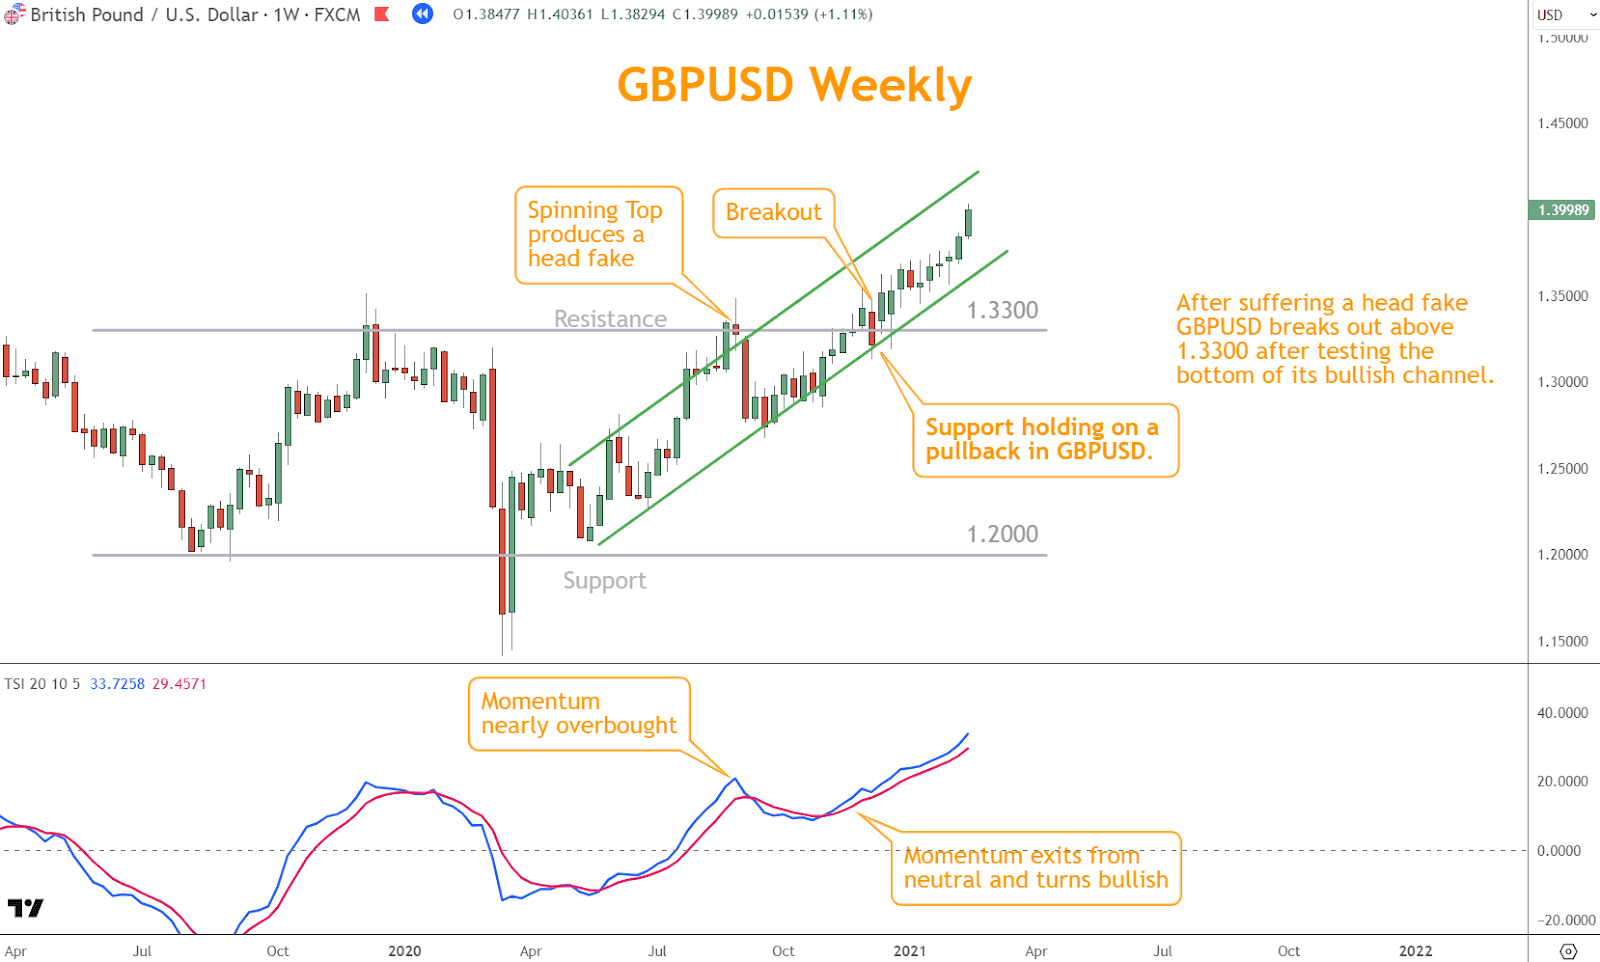
Pullback Entries
After a breakout, price often retests the breakout level. This pullback is a lower-risk entry that offers a favorable risk-to-reward ratio.
- Example: GBP/USD breaks above 1.3300, pulls back to the breakout zone, then rallies higher.
- Tip: Wait for the pullback to hold, then look for bullish candlesticks or volume confirmation before entering.
Conclusion
Trading breakouts can be a rewarding strategy when applied with discipline, confirmation, and patience.
By utilizing tools such as support/resistance, channels, chart patterns, and fundamental context, you can identify high-probability setups.
Whether you’re trading short-term breakouts or position trading weekly chart patterns, these principles give you an edge. Combine technical and fundamental evidence to reduce false signals and trade with confidence.
What Are Your Next Steps?
- Open a Forex chart and begin identifying breakout opportunities.
- Apply the four identification methods: support/resistance, channels, patterns, and fundamentals.
- Practice confirmation techniques using candlesticks and momentum indicators.
- Refine your strategy using the Six Basics of Chart Analysis—get your free guide below.
Looking for a Strategy?
Download the Six Basics of Chart Analysis and sign up for Forex Forecast to receive:
- Weekly Trade Ideas based on the Six Basics and advanced strategies
- Real Case Studies from recent high-probability setups
- Video Guides and Strategy Walkthroughs
- New Article Alerts on essential trading topics
- PositionForex.com News and Webinars**
- Premium Tools and Subscriber-Only Content
The best part—it’s completely free.

Frequently Asked Questions
What Are Trading Breakouts in Forex Trading?
Breakouts occur when price moves beyond a key level of support or resistance, often signaling a shift in sentiment and the start of a new trend. Breakouts offer opportunities for momentum-based trading.
How Can Traders Identify Breakout Opportunities?
You can spot breakouts using:
- Support/resistance zones
- Channel trendlines
- Chart patterns (triangles, flags, etc.)
- Momentum indicators
- Fundamental news events
What Are Some Common Strategies for Trading Breakouts?
The most effective breakout strategies include:
- Waiting for confirmation with price action and indicators
- Entering on pullbacks to breakout levels
- Using risk management and multi-timeframe analysis
What Are Some Common Pitfalls to Avoid When Trading Breakouts?
Avoid these mistakes:
- Entering before confirmation
- Ignoring market trend or news
- Failing to manage risk properly
- Chasing late breakouts
Forex Trading Disclosure Statement
Risk Warning:
Forex trading involves significant risk and may not be suitable for all investors. The leveraged nature of Forex trading can work both for and against you, leading to substantial gains or losses. Before trading Forex, you should carefully consider your financial objectives, experience level, and risk tolerance. It is possible to lose more than your initial investment, and you should only trade with money you can afford to lose.
Market Risks and Volatility:
Forex markets are influenced by global economic, political, and social events, which can result in unpredictable price movements. High market volatility can lead to sudden and substantial changes in currency values, potentially causing losses that exceed your initial deposit.
Leverage Risks:
Leverage amplifies both potential gains and potential losses. While leverage can increase profitability, it also increases the risk of significant losses, including the loss of your entire trading capital.
Trading Tools and Technology Risks:
Forex trading platforms, including those offered by brokers, are subject to technology risks, such as system failures, latency issues, and potential errors in price feeds. Traders should be aware that these risks can impact the execution of trades and trading outcomes.
No Guarantee of Profitability:
Past performance in Forex trading is not indicative of future results. There is no guarantee that you will achieve profits or avoid losses when trading Forex. Market conditions and individual trading strategies vary, and no trading system can eliminate the inherent risks of Forex trading.
Educational Purposes Only:
Any information provided about Forex trading, including strategies, analysis, or market commentary, is for educational purposes only and should not be considered financial advice. Consult a qualified financial advisor or tax professional before making any trading decisions.
Regulatory Compliance:
Forex trading is regulated differently in various jurisdictions. Ensure that you are trading with a licensed and compliant broker in your country of residence.
Responsibility:
You are solely responsible for your trading decisions and the associated risks. It is your duty to understand the terms and conditions of Forex trading, including margin requirements, stop-losses, and other risk management tools.
Acknowledgment:
By engaging in Forex trading, you acknowledge that you have read, understood, and accepted this disclosure statement. You accept full responsibility for the outcomes of your trading decisions and agree to trade at your own risk.
This disclosure is intended to provide an overview of the risks associated with Forex trading and is not exhaustive. For additional information, consult your broker and other reliable financial resources.