
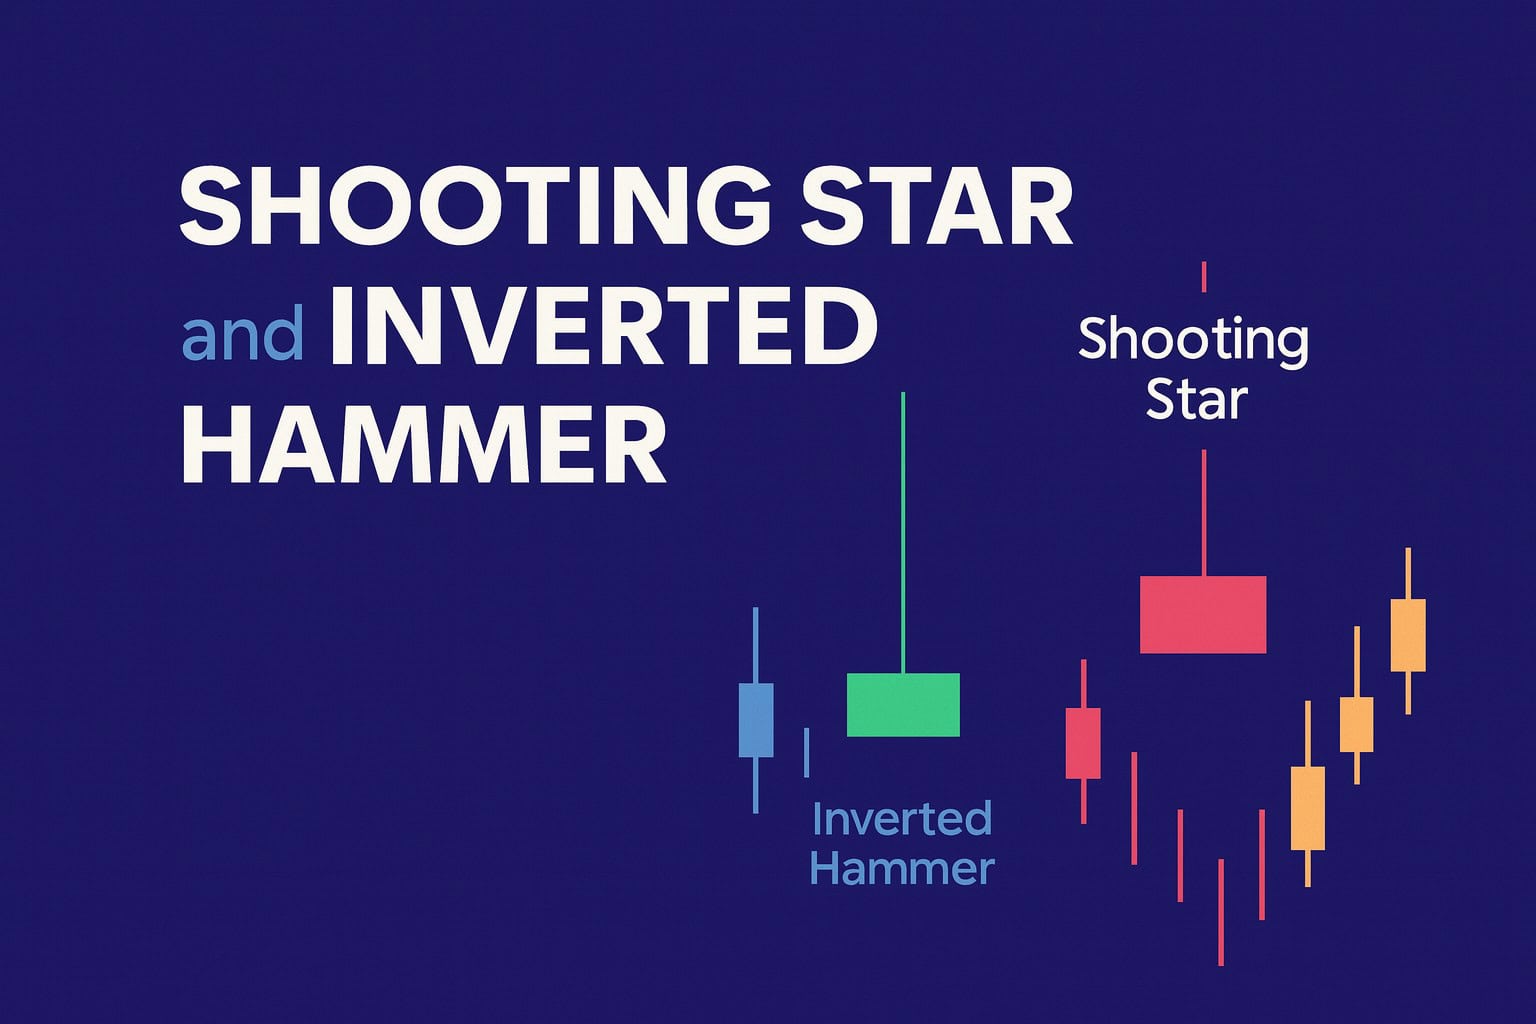
The Shooting Star and Inverted Hammer are two powerful one-candle Japanese candlestick patterns that can warn you of potential market reversals.
Although simple in appearance, they carry significant meaning and can help forecast shifts in market sentiment when analyzed correctly.
In this guide, you’ll learn what each pattern represents, how to identify them, and three practical tips to trade them with greater accuracy.
TL;DR – Shooting Star and Inverted Hammer Essentials
- Shooting Star: Appears after a Rally. Small body + long upper wick. Signals potential selloff.
- Inverted Hammer: Appears after a Selloff. Small body + long upper wick. Signals a potential rally.
- These are early warning signs—not trade triggers in and of themselves.
- Always require confirmation, ideally from momentum indicators, chart patterns, or support & resistance.
- Context matters: trends, news, economic factors, and prior price action determine whether the signal is valid.
Table of Contents
- TL;DR – Shooting Star and Inverted Hammer Essentials
- What Are the Shooting Star and Inverted Hammer Patterns?
- Understanding the Basics of These Patterns
- Identifying the Shooting Star in Forex Trading
- How to Trade the Shooting Star Pattern
- Identifying the Inverted Hammer Pattern
- How to Trade the Inverted Hammer Pattern
- Three Tips for Trading These Reversal Patterns
- Quiz: Shooting Star & Inverted Hammer Mastery
- 1. Where does a Shooting Star typically appear in a market trend?
- 2. What is the key characteristic shared by both the Shooting Star and Inverted Hammer?
- 3. What is the most important step before trading either candlestick pattern?
- 4. What does an Inverted Hammer indicate after a Selloff?
- 5. Which tool does not help confirm these patterns?
- Answer Key
What Are the Shooting Star and Inverted Hammer Patterns?
Both the Shooting Star and Inverted Hammer are single-candle reversal patterns that highlight weakening market pressure.
While they look similar, their meaning depends entirely on where they appear on the chart.
Key characteristics
- Small real body
- Long upper shadow
- Very little or no lower shadow
- Visual indication of fading control from one side of the market
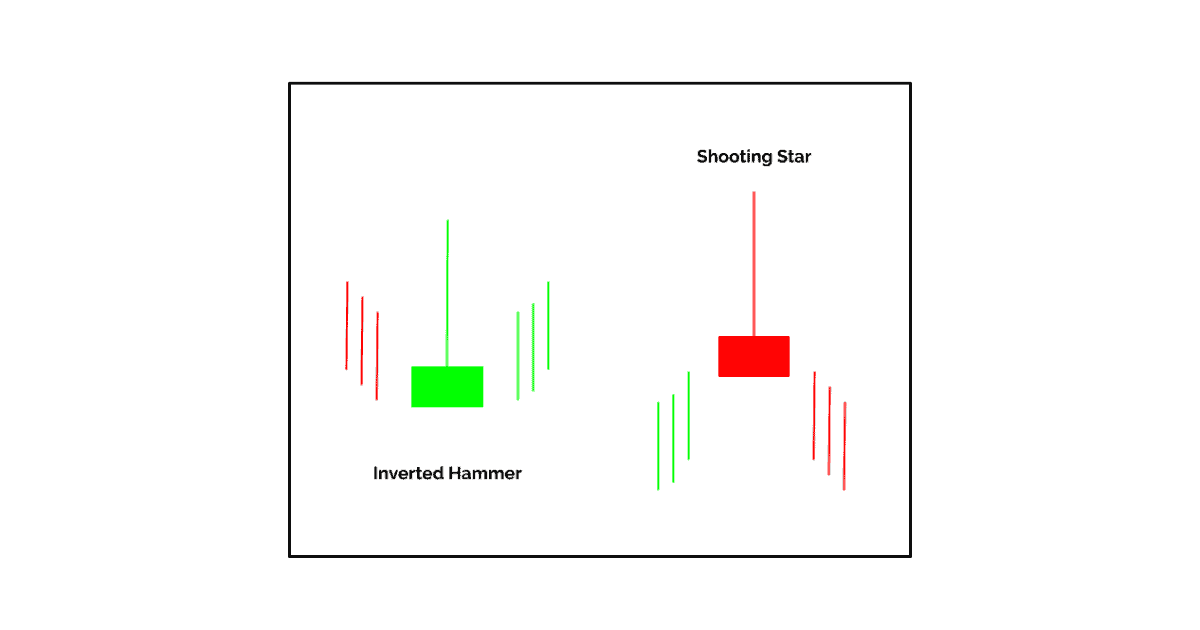
Directional Context
- Shooting Star: Forms after a Rally → potential Selloff
- Inverted Hammer: Forms after a Selloff → potential Rally
Understanding the Basics of These Patterns
Both patterns reflect a sudden shift in market control.
Buyers temporarily push prices upward, but sellers (or buyers, depending on context) quickly reverse that move, leaving a long wick behind.
Shared meaning
- Upward price rejection
- Momentum weakening from the dominant side
- Early signs of a possible shift in direction
Key difference
Context determines whether it is Bullish or Bearish.
Identifying the Shooting Star in Forex Trading
A Shooting Star shows that buyers attempted to push the market higher before losing strength.
How to identify it
- Forms after a Rally
- Small body near the candle’s low
- Long upper shadow
- Signals weakening Bullish strength
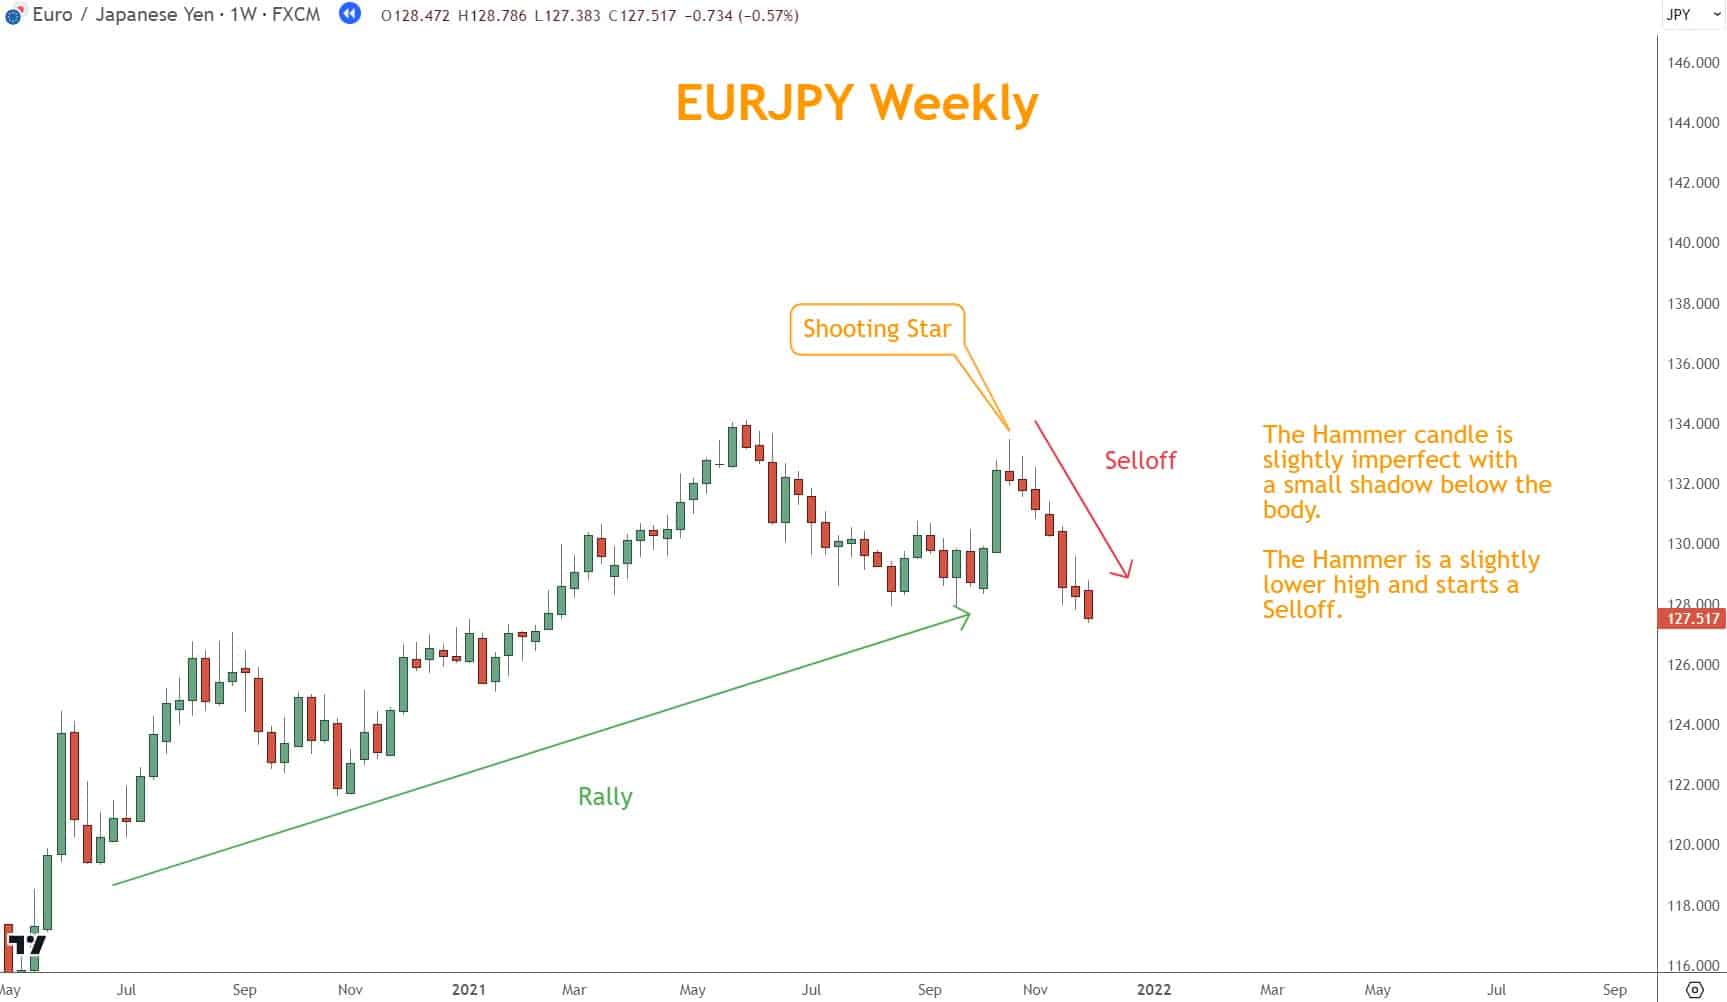
In the EUR/JPY example below, the small body of the candlestick represents the opening and closing prices.
At the same time, the long upper shadow shows how bearish traders pushed the price down significantly before the session closed. This signifies their increasing strength.
How to Trade the Shooting Star Pattern
Before acting, traders should always wait for confirmation.
Confirmation tools
- A lower close on the next candle
- A break of a minor Swing Low
- Bearish Momentum confirmation
- Rejection at Resistance
Identifying the Inverted Hammer Pattern
The Inverted Hammer forms after a selloff and warns that sellers may be losing control.
How to identify it
- Appears at the bottom of a downtrend
- Small real body
- Long upper wick
- Indicates buyers are stepping in
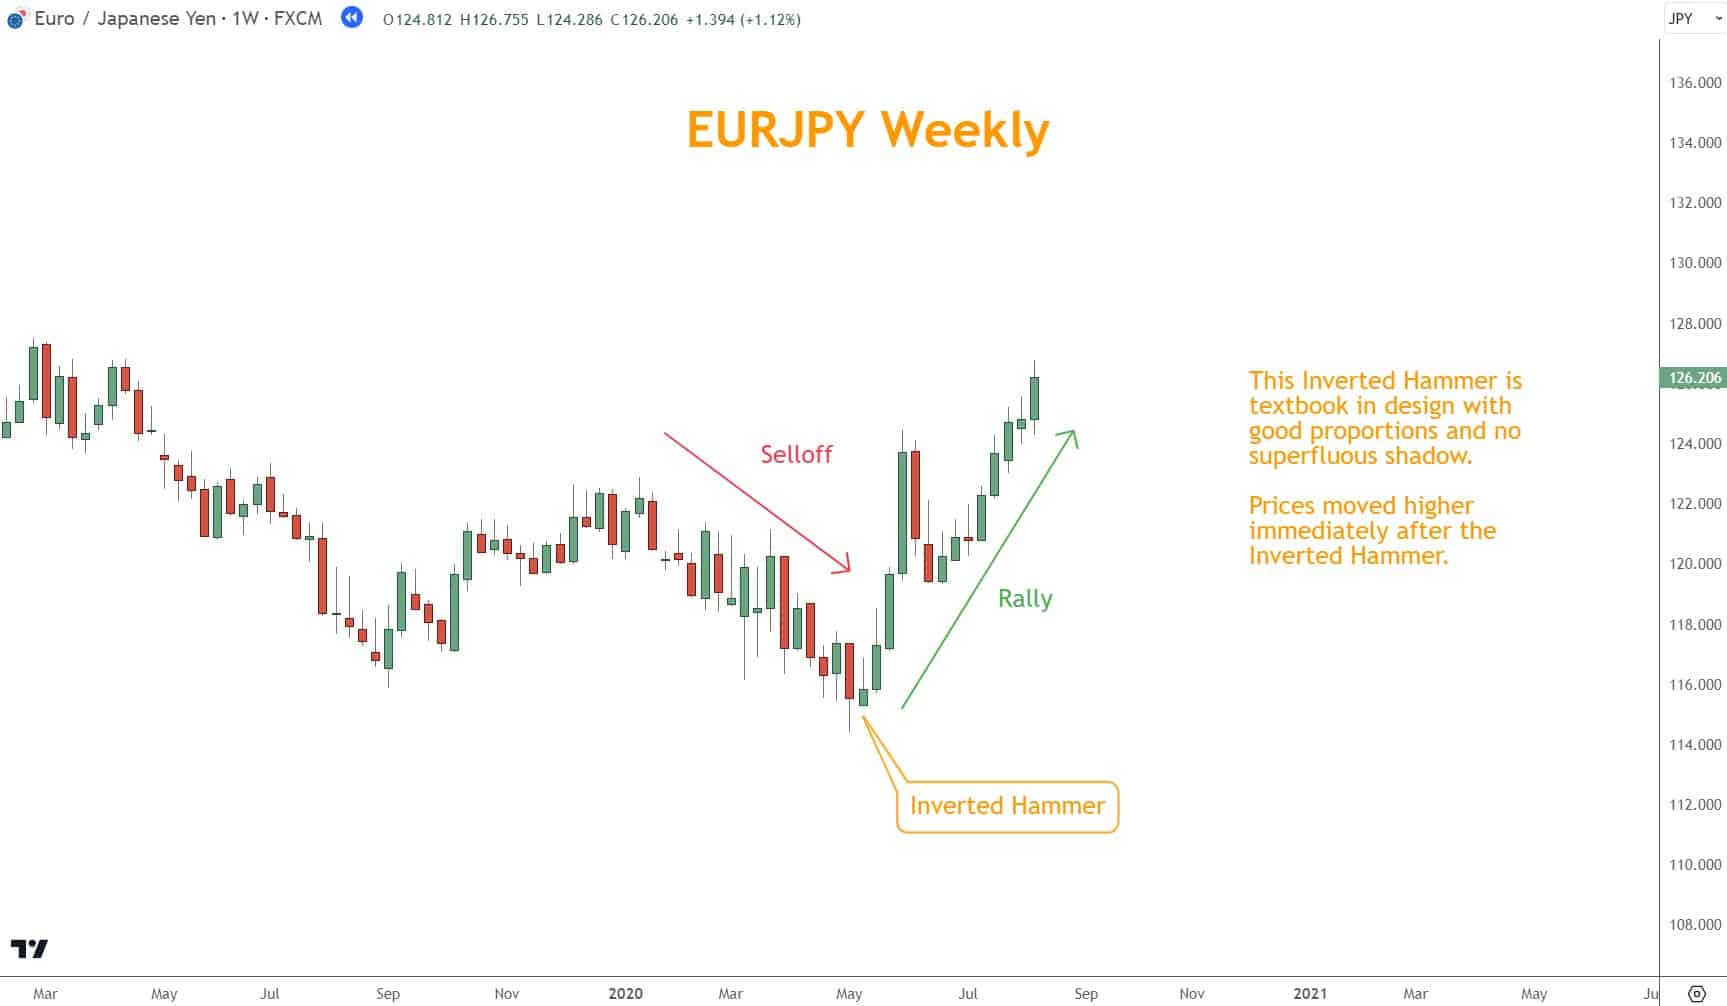
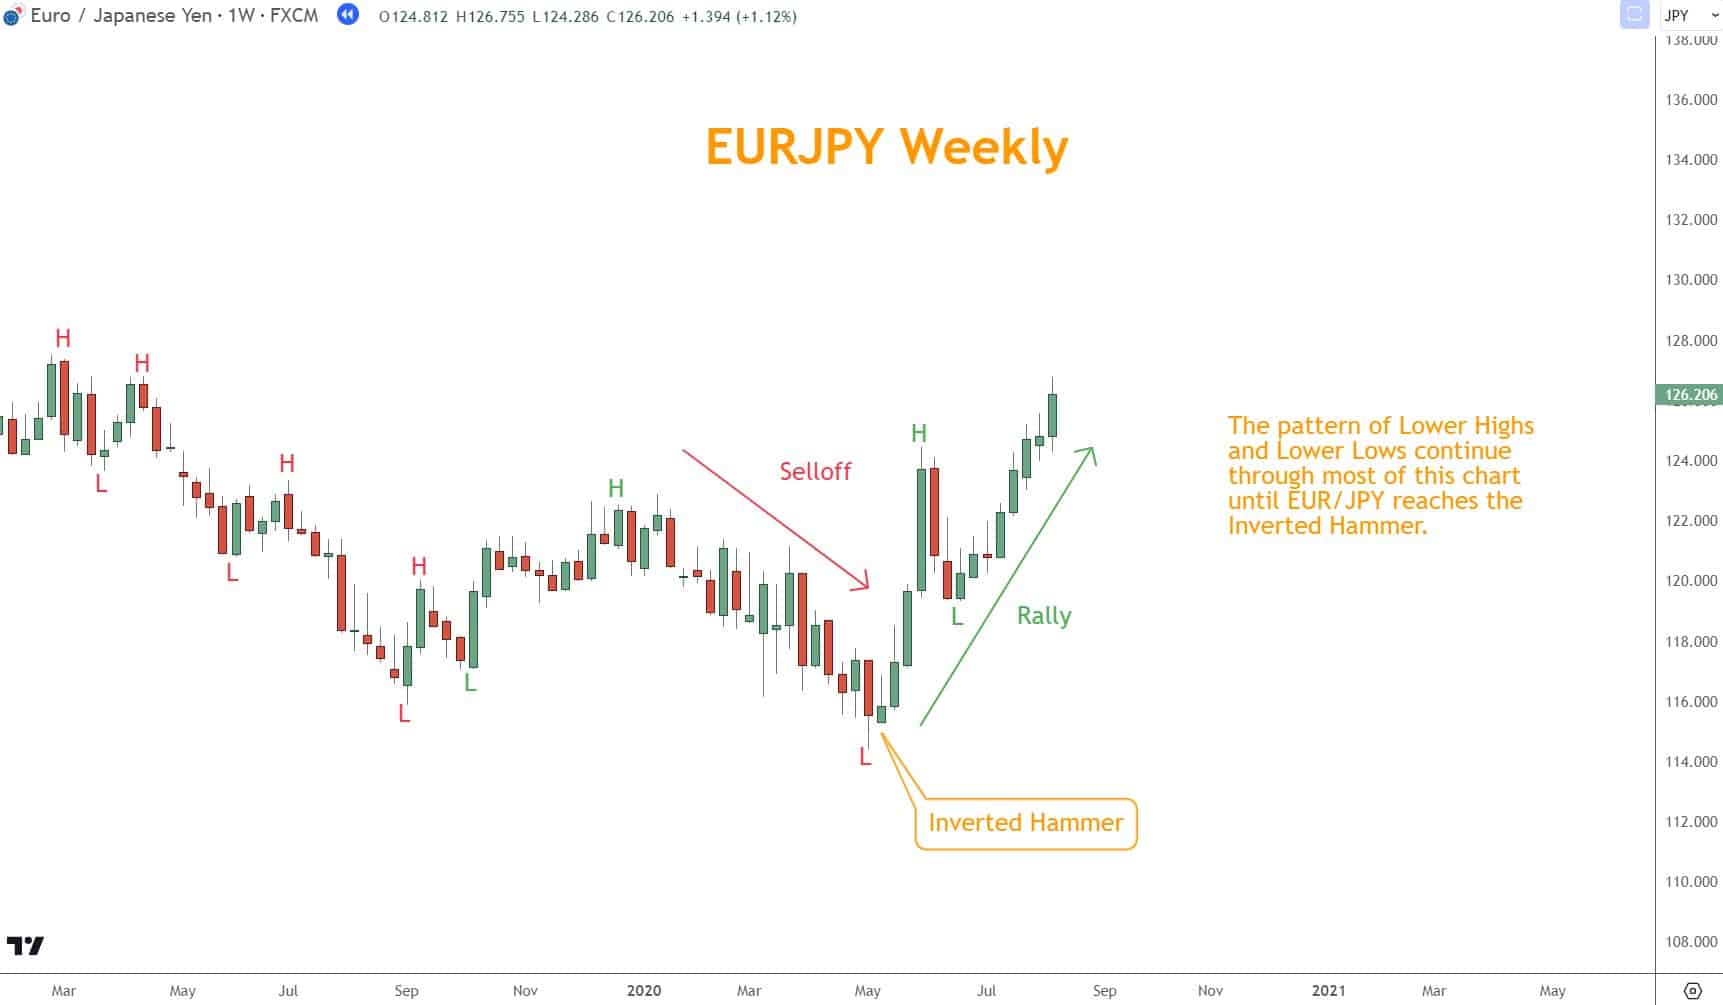
In another EUR/JPY example, a small body and a long upper shadow characterize the Inverted Hammer pattern, suggesting a potential Bullish reversal.
The small body indicates indecision between buyers and sellers, while the extended upper shadow indicates sellers pushing prices down.
This formation is the first sign of a potential reversal, as it suggests that the selling pressure is weakening and buyers may take control.
This confirms that buyers have regained control, and the pair will likely move higher.
How to Trade the Inverted Hammer Pattern
A confirmed Inverted Hammer can be an early signal of a Bullish reversal.
Confirmations to look for
- A strong green candle after the pattern
- A break above minor Resistance
- Bullish Momentum reading
- Confluence with Support
Looking for a Strategy?
Download the Six Basics of Chart Analysis and sign up for Forex Forecast to learn a bottom-up approach to analyzing Forex markets and weekly market updates.
Three Tips for Trading These Reversal Patterns
1. Identify Context First
Understanding trend, sentiment, news, and price action increases the probability that a pattern signals an actual reversal.
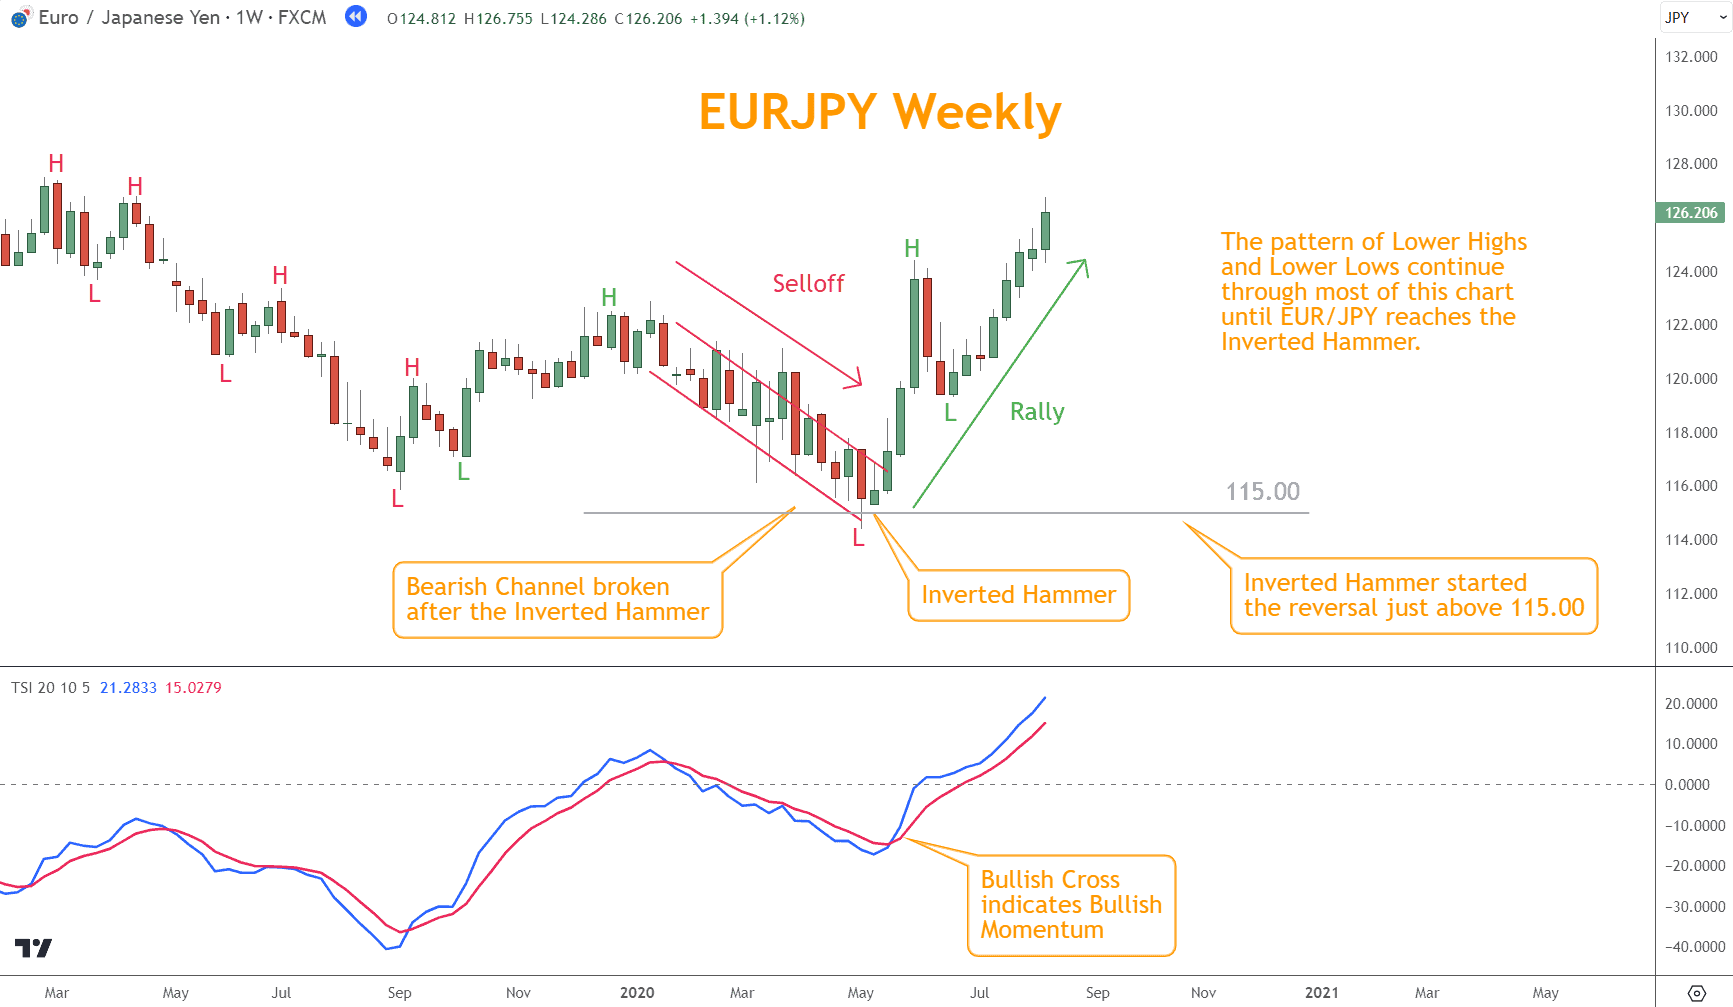
In the EUR/JPY example below, the pattern of lower highs and lower lows is broken after the Inverted Hammer.
2. Incorporate Other Indicators
Momentum, Support/Resistance, and Chart Patterns help validate candlestick setups and reduce false signals.
EUR/JPY’s bullish TSI cross, the reversal bounce off 115.00, and the bullish break of the bearish channel all coincide with the Inverted Hammer reversal.
3. Wait for Confirmation
Never trade solely on the candle. Look for a follow-through candle, structure break, or supporting indicator.
Quiz: Shooting Star & Inverted Hammer Mastery
1. Where does a Shooting Star typically appear in a market trend?
a. At the bottom of a downtrend
b. After a Rally
c. In the middle of consolidation
d. After a major news event
2. What is the key characteristic shared by both the Shooting Star and Inverted Hammer?
a. Long lower shadows
b. Large real bodies
c. Long upper shadows
d. They always appear in sideways markets
3. What is the most important step before trading either candlestick pattern?
a. Enter immediately when the pattern forms
b. Ignore other indicators
c. Wait for confirmation
d. Only trade on higher timeframes
4. What does an Inverted Hammer indicate after a Selloff?
a. Guaranteed reversal
b. Sellers strengthening
c. Potential Bullish reversal
d. Breakout continuation
5. Which tool does not help confirm these patterns?
a. Momentum indicators
b. Chart Patterns
c. Support and Resistance
d. Ignoring context
Answer Key
- b – The Shooting Star forms after a Rally.
- c – Both patterns have long upper shadows.
- c – Confirmation is essential before trading.
- c – It suggests a potential Bullish reversal.
- d – Ignoring context never helps confirm a trade.
What’s the Next Step?
Select a Forex chart and locate Shooting Star and Inverted Hammer patterns using what you learned. Then:
- Look for confluence with Momentum, Chart Patterns, or Support/Resistance
- Evaluate the broader market context
- Practice waiting for confirmation
If you don’t yet have a structured analysis strategy, start with the Six Basics of Chart Analysis—free to learn.

When you download it, you’ll also receive Forex Forecast every Sunday.
Frequently Asked Questions
What mistakes should I avoid when trading these patterns?
Avoid relying solely on the pattern, skipping confirmation, ignoring market context, and failing to define stop-loss or take-profit targets.
Are there similar candlestick patterns I should learn?
Yes. Doji, Hammer, Hanging Man, Engulfing, and Morning/Evening Star patterns all support reversal analysis.
Can these patterns be used on any timeframe?
Yes, but higher timeframes (H4, Daily, Weekly) tend to produce more reliable signals.
Forex Trading Disclosure Statement
Risk Warning:
Forex trading carries significant risk and may not be suitable for all investors. Leveraged trading can result in substantial losses exceeding your initial investment. Trade only with capital you can afford to lose.
Market Risks and Volatility:
Currency movements are influenced by global economic, political, and social events. High volatility can cause sudden price changes and unexpected losses.
Leverage Risks:
Leverage amplifies gains and losses. Misuse can lead to rapid loss of capital.
Technology Risks:
Trading platforms may experience failures, latency, or pricing errors that impact execution.
No Guaranteed Results:
Past performance does not guarantee future outcomes. No strategy can eliminate risk.
Educational Use Only:
All information provided is educational and not financial advice. Consult a licensed financial professional before trading.
Responsibility:
You are solely responsible for all trading decisions, including risk management and compliance with local regulations.