
In Forex trading, trading a sideways market—also called a range-bound or horizontal market—presents unique challenges and opportunities.
Unlike trending markets, sideways conditions occur when prices move within a narrow range, showing no strong upward or downward direction. In these conditions, common trend-following methods often fail, and traders must rely on specialized technical tools to find profitable setups.
This guide explores how to trade sideways markets effectively using Trend, Momentum, Japanese Candlesticks, Chart Patterns, and Support and Resistance.
By the end, you’ll understand how to recognize sideways conditions, select the right tools, and create a strategy that fits your trading style.
Quick Reference Table: Key Tools for Trading a Sideways Market
| Tool | Primary Use | Common Indicators or Patterns | What It Reveals |
| Trend Analysis | Identify a lack of clear direction | Moving Averages, Trendlines | Confirms range conditions |
| Momentum Indicators | Detect overbought/oversold zones | RSI, Stochastic Oscillator | Signals reversals within range |
| Japanese Candlesticks | Visualize price sentiment | Doji, Spinning Top, Hammer | Highlights potential turning points |
| Chart Patterns | Define range or consolidation zones | Rectangles, Triangles, Flags | Maps entry and exit levels |
| Support & Resistance | Determine range boundaries | Historical price levels | Marks buy/sell zones |
TL;DR – Master These 3 Tools for Range-Bound Trading
This article teaches you how to trade a sideways Forex market using:
- Trend Analysis – recognize consolidation and avoid false signals.
- Momentum Indicators – identify overbought/oversold levels for reversals.
- Japanese Candlesticks – visually confirm price sentiment.
You’ll also learn how Chart Patterns and Support and Resistance help frame entries, exits, and breakout potential. Success in range-bound trading depends on patience, discipline, and sound risk management.
Table of Contents
- TL;DR – Master These 3 Tools for Range-Bound Trading
- What Is a Sideways Market?
- Is Trend a Help or a Hindrance in Sideways Markets?
- Is Momentum Crucial to Trade a Sideways Market?
- Can You Trade a Sideways Market with Japanese Candlesticks?
- Can Chart Patterns Help Trade a Sideways Market?
- How Essential Are Support and Resistance in a Sideways Market?
- Conclusion
- What’s the Next Step?
- Quiz: Understanding Sideways Market Trading
- Forex Trading Disclosure Statement
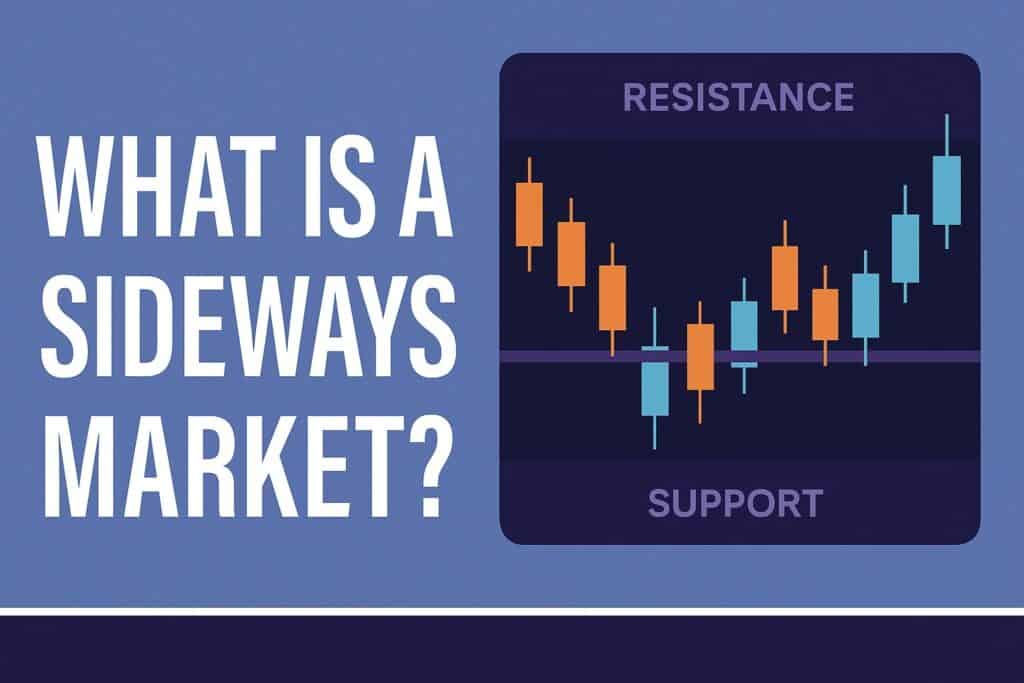
What Is a Sideways Market?
A sideways or range-bound market is a period in which currency prices fluctuate between well-defined upper (resistance) and lower (support) levels, without forming a clear trend.
These phases often occur after strong rallies or selloffs as the market consolidates before its next significant move.
Recognizing a sideways market is essential, as using trend-based indicators or strategies in these conditions often yields false signals and premature trades.
Is Trend a Help or a Hindrance in Sideways Markets?
Trend analysis plays a significant role in Forex trading, but it behaves differently in sideways markets.
Because the market lacks clear direction, traditional trend-following indicators—such as moving averages—tend to whipsaw, generating false buy or sell signals.
In range-bound conditions, prices often hover around the moving average without consistently breaking above or below it.
By recognizing these patterns, traders can shift from trend-following to range-trading strategies, focusing on buying near support and selling near resistance instead of chasing nonexistent trends.
Is Momentum Crucial to Trade a Sideways Market?
Momentum indicators can be highly effective in sideways conditions because they measure the strength and speed of price movements.
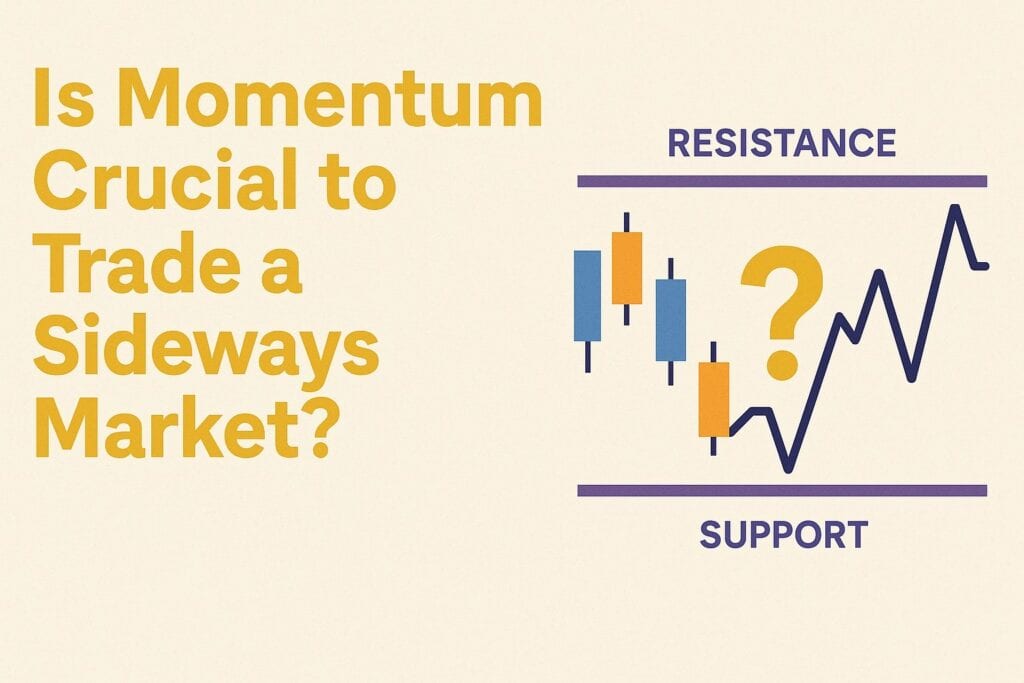
In these environments, they help traders spot overbought and oversold areas that may signal reversals within the range.
Two commonly used indicators are the Relative Strength Index (RSI) and the Stochastic Oscillator:
- When RSI rises above 70, the market may be overbought—suggesting a possible pullback.
- When RSI falls below 30, it indicates oversold conditions and a potential rebound.
By monitoring these signals, traders can fine-tune entries and exits to profit from short-term oscillations while maintaining clear risk limits.
Looking for a Strategy?
Download the Six Basics of Chart Analysis and sign up for Forex Forecast to learn a bottom-up approach to analyzing Forex markets and weekly market updates.
Can You Trade a Sideways Market with Japanese Candlesticks?
Japanese Candlestick patterns are among the most reliable tools for interpreting market sentiment in sideways markets.
Each candlestick reflects price psychology—revealing whether buyers or sellers are gaining control.
Key candlestick patterns in range-bound markets include:
- Doji: Signals indecision; price is likely to continue consolidating.
- Spinning Top: Indicates market balance and potential shift in control.
- Hammer: Suggests a bullish reversal after a decline.
Using candlestick patterns near support or resistance levels enhances confidence in trade timing and improves accuracy.
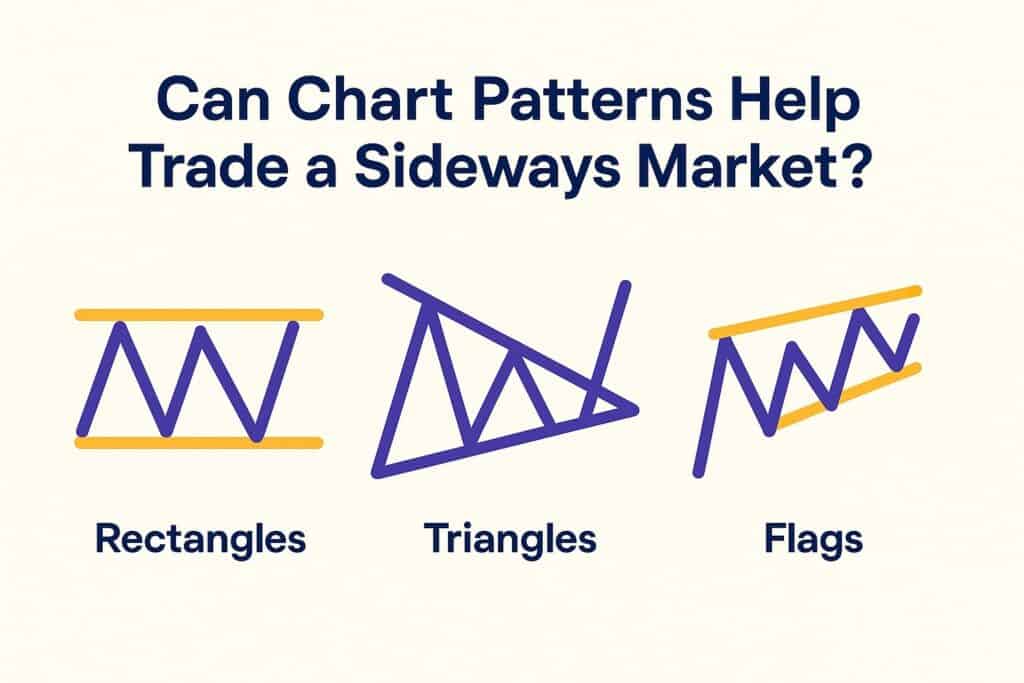
Can Chart Patterns Help Trade a Sideways Market?
Chart patterns are visual representations of price structure and consolidation.
In sideways markets, they help traders understand when to expect continuation or breakout moves.
Common patterns include:
- Rectangles: Parallel horizontal lines defining the upper and lower range—ideal for range trading.
- Triangles: Converging trendlines showing tightening consolidation, often preceding breakouts.
- Flags: Short, slanted rectangles that signal brief pauses before resuming the prior trend.
Recognizing these formations allows traders to anticipate breakouts or reversals and plan trades with clearer boundaries.
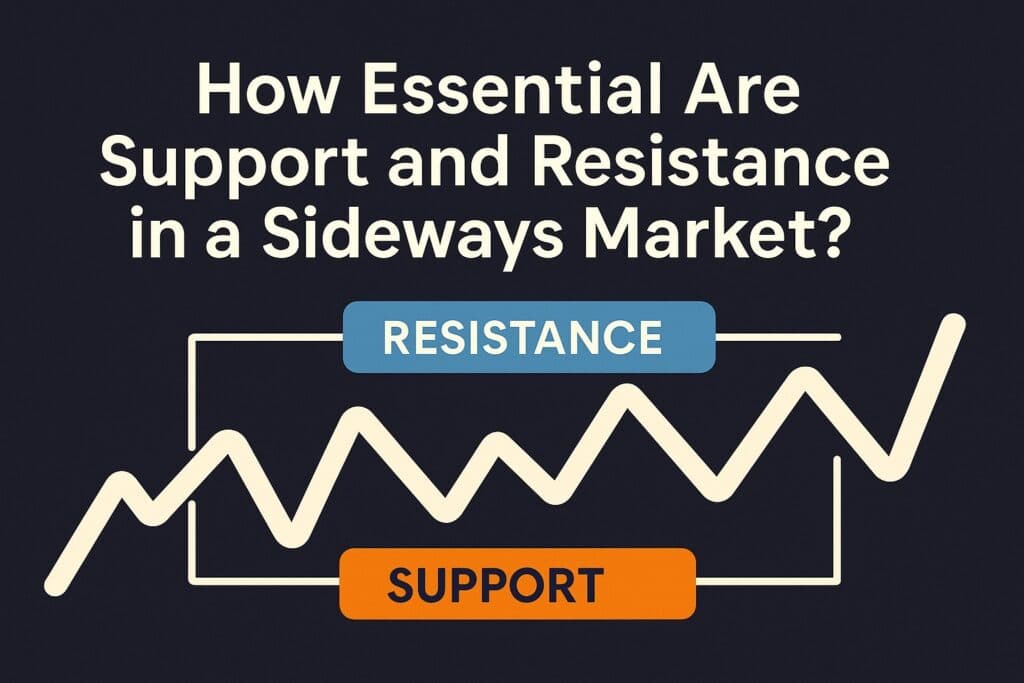
How Essential Are Support and Resistance in a Sideways Market?
Support and Resistance levels form the foundation of successful range-bound trading.
In a sideways market, prices repeatedly bounce between these two zones—creating reliable buy and sell regions.
You can identify these levels using historical price data, focusing on areas where prices have previously reversed or stalled.
By combining these levels with confirmation tools such as candlestick patterns or momentum signals, traders can pinpoint high-probability entries and exits.
Support and resistance analysis also prepares traders for potential breakouts, which often occur when prolonged consolidation ends and new trends begin.
Conclusion
Trading a sideways market requires patience, precision, and a disciplined approach.
While trend-following strategies may fail, a trader equipped with the right tools—Trend, Momentum, Candlesticks, Chart Patterns, and Support/Resistance—can capitalize on the smaller, repeatable swings within the range.
Beyond technical skill, success depends on sound risk management and trading psychology.
Practice with demo accounts before applying these techniques to live markets, and continuously refine your analysis to adapt to changing conditions.
What’s the Next Step?
- Identify a sideways market on your Forex charts.
- Apply the three main tools discussed: Trend, Momentum, and Candlesticks.
- Confirm your analysis using Chart Patterns and Support/Resistance.
- Backtest your approach in a demo account.
If you’re new to chart analysis, start with The Six Basics of Chart Analysis—a free guide that teaches foundational skills you can apply immediately.
You’ll also receive Forex Forecast, a free weekly email that includes:
- Trade ideas based on real market conditions
- Case studies applying the Six Basics
- Video tutorials and trading guides
- Early access to webinars and tools

Learn more at PositionForex.com.
Quiz: Understanding Sideways Market Trading
- What defines a sideways or range-bound market?
a) A market that continuously trends upward
b) A market with no clear direction, moving within a narrow range
c) A market driven by fundamental data only
d) A market that ignores technical levels - Which Momentum indicator is most useful for spotting overbought and oversold conditions?
a) MACD
b) RSI
c) Bollinger Bands
d) Volume Profile - What does a Doji candlestick typically indicate in a sideways market?
a) A strong bullish signal
b) Market indecision
c) Immediate breakout
d) Trend continuation - How do Support and Resistance levels help in range-bound trading?
a) They identify possible breakout points and reversal zones
b) They confirm long-term economic cycles
c) They eliminate market volatility
d) They predict interest rate movements - What is the best trading mindset for sideways markets?
a) Aggressive and high-leverage
b) Patient and disciplined
c) Reactive and emotional
d) Trend-following at all costs
Answer Key
- b) A market with no clear direction, moving within a narrow range
- b) RSI
- b) Market indecision
- a) They identify possible breakout points and reversal zones
- b) Patient and disciplined
Forex Trading Disclosure Statement
Risk Warning:
Forex trading involves significant risk and may not be suitable for all investors. The leveraged nature of Forex trading can lead to substantial gains or losses. Only trade with money you can afford to lose.
Market Risks and Volatility:
Forex markets are influenced by economic and geopolitical events that can cause unpredictable price movements. Sudden volatility can lead to losses exceeding your initial investment.
Leverage Risks:
Leverage magnifies both potential profits and losses. Improper use can result in rapid capital depletion.
Technology Risks:
Trading platforms are subject to latency, data errors, and execution failures that may affect trade outcomes.
No Guarantee of Profitability:
Past results do not guarantee future success. No system or strategy eliminates the inherent risks of Forex trading.
Educational Purposes Only:
This content is provided for educational purposes and does not constitute financial advice. Consult a licensed financial advisor before trading.
Responsibility:
You are solely responsible for your trading decisions and outcomes. Ensure full understanding of margin requirements, leverage, and risk management before trading.
By trading Forex, you acknowledge these risks and accept full responsibility for your actions.