
Three-candle Japanese Candlestick patterns reveal powerful reversal signals and give you deeper insight into market sentiment.
These formations, rarer than one- and two-candle patterns, can offer obvious turning points when used correctly.
This article explores the four most critical three-candle patterns:
- Morning Star
- Evening Star
- Three White Soldiers
- Three Black Crows
You’ll also learn how to combine these patterns with momentum indicators, chart patterns, and support/resistance levels to increase accuracy and improve your trading results.
Table of Contents
- What Is a Three-Candle Japanese Candlestick Pattern in Forex?
- Examples of Three-Candle Patterns You Can Trade Today
- 1. Evening Star & Morning Star Reversals
- 2. Three White Soldiers & Three Black Crows
- Should You Combine These Patterns with Other Indicators?
- Using Momentum Indicators for Confirmation
- Combining Chart Patterns with Three-Candle Formations
- Support and Resistance: The Most Reliable Confirmation
- Conclusion
- What’s the Next Step?
- Three-Candle Pattern Quiz
- 1. Which statement best describes a Morning Star pattern?
- 2. What does the Three Black Crows pattern typically signal?
- 3. Which confirmation tool is considered the most reliable when validating three-candle patterns?
- 4. Which momentum indicator can help confirm Overbought or Oversold conditions when evaluating three-candle reversals?
- 5. Why should three-candle patterns not be traded without confirmation?
- Answer Key
- Frequently Asked Questions
- Forex Trading Disclosure Statement
What Is a Three-Candle Japanese Candlestick Pattern in Forex?
Three-candle patterns are multi-bar reversal formations used to forecast turning points in market direction. Each candle provides part of a story about buyers and sellers, and together they reveal powerful momentum shifts.
Candlestick structures communicate:
- Opening and closing prices
- Highs and lows of each period
- The strength of buyers versus sellers
- Whether momentum is accelerating or fading
While one-candle patterns (Hammer, Shooting Star) and two-candle patterns (Engulfing, Dark Cloud Cover) are more common, three-candle patterns often provide clearer, more decisive signals because they require multiple confirmations within the structure.
Examples of Three-Candle Patterns You Can Trade Today
These patterns often resemble combinations of smaller formations, but they stand out because of their reliability and distinct visual signatures.
We focus on the four most actionable and uniquely identifiable patterns for Forex traders.
1. Evening Star & Morning Star Reversals
The Morning Star and Evening Star are among the most widely recognized three-candle reversal signals.
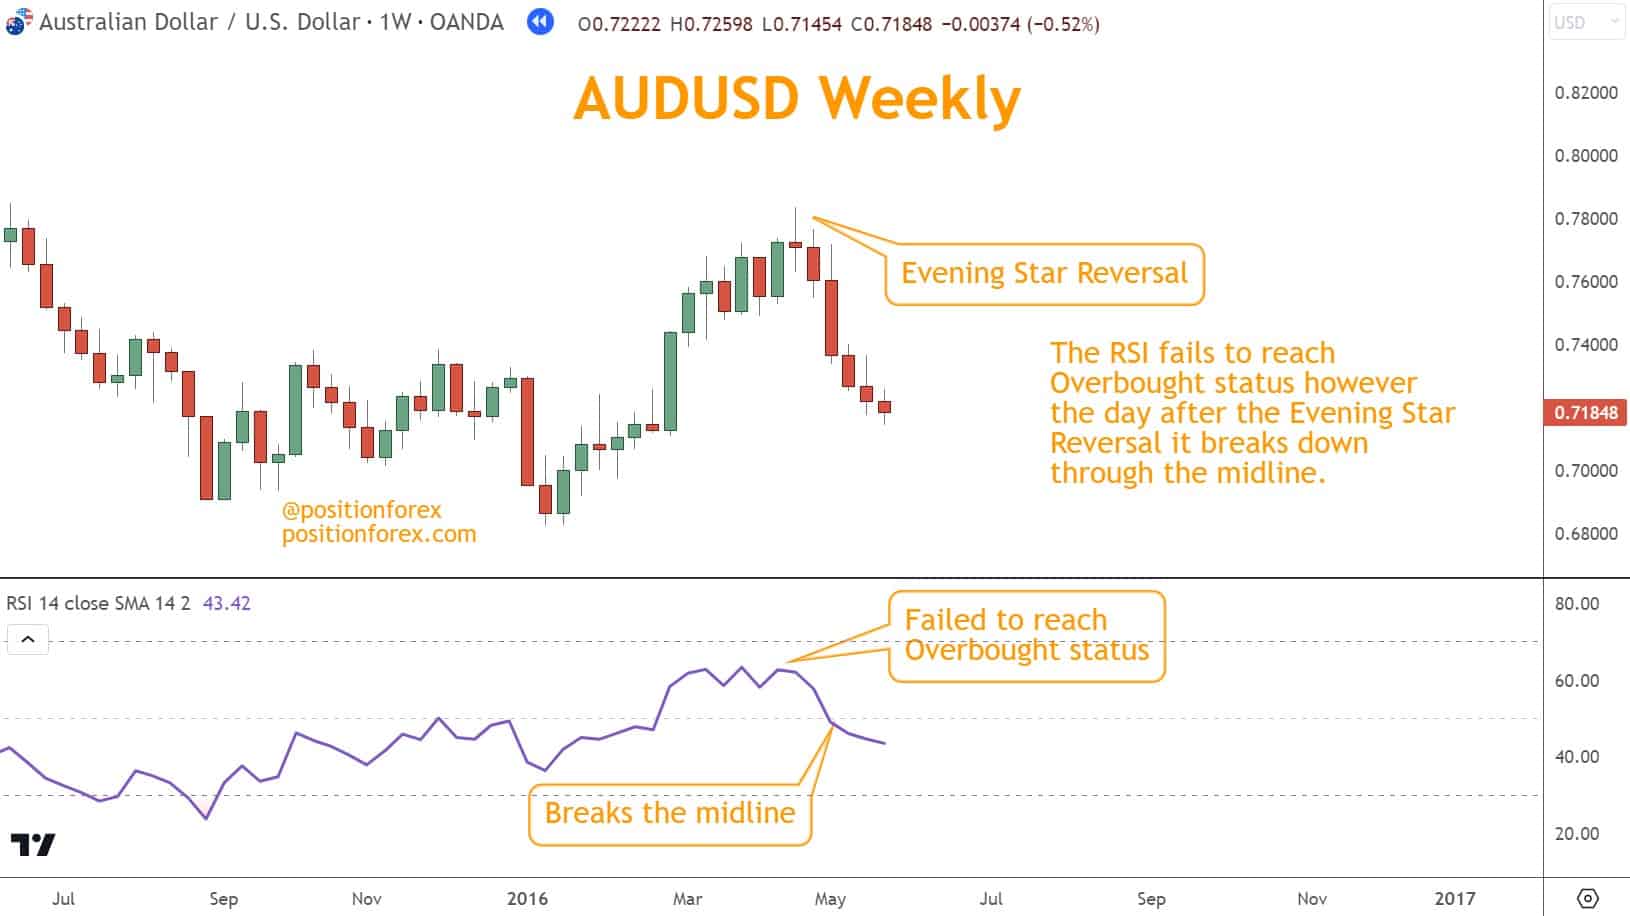
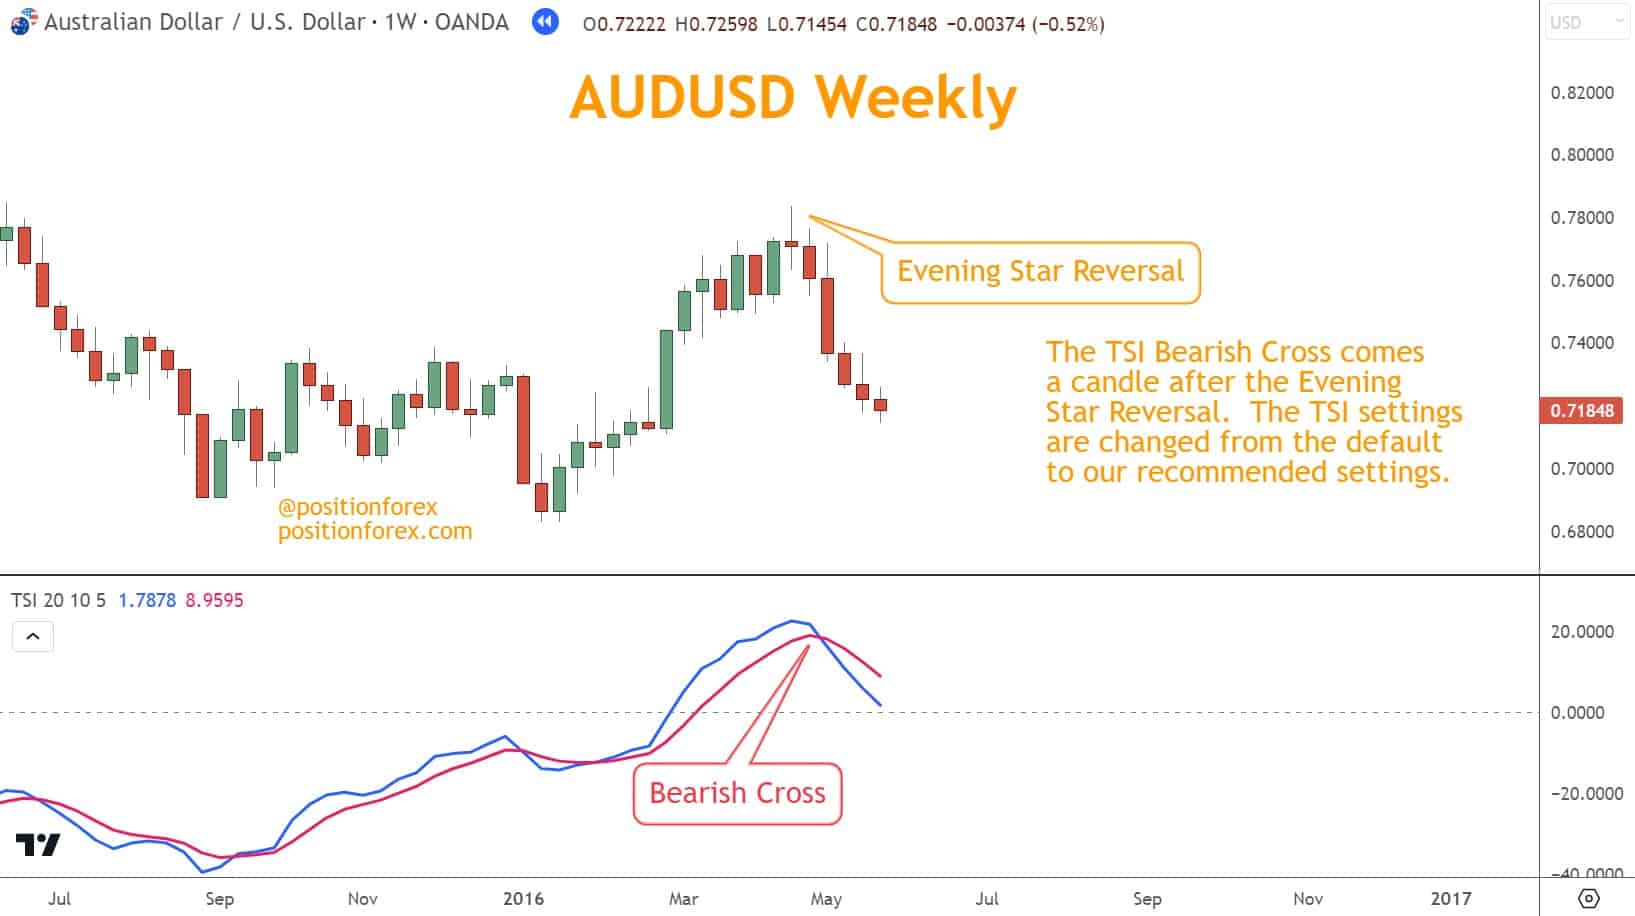
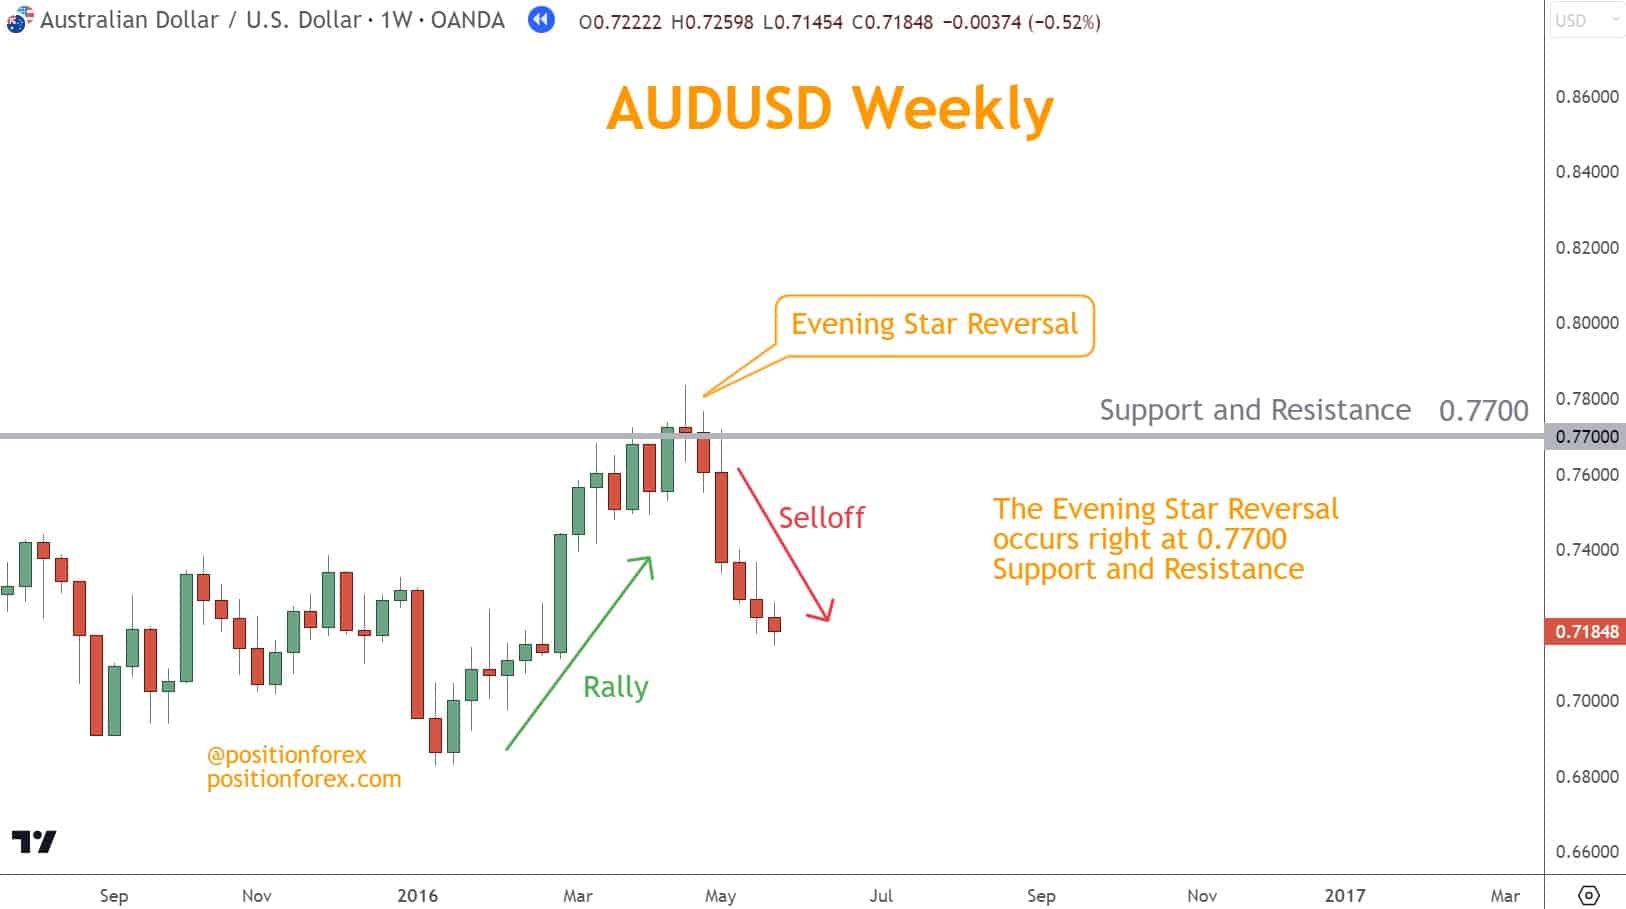
Evening Star (Bearish Reversal)
Appears after a Rally and signals a shift from buyers to sellers.
Structure:
- Tall Bullish candle (buyers firmly in control)
- Small candle showing indecision
- Strong Bearish candle confirming a shift in momentum
The AUD/USD example below demonstrates this bearish reversal.
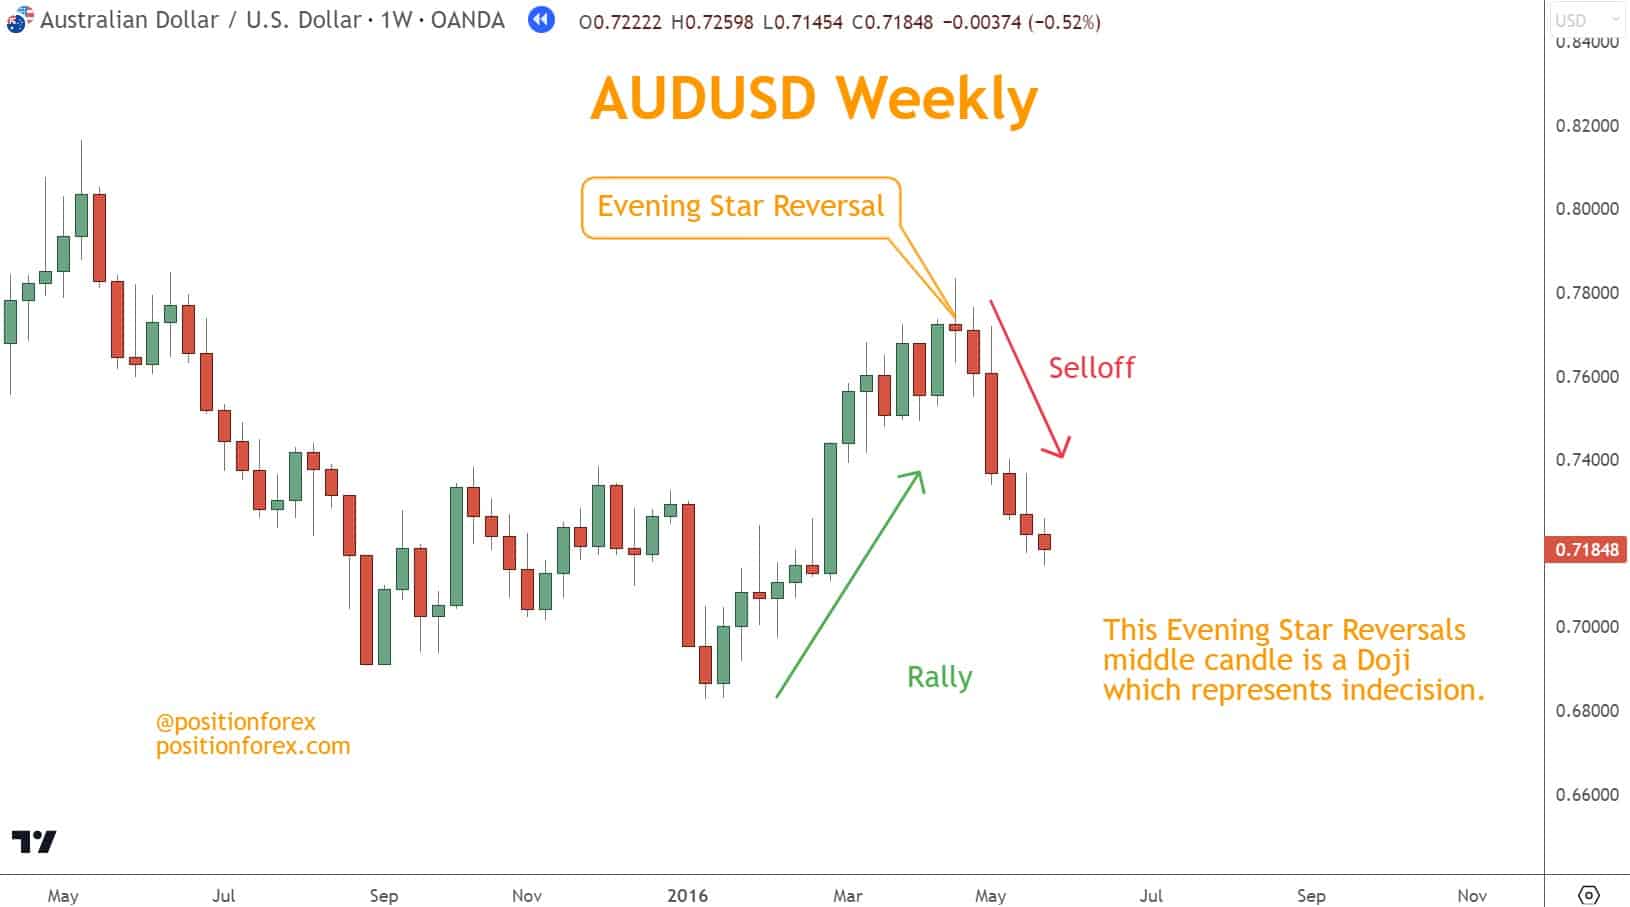
This pattern warns that buying pressure has weakened and a Selloff may follow.
Morning Star (Bullish Reversal)
Appears after a Selloff, showing exhaustion in selling pressure.
Structure:
- Tall Bearish candle
- Small indecision candle
- Strong Bullish candle confirming buyers are taking over
This AUD/USD example illustrates the bullish reversal.
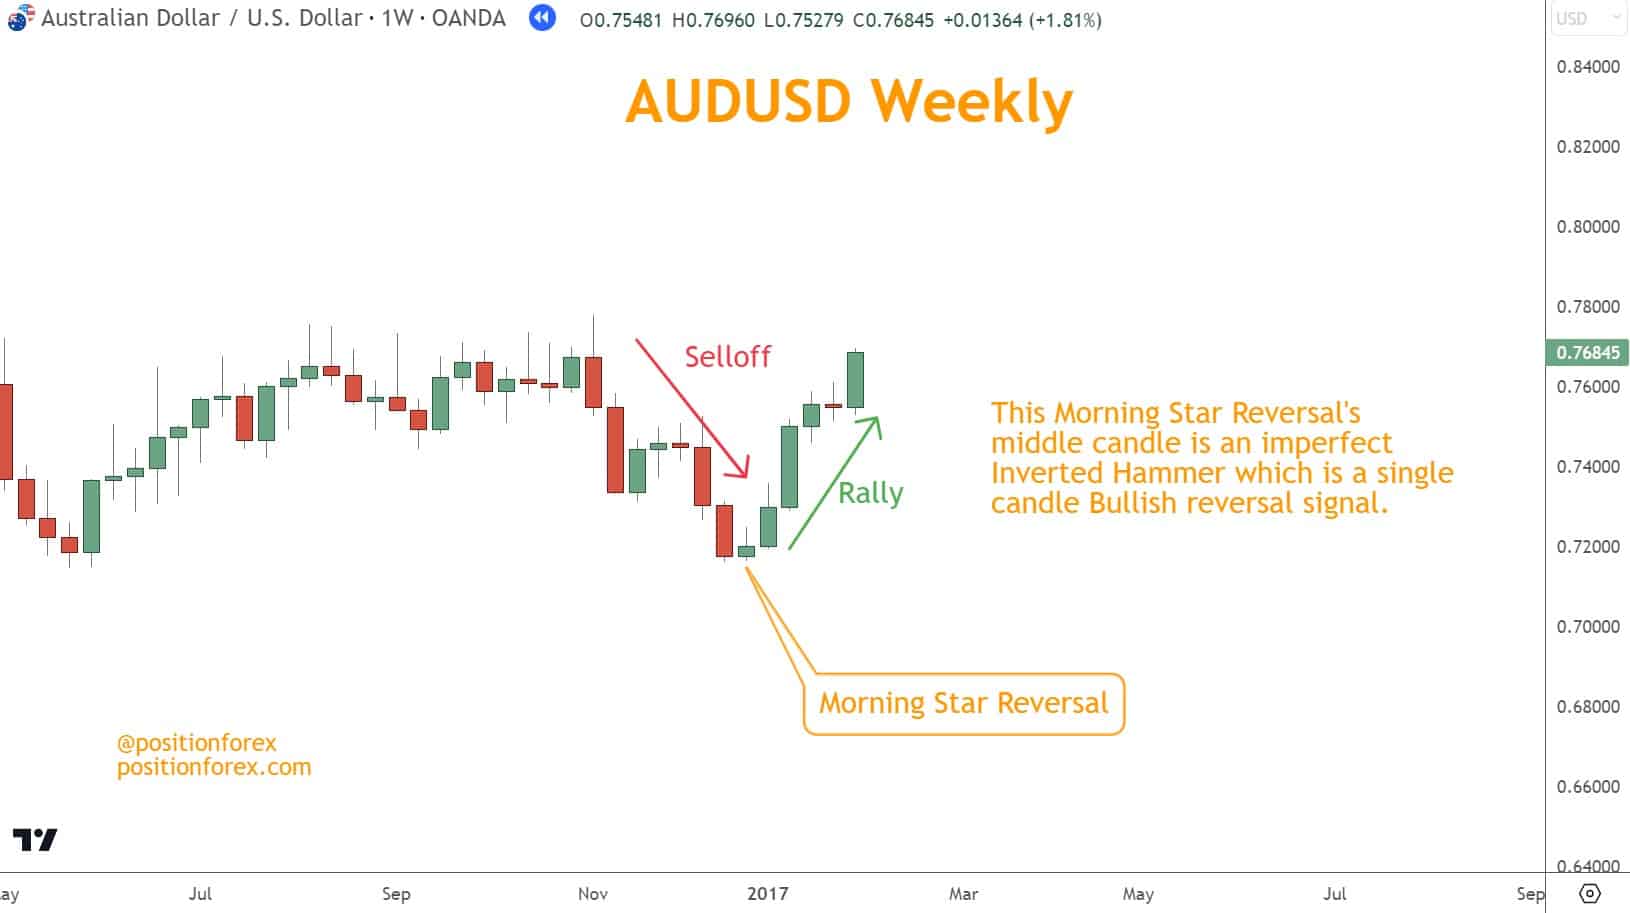
Morning and Evening Stars should always be confirmed with additional tools—momentum, S/R, or other chart patterns—to avoid false reversals.
2. Three White Soldiers & Three Black Crows
These patterns are less common but extremely powerful because they represent sustained directional commitment over multiple trading periods.
Three White Soldiers (Bullish Reversal)
Three consecutive strong green candles with higher closes each time.
Signals:
- Sellers are losing control
- Strong buyer commitment
- A bullish reversal is likely underway
The AUD/USD example below demonstrates the bullish pattern characterized by three consecutive long green candles moving prices higher.
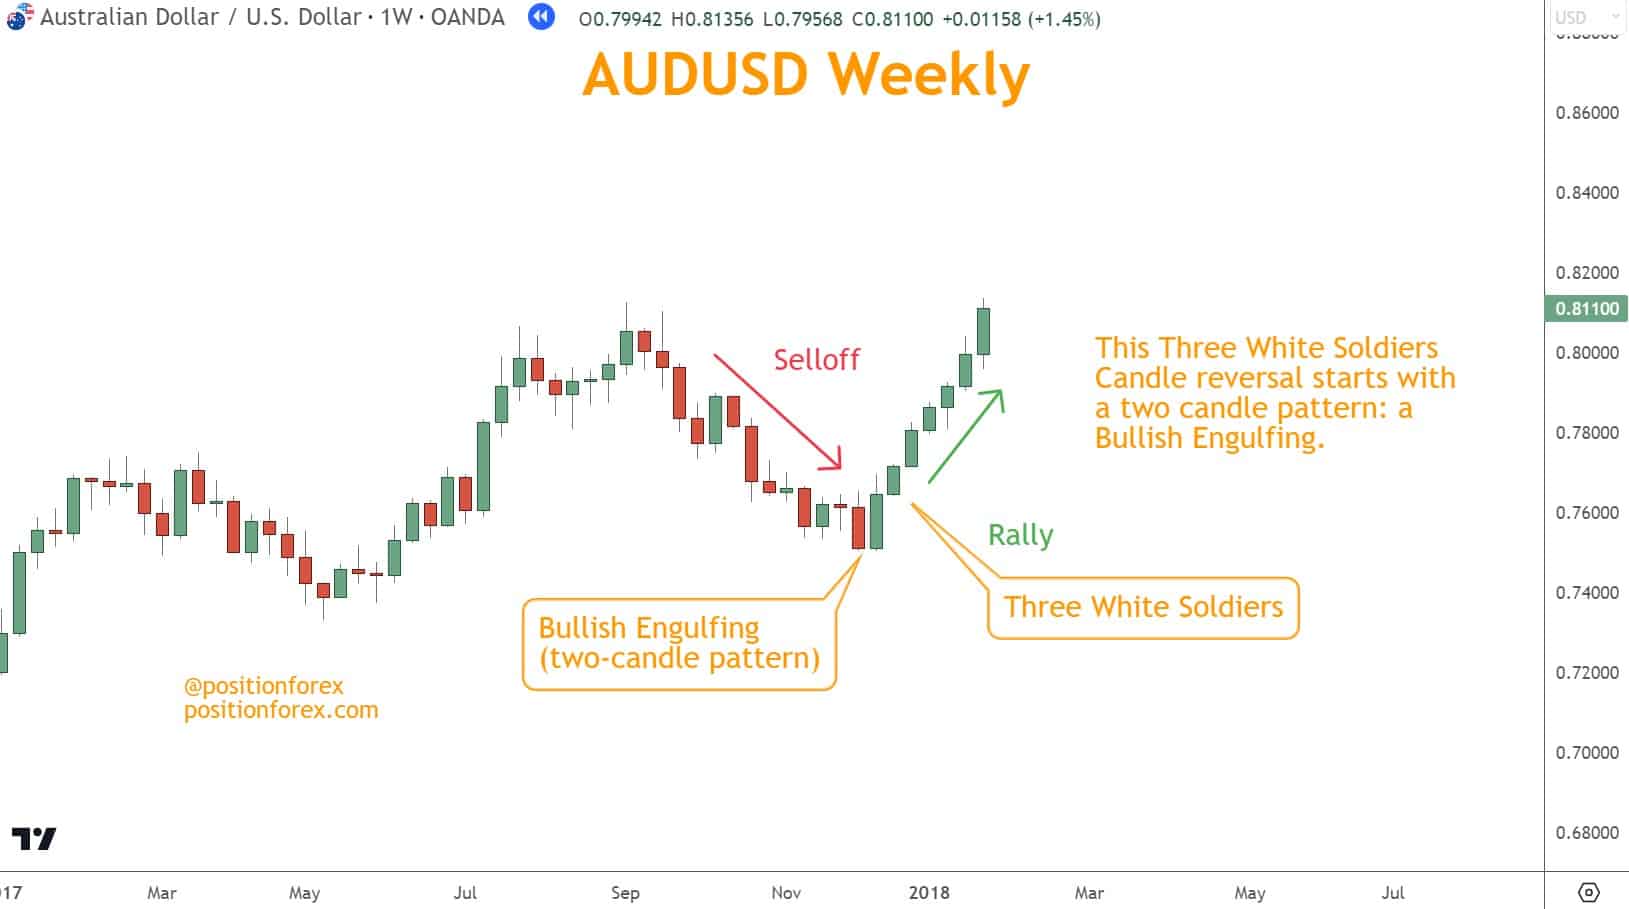
Ideal after a decline at or near support.
Three Black Crows (Bearish Reversal)
Three consecutive red candles with progressively lower closes.
Signals:
- Buyers are exhausted
- Strong, persistent selling pressure
- A Bearish reversal is likely beginning
In the AUD/USD chart below, a Three Black Crows example of a Bearish pattern consisting of three successive long red candles moving prices lower.
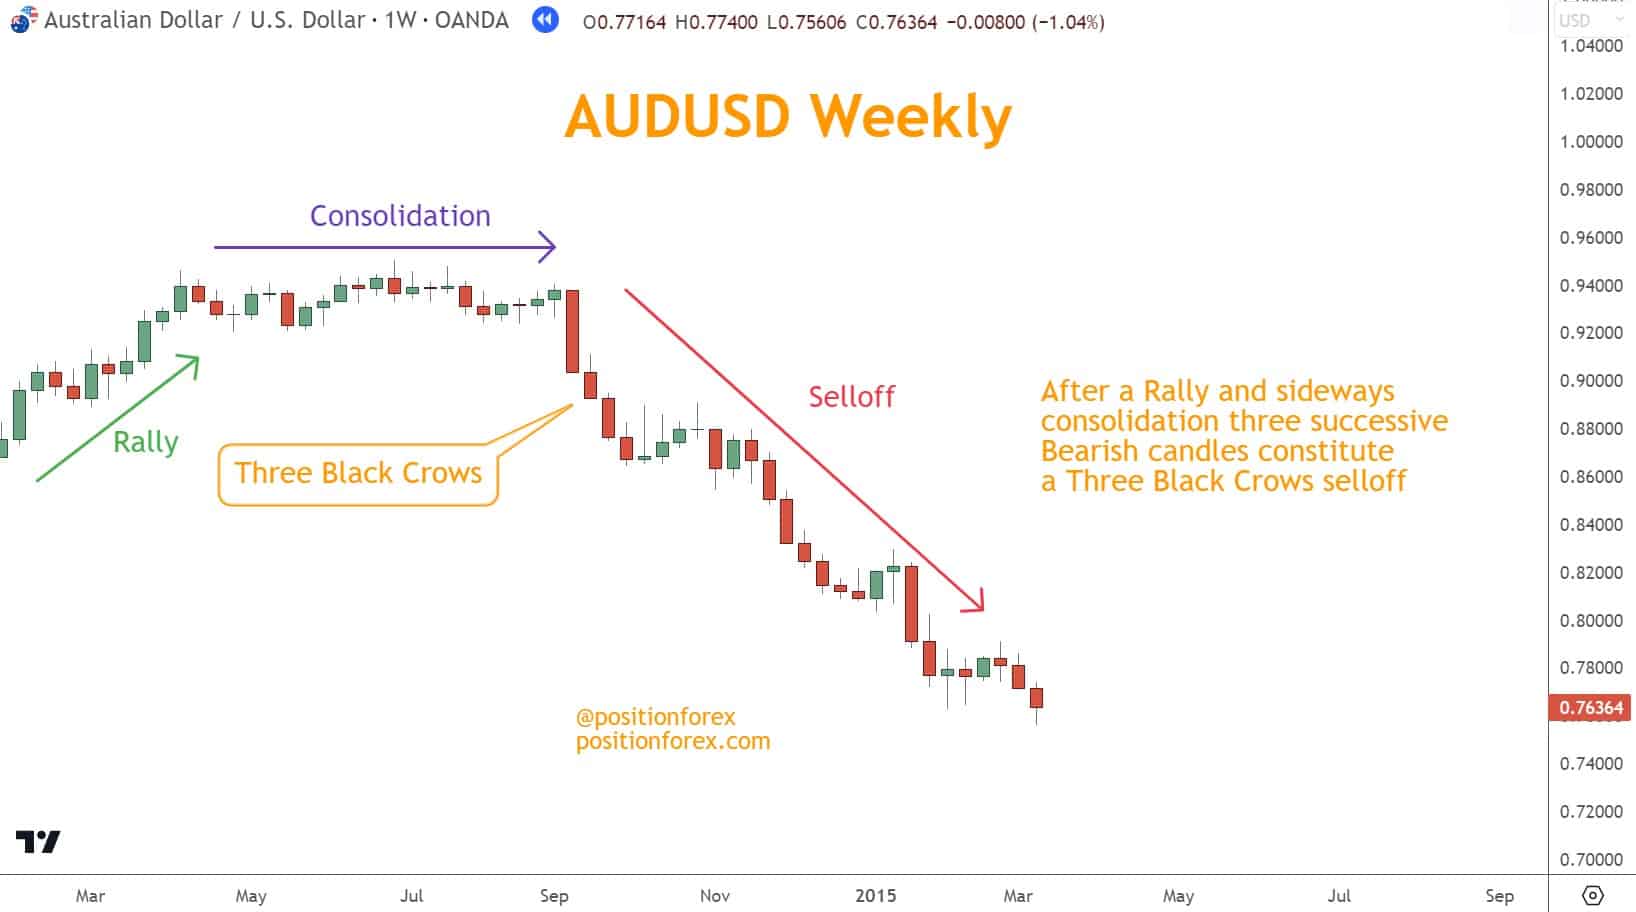
Best interpreted near major resistance.
Looking for a Strategy?
Download the Six Basics of Chart Analysis and sign up for Forex Forecast to learn a bottom-up approach to analyzing Forex markets and weekly market updates.
Should You Combine These Patterns with Other Indicators?
Yes. Three-candle patterns are powerful, but even they require confirmation.
The best confirmations come from Momentum, Chart Patterns, and Support and Resistance.
Using Momentum Indicators for Confirmation
RSI and TSI provide excellent context:
- Overbought/Oversold conditions
- Divergence
- Strength or weakness behind the reversal
Combining with momentum indicators such as the Relative Strength Index (RSI) or True Strength Index (TSI) can be beneficial.
Overbought and oversold levels often coincide with reversals, as described here.
The RSI has specific overbought and oversold levels, whereas a crossover between the TSI and its signal line defines these levels.
Examples:
- A Morning Star forming while RSI is Oversold = higher probability reversal
- Three Black Crows forming with Bearish TSI crossover = stronger confirmation
Momentum should support the reversal outcome, not contradict it.
Combining Chart Patterns with Three-Candle Formations
Three-candle patterns often appear near other structures, such as:
- Falling wedges
- Rising wedges
- Double bottoms
- Double tops
- Triangles
In this AUD/USD example, the Falling Wedge pattern’s apex is broken higher, corresponding with the Three White Soldiers pattern.
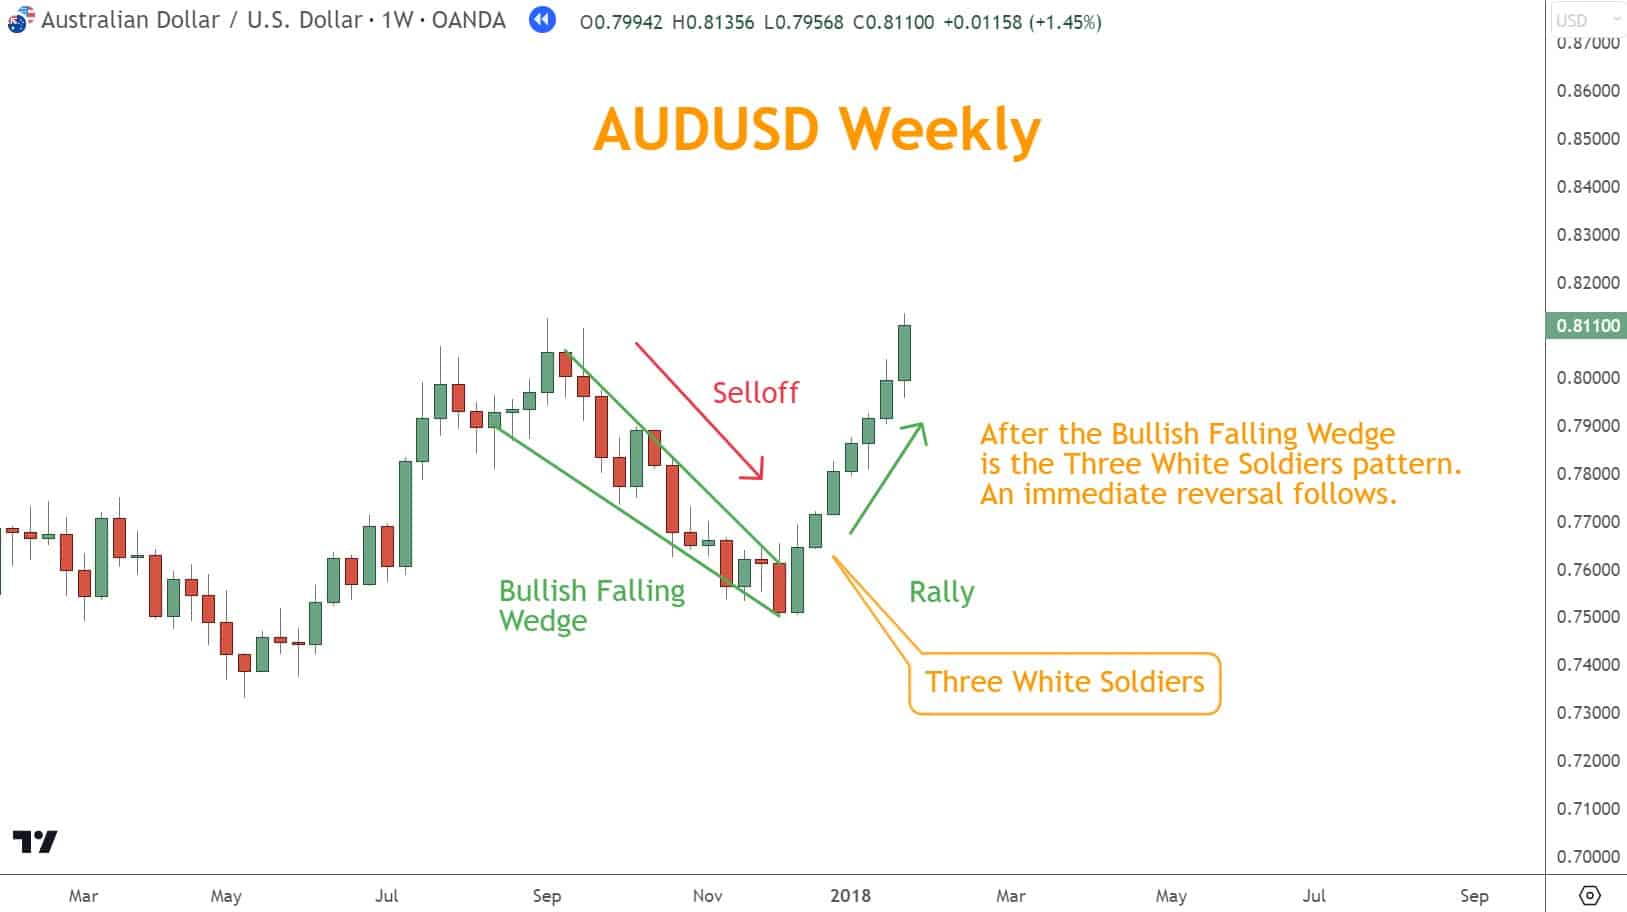
When a chart pattern and a three-candle formation point to the same reversal, the probability increases significantly.
Support and Resistance: The Most Reliable Confirmation
Support and Resistance provide the cleanest and most reliable validation.
- Morning Star at Support → very strong Bullish reversal
- Evening Star at Resistance → highly reliable Bearish reversal
S/R also helps determine:
- Stop placement
- Good target selection
- Likely follow-through area
Support levels are price levels where buying pressure is strong enough to prevent further price declines. In contrast, resistance levels are those where selling pressure is strong enough to prevent further price increases.
Three-candle patterns near key levels are dramatically more actionable than patterns forming in the middle of a price range.
Conclusion
Three-candle Japanese Candlestick patterns provide clear, reliable clues about potential market reversals, but they work best when paired with confirmation.
By combining these formations with momentum indicators, chart patterns, and support and resistance, you can significantly improve the accuracy of your analysis.
Mastering these patterns will help you read market psychology more effectively and make more confident, informed trading decisions.
What’s the Next Step?
- Open a favorite candlestick chart and begin identifying Morning Stars, Evening Stars, Three White Soldiers, and Three Black Crows.
- Confirm each pattern with Momentum, patterns, and Support/Resistance.
- Practice spotting these formations across multiple timeframes to reinforce recognition.
If you need a structured process, download The Six Basics of Chart Analysis—a free guide to help you build a stronger, more consistent approach.
When you sign up, you’ll also receive Forex Forecast every Sunday, including:
- Trade ideas and setups
- Case studies
- Educational videos and guides
- New articles
- Webinars and more

It’s all free.
Three-Candle Pattern Quiz
1. Which statement best describes a Morning Star pattern?
A. Three long Bearish candles forming after a Rally
B. A tall Bearish candle, indecision candle, and strong Bullish candle after a Selloff
C. A tall Bullish candle followed by two small candles
D. A three-candle continuation pattern
2. What does the Three Black Crows pattern typically signal?
A. A Bullish continuation
B. Market indecision
C. A Bearish reversal with strong selling pressure
D. A false breakout
3. Which confirmation tool is considered the most reliable when validating three-candle patterns?
A. Moving averages
B. Trendlines only
C. Support and Resistance levels
D. Volume spikes
4. Which momentum indicator can help confirm Overbought or Oversold conditions when evaluating three-candle reversals?
A. On-Balance Volume (OBV)
B. Relative Strength Index (RSI)
C. MACD histograms only
D. VWAP
5. Why should three-candle patterns not be traded without confirmation?
A. They only work on lower timeframes
B. They often produce signals too late
C. False reversals can occur without additional supporting evidence
D. They require very tight stop-loss placement
Answer Key
- B — A Morning Star is a three-candle Bullish reversal after a selloff.
- C — Three Black Crows signal strong Bearish momentum and a likely reversal.
- C — Support and resistance provide the most explicit, most reliable confirmation.
- B — RSI is widely used to identify Overbought and Oversold levels.
- C — Confirmation prevents acting on false or weak reversal signals.
Frequently Asked Questions
Can Candlestick Patterns Improve Trading Decisions?
Yes. Candlestick patterns help you interpret market sentiment and identify potential reversals. Combined with Momentum, Chart Patterns, and S/R, they become even more reliable.
What Are Common Mistakes Traders Make with Three-Candle Patterns?
Mistakes include:
- Acting without confirmation
- Ignoring major support/resistance
- Overtrading
- Using patterns without proper stop loss and risk management
Are Three-Candle Patterns More Reliable Than One or Two-Candle Patterns?
Generally, yes—because they require multiple confirmations. But they must still be paired with other tools for the best results.
Forex Trading Disclosure Statement
Risk Warning:
Forex trading involves significant risk and may not be suitable for all investors. You may lose more than your initial investment. Only trade with money you can afford to lose.
Market Risks and Volatility:
Currency prices move based on global events, economic data, and geopolitical changes. Volatility can cause sudden, unexpected losses.
Leverage Risks:
Leverage increases both potential gains and potential losses. Use it cautiously.
Technology Risks:
Trading platforms can experience outages, delays, or pricing errors that affect trades.
No Guaranteed Results:
Past performance does not guarantee future outcomes. No strategy eliminates all risk.
Educational Purpose Only:
The information provided is for education, not financial advice. Consult a licensed professional before trading.
Responsibility:
You are responsible for your own trading decisions and risk management.