
The Golden Cross is one of the most widely discussed moving-average strategies in technical analysis, especially in financial media.
It uses two moving averages—a short-term 50-period and a long-term 200-period—to signal potential market shifts when the shorter average crosses above the longer one.
This article explains the Golden Cross, why it became famous, how it applies to Forex trading, and its real limitations.
You’ll also learn how to strengthen this strategy with complementary tools such as Momentum indicators, Japanese Candlesticks, Chart Patterns, and Support/Resistance levels.
TL;DR
If you’re new to the Golden Cross, here’s what matters most:
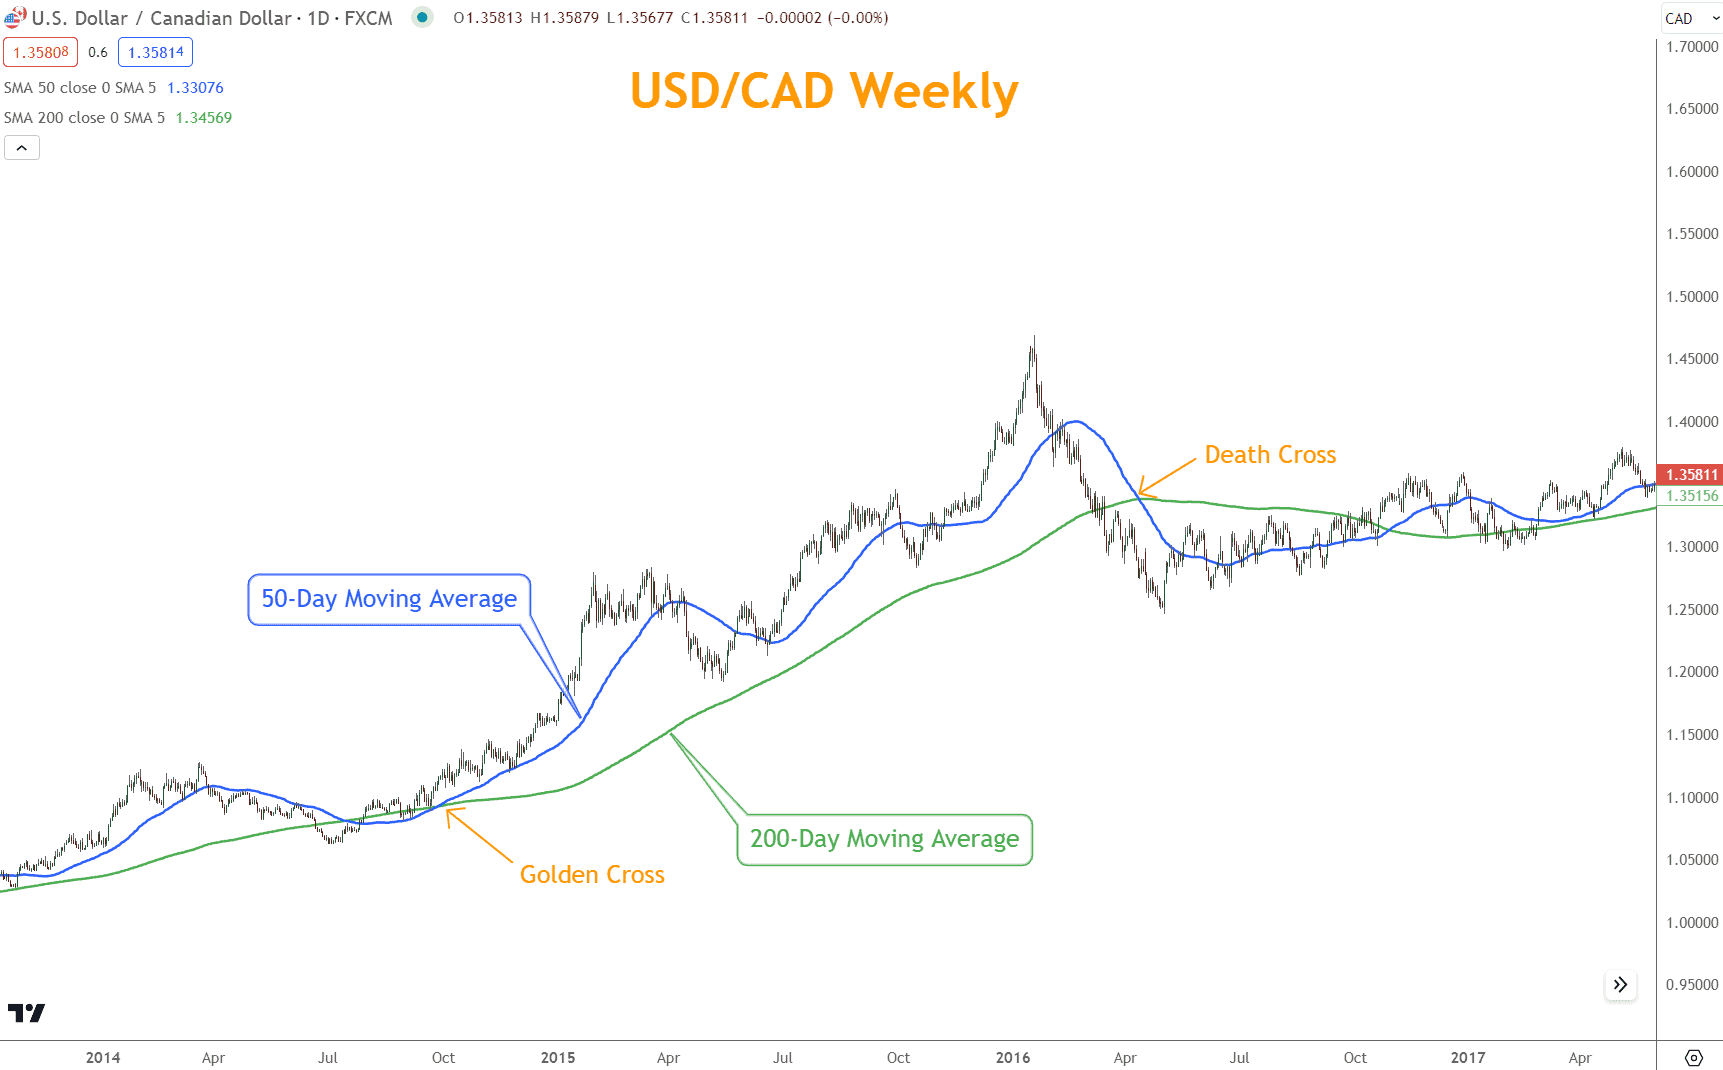
- A Golden Cross occurs when the 50-period moving average crosses above the 200-period moving average, signaling potential bullish momentum.
- A Death Cross is the opposite: the 50-period crosses below the 200-period, signaling bearish momentum.
- The Golden Cross is simple but also lagging, meaning signals often occur after the trend is already underway.
- False signals are common—this strategy must be combined with other tools, such as Momentum, Candlesticks, Chart Patterns, and Support/Resistance, to increase accuracy.
- Use the Golden Cross as part of a complete trading approach, not a standalone buy/sell trigger.
Quick Reference Table: Golden Cross vs. Death Cross
| Signal | Short-Term MA | Long-Term MA | Market Bias | Meaning |
| Golden Cross | Crosses above | 200-period | Bullish | Potential Rally or trend shift upward |
| Death Cross | Crosses below | 200-period | Bearish | Potential Selloff or downward trend shift |
What is a Golden Cross in Trading?
A Golden Cross is a bullish technical pattern that appears when a short-term moving average crosses above a long-term one. The standard setup uses the 50-day moving average crossing above the 200-day moving average.
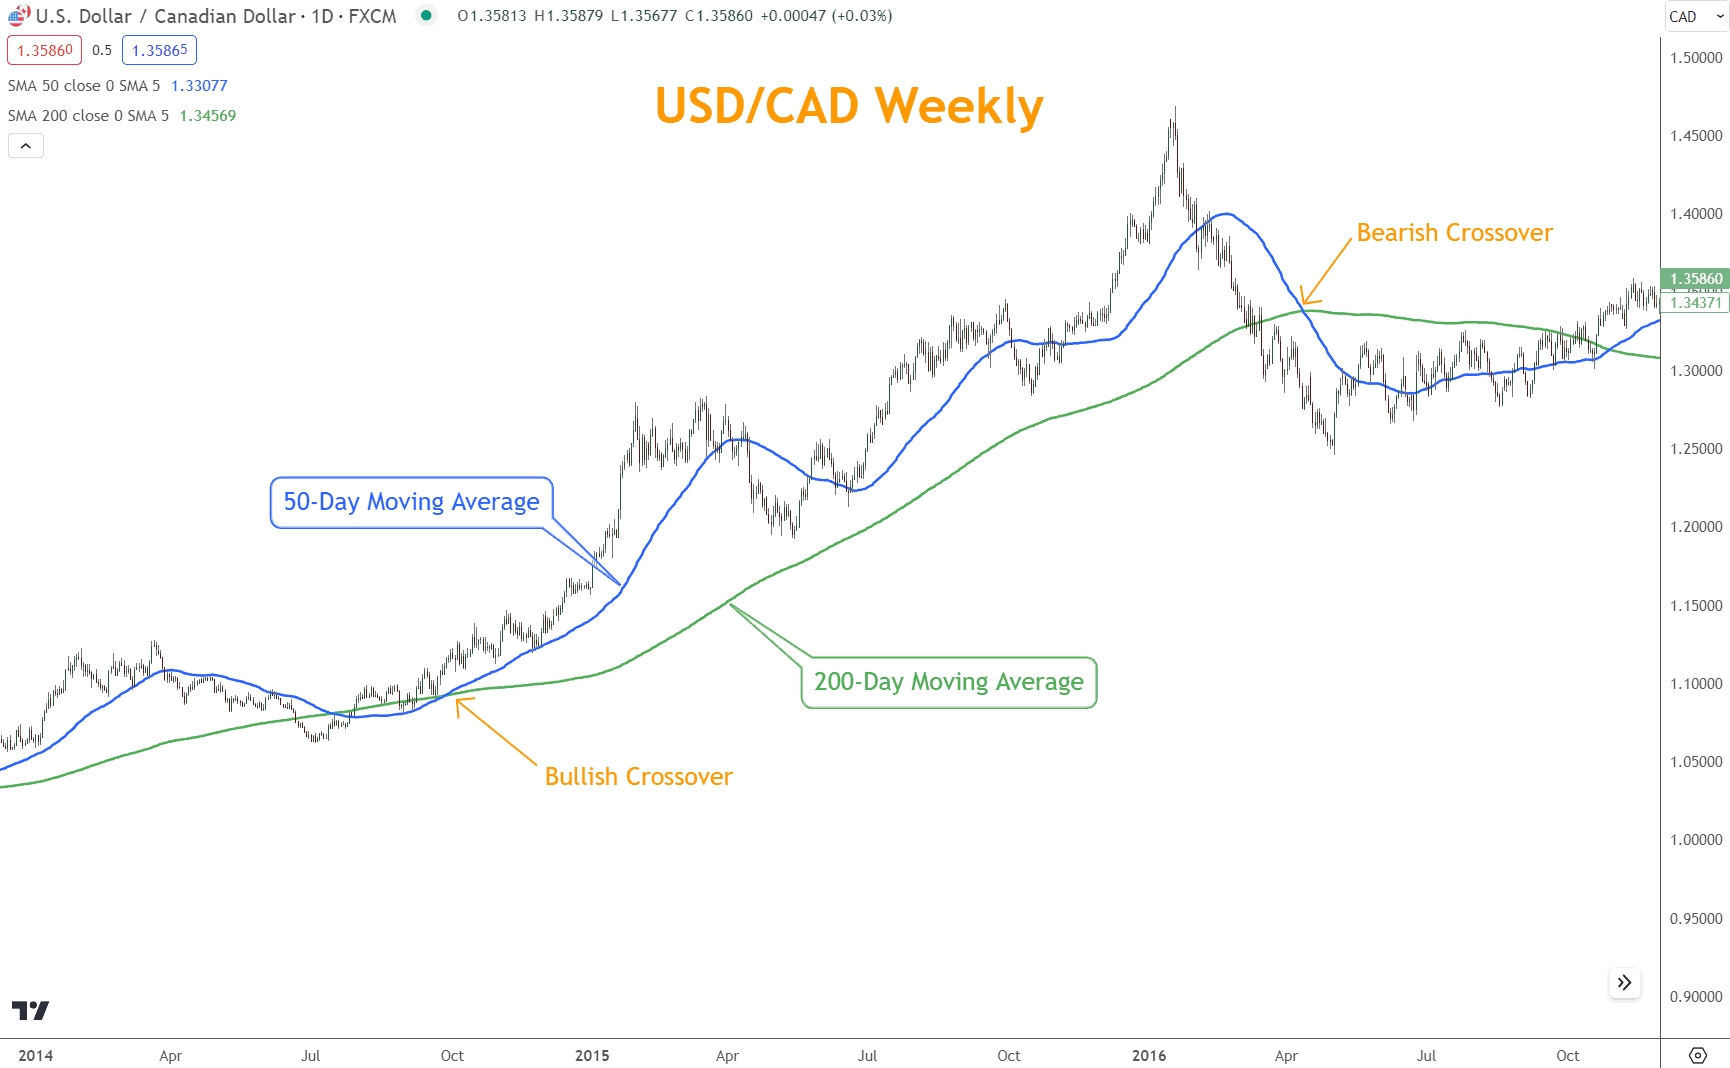
In theory, this crossover signals that short-term momentum is improving enough to push the longer-term trend higher. Traders often view this as a potential buy signal or early sign of a trend reversal.
Why Has This Strategy Grown in Popularity?
The Golden Cross is popular mainly because it is easy to explain and easy to visualize on a chart. Financial media frequently highlights this signal, especially in discussions about stock markets.
As a result, many traders adopt it for its simplicity rather than its effectiveness.
Is This a Reliable Signal or Hype?
Examples in Forex trading show that the Golden Cross can work—but also fail—depending on market context.
Because moving averages are lagging indicators, the signal often appears after much of the move has already occurred. This delay can lead to false entries or missed opportunities.
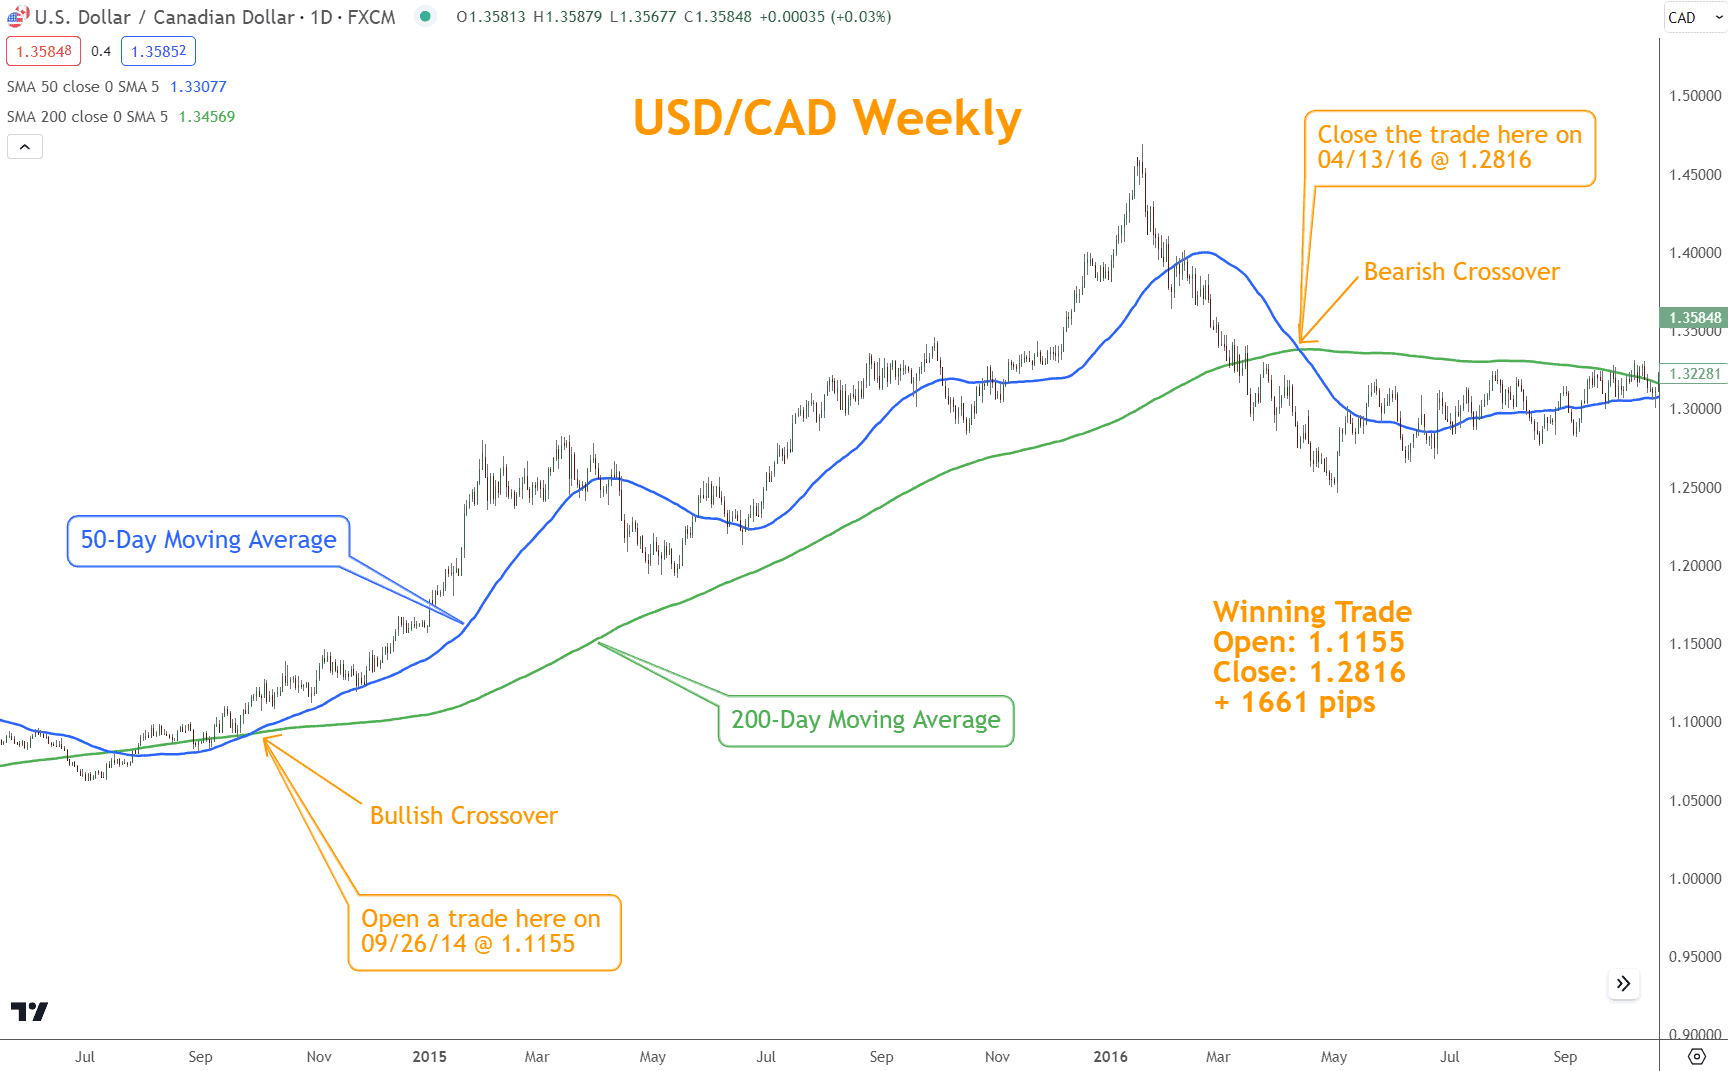
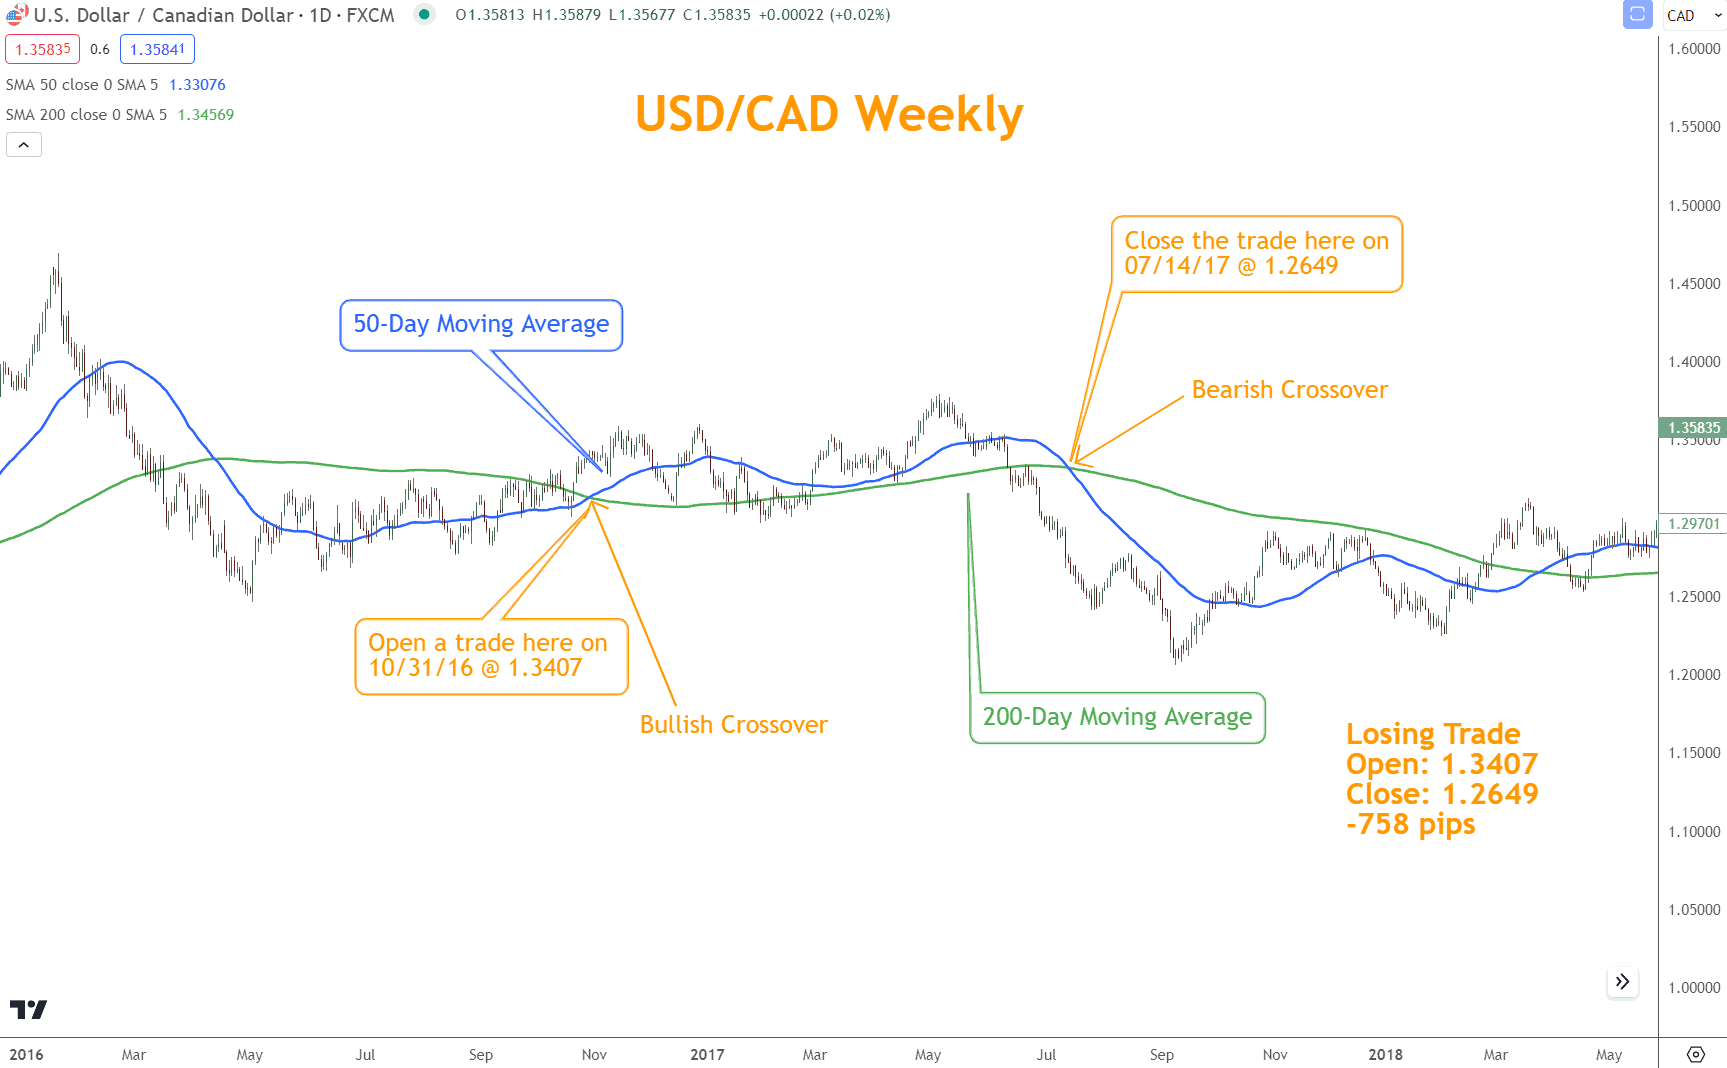
The pattern should be viewed as a potential clue, not a guarantee of a bullish outcome.
There Are Serious Limitations to This Signal
Relying solely on a Golden Cross is risky. Its most significant limitations include:
- Lagging nature: Signals appear well after the trend has started.
- False positives: Volatile markets can generate misleading crossovers.
- Lack of context: The Golden Cross doesn’t consider fundamentals, price action, or market structure.
Market conditions, momentum readings, and additional technical factors should be reviewed to validate the signal. Treat it as a tool—not a complete standalone strategy.
Looking for a Strategy?
Download the Six Basics of Chart Analysis and sign up for Forex Forecast to learn a bottom-up approach to analyzing Forex markets and weekly market updates.
Can You Improve the Golden Cross?
You can significantly improve the Golden Cross by combining it with other technical indicators. These tools help confirm whether a crossover is likely to develop into a meaningful trend.
Momentum, Candlesticks, Chart Patterns, and Support/Resistance are especially effective for filtering out false signals and improving decision-making.
Incorporate a Momentum Indicator
Momentum indicators add depth and can help determine whether a Golden Cross has real strength behind it.
Popular options include:
- Relative Strength Index (RSI)
- Stochastic Oscillator
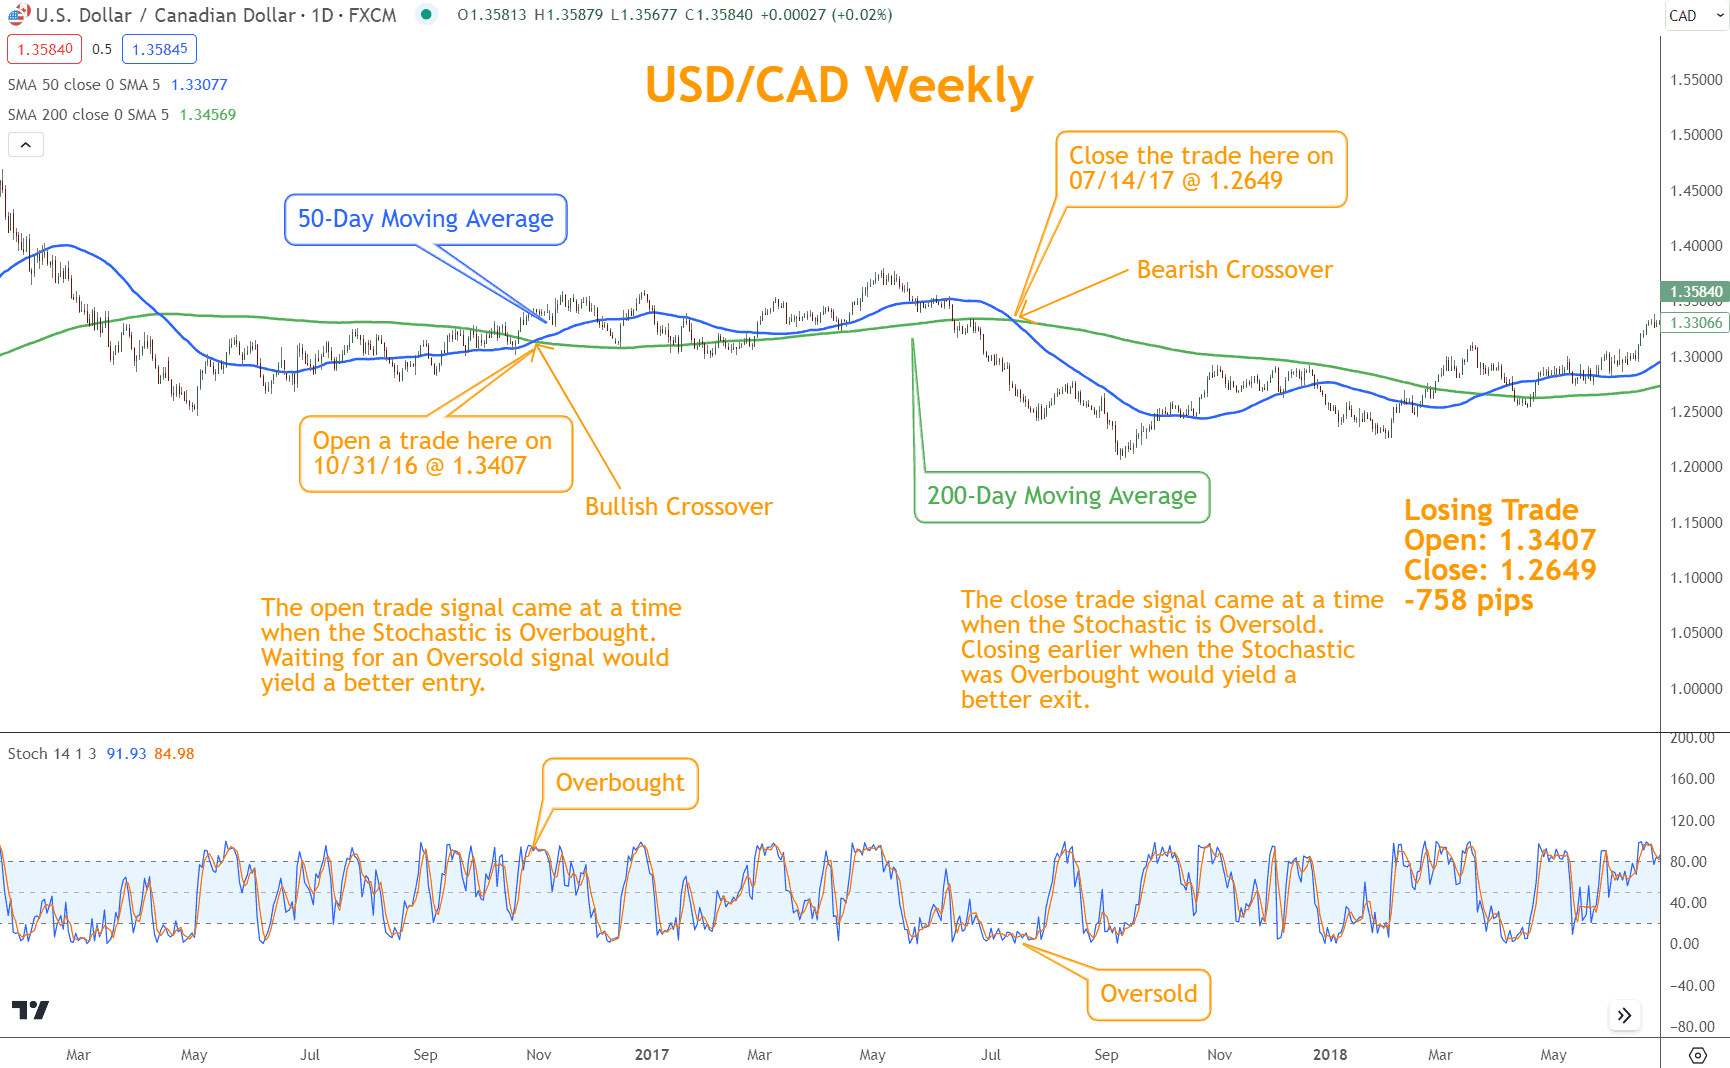
These indicators help identify Overbought and Oversold conditions, improving the probability that your entry aligns with genuine trend strength.
Japanese Candlesticks Can Foreshadow the Next Move
Candlestick patterns offer valuable clues about market psychology. When a candlestick reversal pattern aligns with a Golden Cross, the signal becomes more convincing.
Examples include:
- Bullish Hammers or Bullish Engulfing patterns confirming upward momentum
- Evening Stars or Shooting Stars suggest potential weakness and exit points
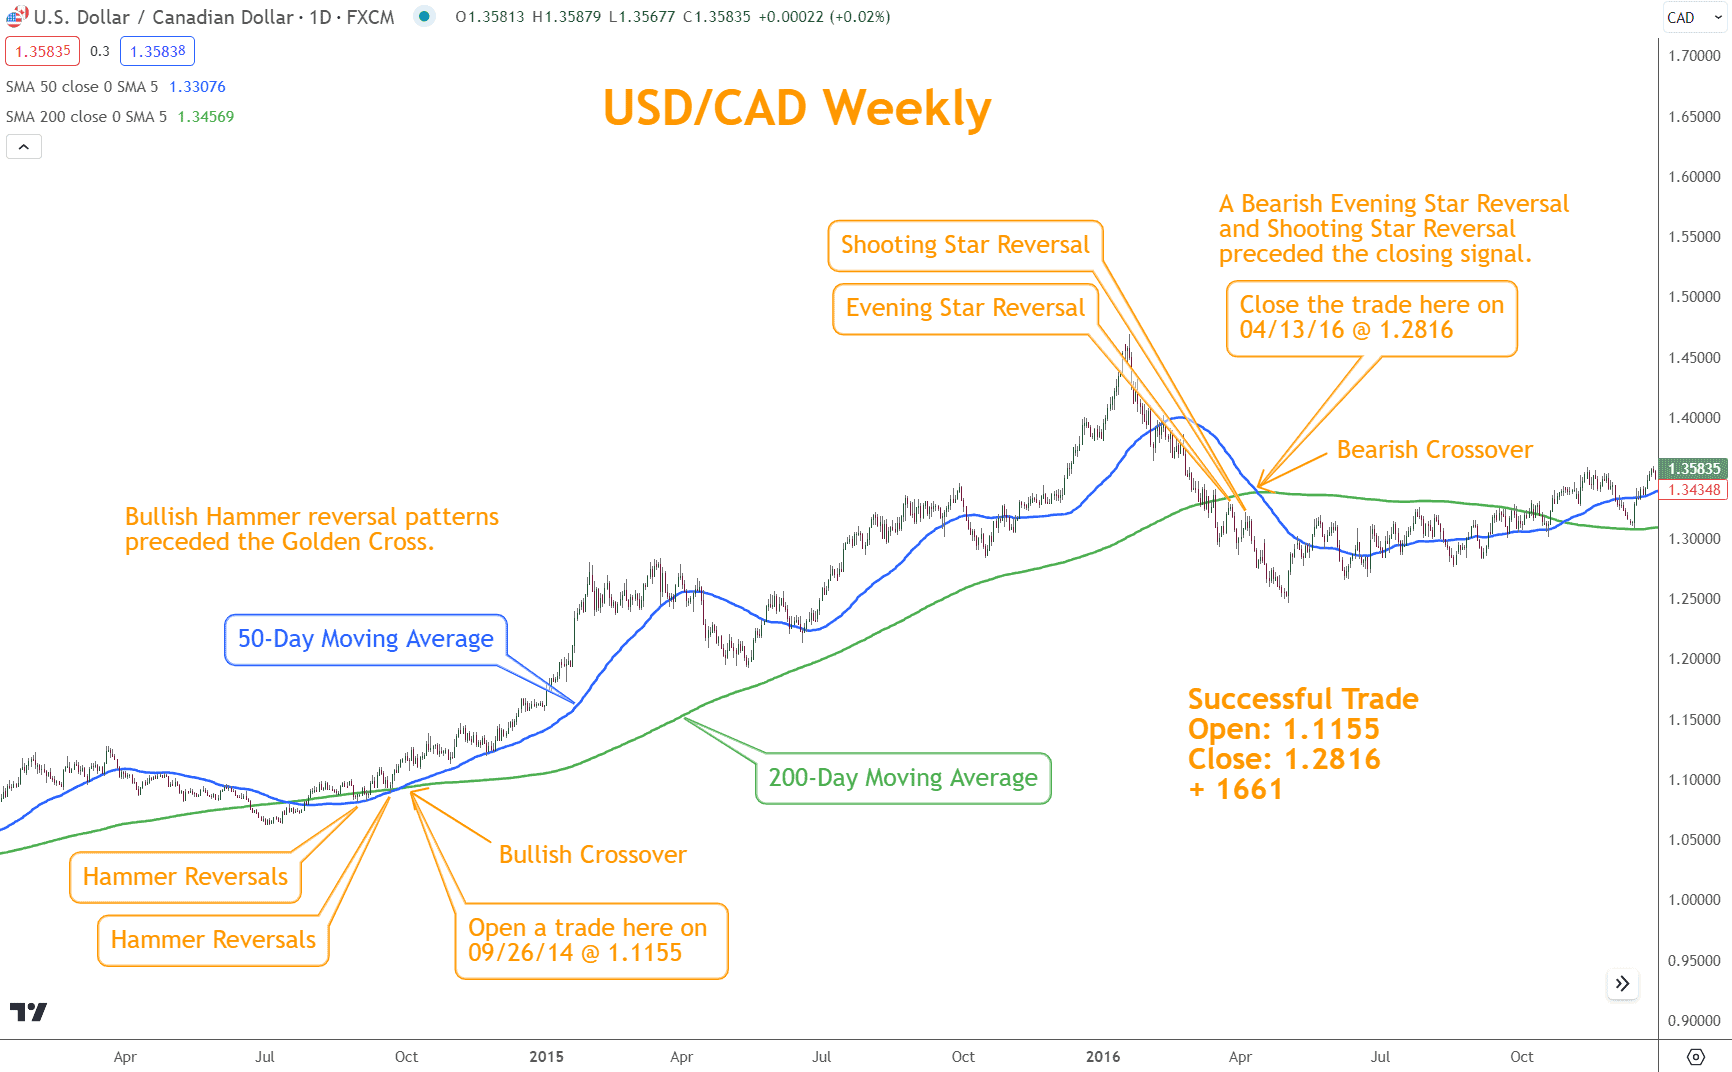
Candlesticks help you validate whether buyers are truly stepping in at the right time.
Chart Patterns Can Make It Easier
Chart Patterns can provide early indications that support the Golden Cross. Look for:
- Ascending Triangles
- Symmetrical Triangles
- Falling Wedges
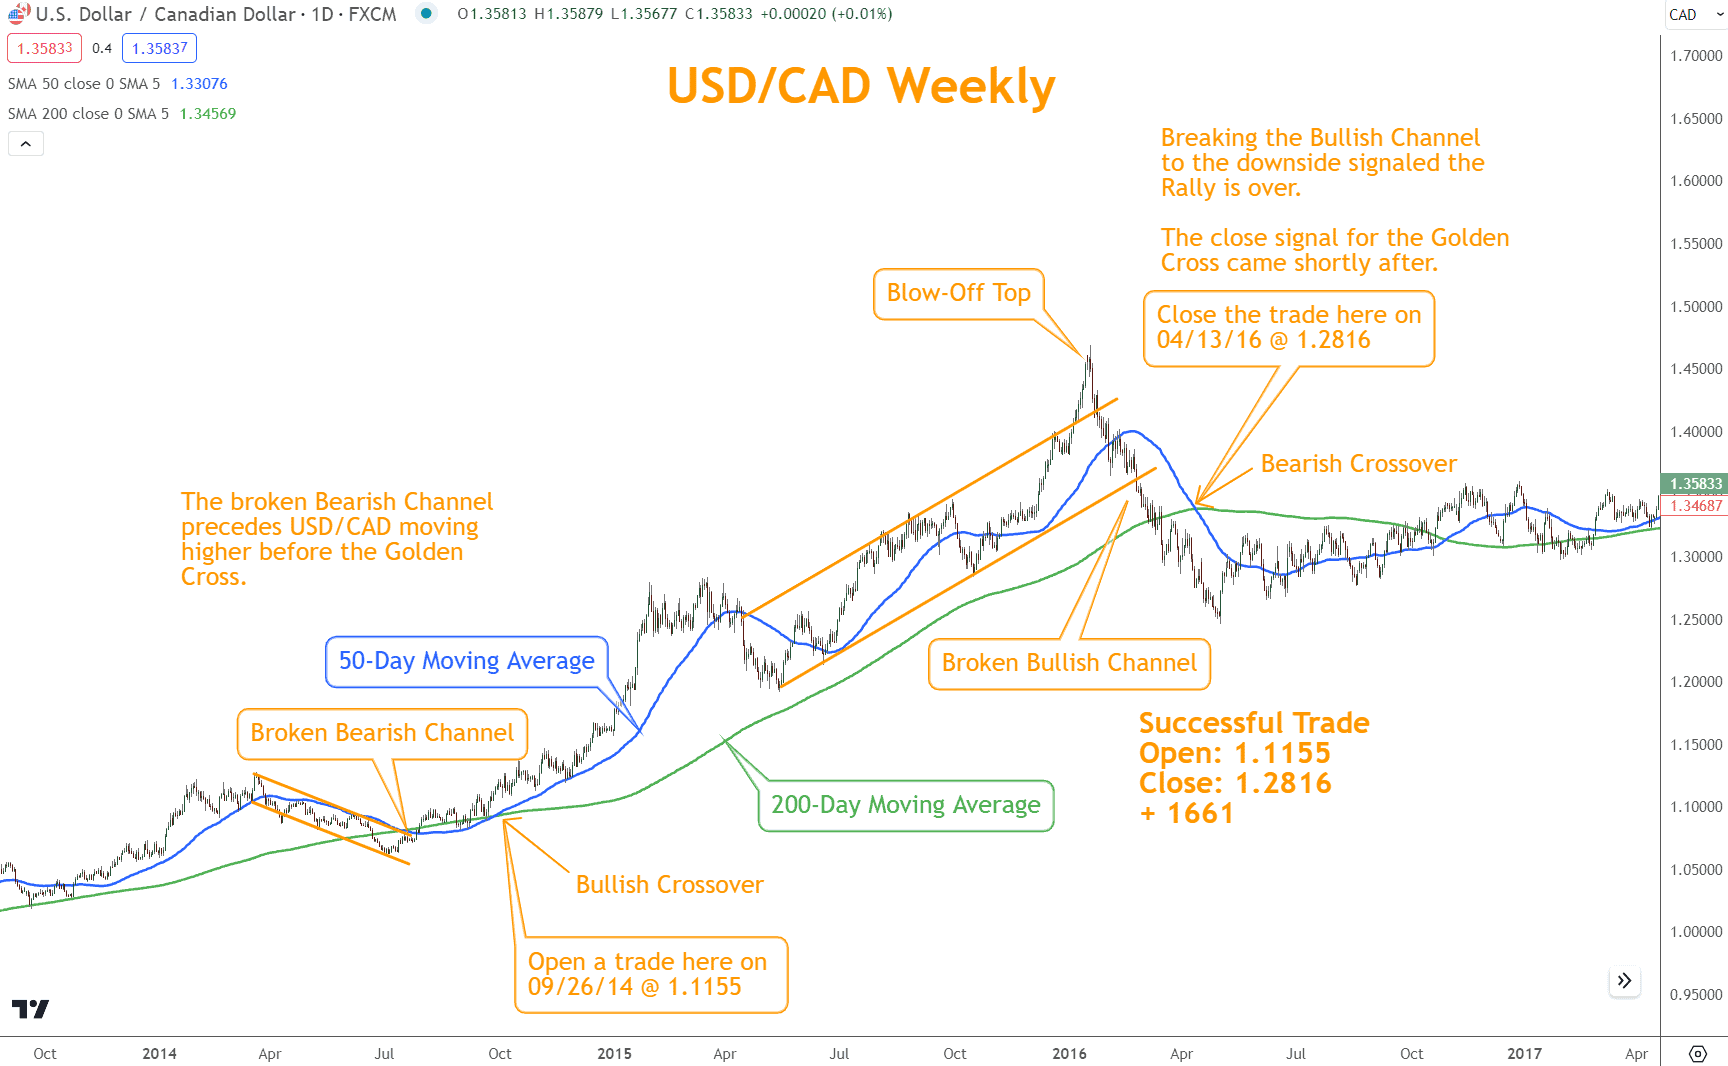
When these patterns break in the direction of the crossover, the probability of a meaningful move strengthens.
Support and Resistance Might Coincide with the Signal
Support and Resistance levels remain essential when applying this strategy.
For example:
- Bullish Cross + Support level → potential buying zone
- Resistance above the crossover → potential take-profit or exit zone
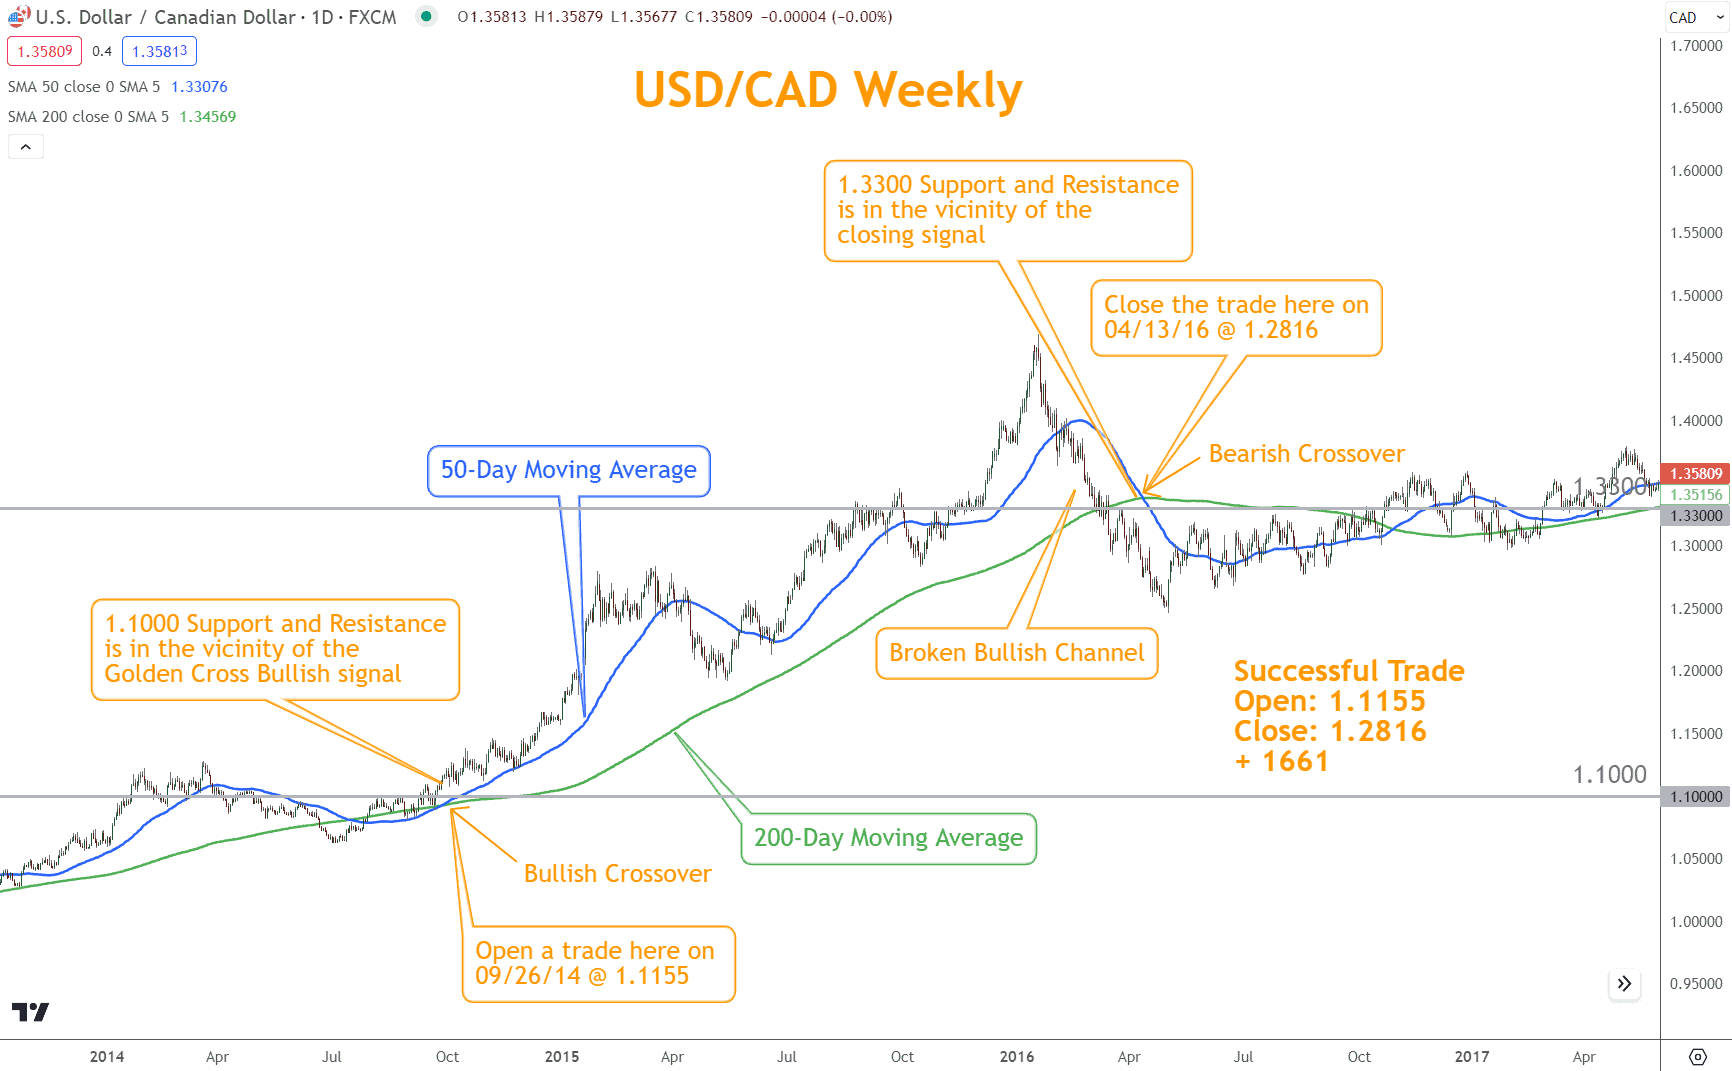
These levels help you validate whether the crossover occurs in a favorable trading environment.
Golden Cross versus Death Cross: What’s the Difference?
These signals mirror each other:
- The Golden Cross is bullish: the short-term MA crosses above the long-term MA.
- The Death Cross is bearish: the short-term MA crosses below the long-term MA.
Golden Crosses often align with Rallies and uptrends, while Death Crosses often align with Selloffs or downtrends. Both concepts rest on the principles of trend trading.
What’s the Next Step?
Choose a candlestick chart and look for a Golden Cross using the concepts you learned here.
Then, combine it with other technical tools—Momentum, Candlesticks, Chart Patterns, and Support/Resistance—to see how they interact.
If you want a structured way to analyze markets, start with the Six Basics of Chart Analysis, available for free.
When you access the Six Basics, you’ll also receive the Forex Forecast each Sunday, which includes:
- Trade ideas
- Case studies
- Technical guides and videos
- New article alerts
- PositionForex updates
- Free webinars
- Tools and members-only resources

Everything is free.
Frequently Asked Questions
What is the Golden Cross strategy, and how does it work?
It is a moving-average crossover technique. When the short-term moving average crosses above the long-term moving average, it signals potential bullish momentum.
What are the drawbacks of using the Golden Cross?
It is based on lagging historical data, can generate false signals during volatility, and does not account for real-time market conditions.
Can the Golden Cross be used with other technical tools?
Yes. Combining momentum indicators, Japanese candles, chart patterns, and support/resistance levels significantly strengthens the strategy.
Forex Trading Disclosure Statement
Risk Warning:
Forex trading involves significant risk and may not be suitable for all investors. The leveraged nature of Forex trading can work both for and against you, leading to substantial gains or losses. Before trading Forex, you should carefully consider your financial objectives, experience level, and risk tolerance. It is possible to lose more than your initial investment, and you should only trade with money you can afford to lose.
Market Risks and Volatility:
Forex markets are influenced by global economic, political, and social events, which can result in unpredictable price movements. High market volatility can lead to sudden and substantial changes in currency values, potentially causing losses that exceed your initial deposit.
Leverage Risks:
Leverage amplifies both potential gains and potential losses. While leverage can increase profitability, it also increases the risk of significant losses, including the loss of your entire trading capital.
Trading Tools and Technology Risks:
Forex trading platforms, including those offered by brokers, are subject to technology risks such as system failures, latency issues, and potential errors in price feeds. Traders should be aware that these risks can impact the execution of trades and trading outcomes.
No Guarantee of Profitability:
Past performance in Forex trading is not indicative of future results. There is no guarantee that you will achieve profits or avoid losses when trading Forex. Market conditions and individual trading strategies vary, and no trading system can eliminate the inherent risks of Forex trading.
Educational Purposes Only:
Any information provided about Forex trading, including strategies, analysis, or market commentary, is for educational purposes only and should not be considered financial advice. Consult a qualified financial advisor or tax professional before making any trading decisions.
Regulatory Compliance:
Forex trading is regulated differently in various jurisdictions. Ensure that you are trading with a licensed and compliant broker in your country of residence.
Responsibility:
You are solely responsible for your trading decisions and the associated risks. It is your duty to understand the terms and conditions of Forex trading, including margin requirements, stop-losses, and other risk management tools.
Acknowledgment:
By engaging in Forex trading, you acknowledge that you have read, understood, and accepted this disclosure statement. You accept full responsibility for the outcomes of your trading decisions and agree to trade at your own risk.