
Support and Resistance levels are essential concepts in Forex trading. They define where price is likely to pause, reverse, or accelerate—acting as psychological barriers between buyers and sellers.
Understanding these levels helps you identify opportunities, manage risk, and trade with greater precision and confidence.
This guide explains how to identify these levels using two proven methods—horizontal levels and channel lines—and how to confirm them with Momentum, Candlestick Patterns, and Chart Patterns for higher accuracy.
Quick Reference Table: Identifying Support and Resistance
| Method | How It’s Drawn | What It Reveals | Best Use Case | Confirmation Tools |
| Horizontal Levels | Draw straight lines across historical price points where reversals or consolidations occurred. | Highlights static areas of demand (Support) and supply (Resistance). | Use for setting clear entries, stop-losses, and take-profit targets. | Candlestick reversals, swing highs/lows, volume confirmation. |
| Channel Lines | Connect swing highs and swing lows to create parallel rising or falling lines. | Shows dynamic trend boundaries that reveal potential bounce or breakout zones. | Use for trend continuation setups or identifying turning points within channels. | Momentum indicators (TSI, RSI), alignment with horizontal levels. |
When combined, these two techniques reveal both static and dynamic price behavior—allowing you to anticipate reversals, confirm trends, and plan trades methodically.
TL;DR – The Two Core Methods
Mastering Support and Resistance comes down to two approaches:
- Horizontal Levels – Identify recurring zones where price consistently reacts.
- Channel Lines – Track dynamic trend boundaries to follow momentum and detect reversals.
Confirm each level with Momentum indicators and Candlestick signals to filter out false moves and improve accuracy.
Table of Contents
- TL;DR – The Two Core Methods
- What Are Support and Resistance Levels?
- How to Identify Support and Resistance in Forex Charts
- Practical Tips for Identification
- How to Apply Support and Resistance Levels in Trading
- Conclusion
- Quiz: Understanding Support and Resistance Levels
- What’s the Next Step?
- Forex Trading Disclosure Statement
What Are Support and Resistance Levels?
Support and Resistance levels form where market participants repeatedly react to the price.
A Support level is where buying pressure prevents further declines, while Resistance is where selling pressure caps upward movement.
These zones reflect the psychology of market participants—showing where traders perceive value or risk. Recognizing them enables you to anticipate market reactions before they occur.
How to Identify Support and Resistance in Forex Charts
Identifying Support and Resistance requires consistent observation and analysis.
The two most effective methods—Horizontal Levels and Channel Lines—work best when used together.
The table below outlines how each method functions and when to apply it.
| Method | How It’s Drawn | What It Reveals | Best Use Case | Confirmation Tools |
| Horizontal Levels | Draw straight lines across past reaction points where price reversed or consolidated. | Highlights where traders historically entered or exited positions. | Ideal for static Support and Resistance that mark major reaction zones. | Candlestick reversals, previous swing highs/lows, volume spikes. |
| Channel Lines | Connect multiple swing highs and lows to form parallel trend boundaries. | Shows dynamic trend behavior and potential breakout zones. | Use for trend continuation or reversal detection within channels. | TSI or RSI divergence, alignment with horizontal levels. |
Below are model examples of horizontal level and channel line support and resistance.
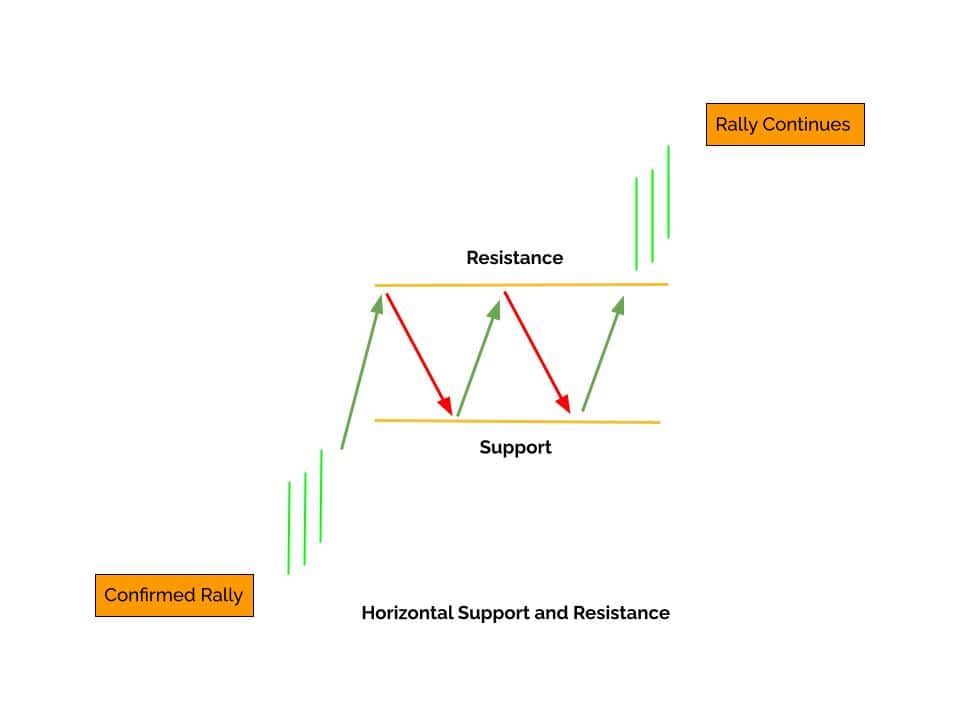
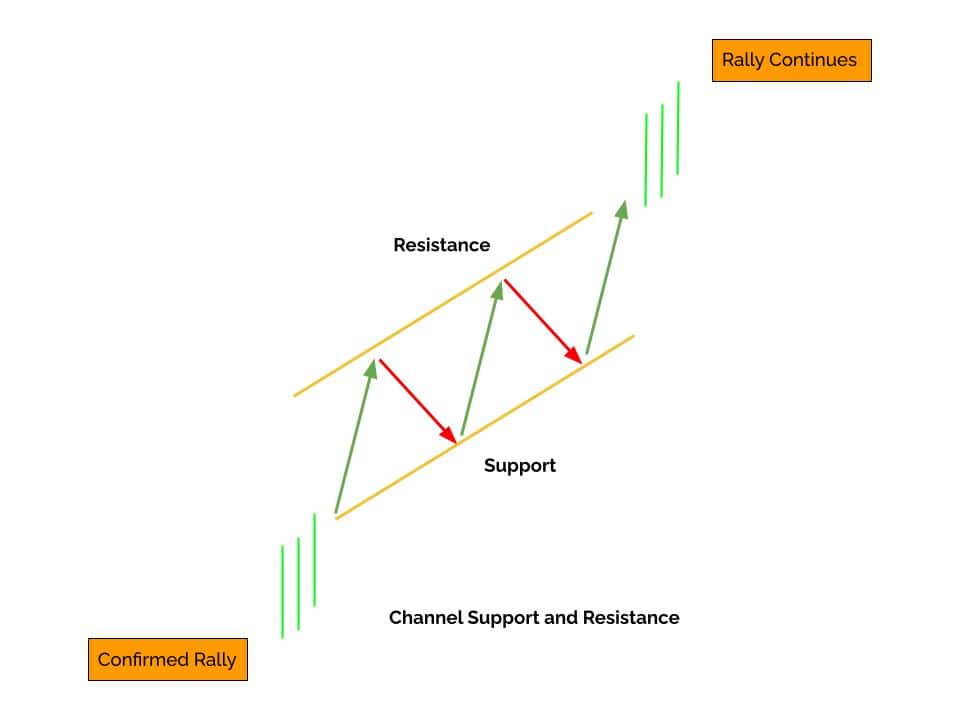
Together, these techniques help visualize the structure of market movement, giving traders a reliable roadmap for timing entries and exits.
Looking for a Strategy?
Download the Six Basics of Chart Analysis and sign up for Forex Forecast to learn a bottom-up approach to analyzing Forex markets and weekly market updates.
Practical Tips for Identification
Accurate analysis depends on confirmation and consistency. By integrating multiple technical tools, you can strengthen your findings and reduce the risk of false breakouts.
The table below summarizes the most effective methods for confirming Support and Resistance levels.
| Tool | How It Works | What It Confirms | When to Use It | Example |
| Momentum Indicators (TSI, RSI) | Measure the strength and speed of price movement to gauge buying or selling pressure. | Confirms whether market momentum supports a reaction at a level. | When the price nears a key Support or Resistance and confirmation of direction is needed. | RSI rising from oversold at Support or TSI turning down near Resistance. |
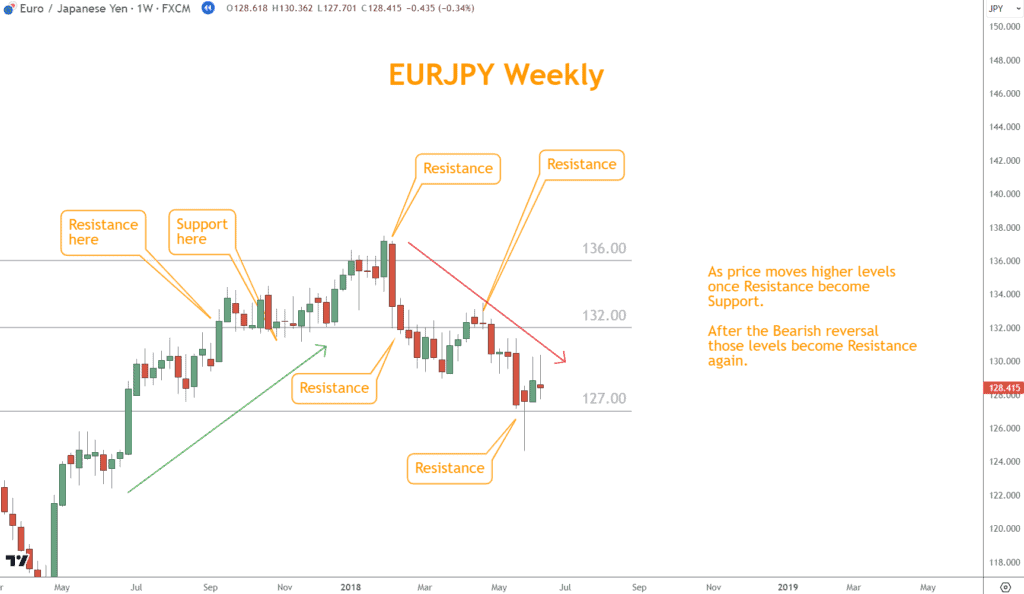
| Candlestick Patterns | Show short-term sentiment shifts through visual reversal patterns. | Validates market psychology and directional bias. | When spotting potential reversals near Support or Resistance zones. | “One Black Crow” near 136.00 Resistance or “Shooting Star” around 132.00. |
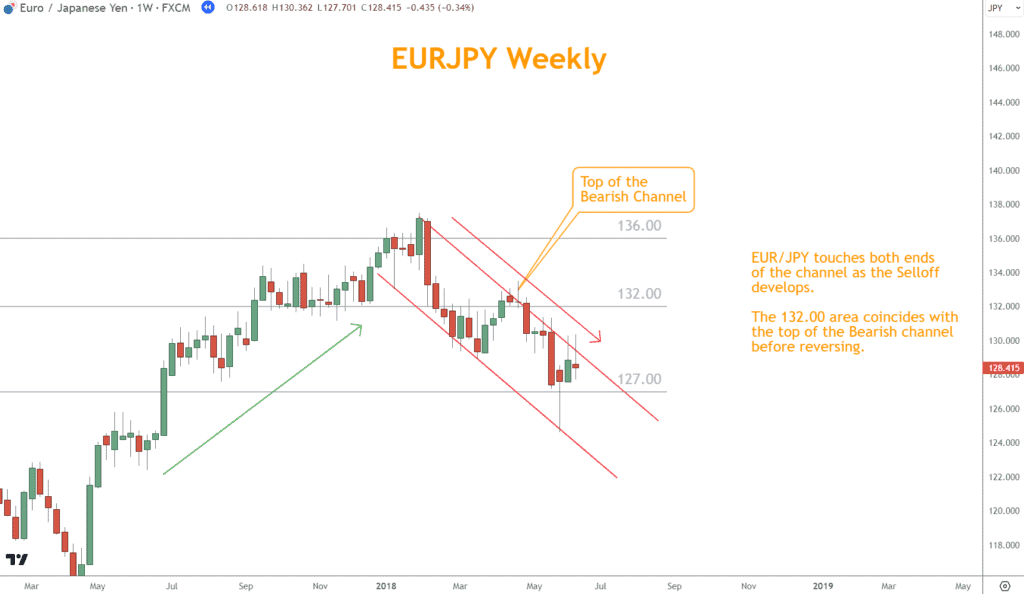
| Chart Patterns | Identify structural formations that coincide with Support and Resistance areas. | Reinforces trend direction and continuation or reversal potential. | When Support or Resistance aligns with a major pattern. | Descending Channel confirming Resistance or Double Bottom at Support. |
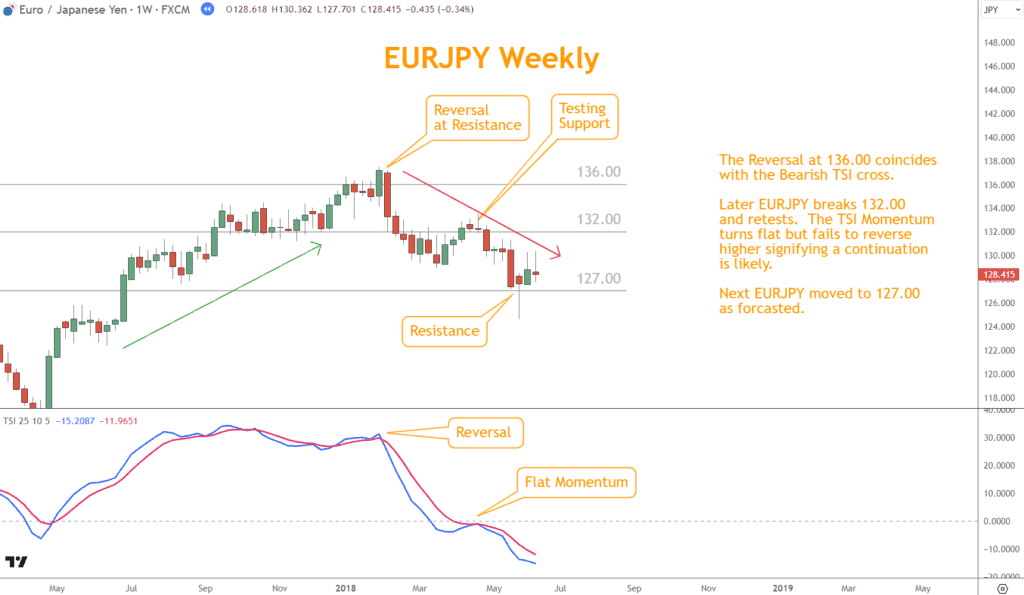
The TSI (True Strength Indicator) is an effective Momentum indicator whose actions often coincide with an instrument’s reaction to a Support or Resistance area.
Candlestick patterns often appear at Support and Resistance levels. In this example, a One Black Crow appears at the 136.00 Resistance level. An imperfect Shooting Star continues the Selloff near 132.00.
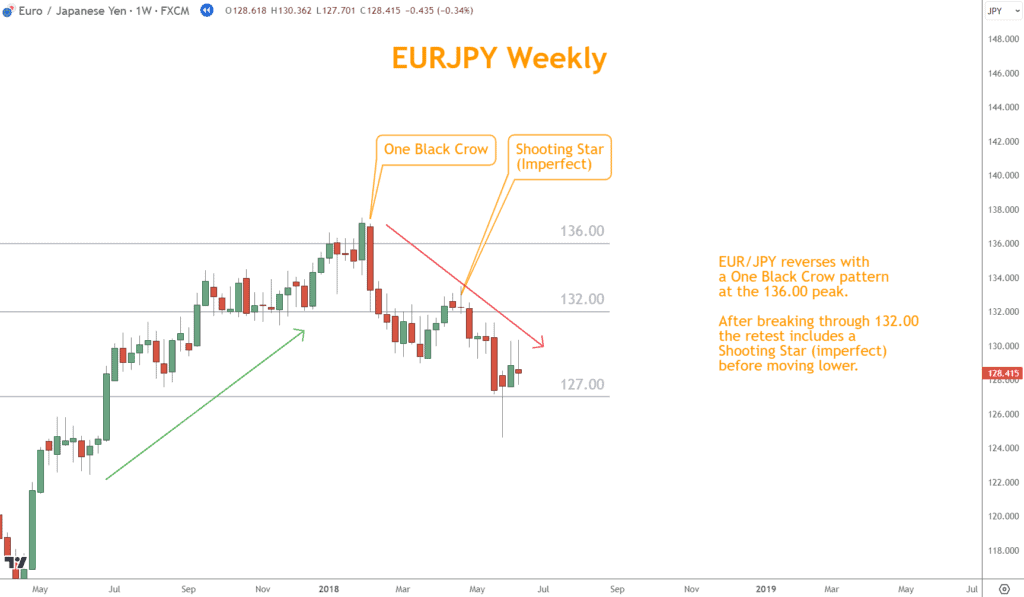
Chart Patterns often forecast reversals and coincide with critical areas, too. When the Chart Pattern is a Channel, it also provides Support and Resistance.
This cross-referencing can provide more robust confirmation of essential levels.
In addition, be cautious of false breakouts, which can mislead you into making trading mistakes.
Always wait for confirmation before entering a trade. Combining multiple signals minimizes false entries and helps you maintain a disciplined approach to analysis.
How to Apply Support and Resistance Levels in Trading
Support and Resistance levels are essential for creating structured trading plans.
They guide your decision-making for entries, stop-losses, and take-profits—helping you trade methodically and reduce emotional bias.
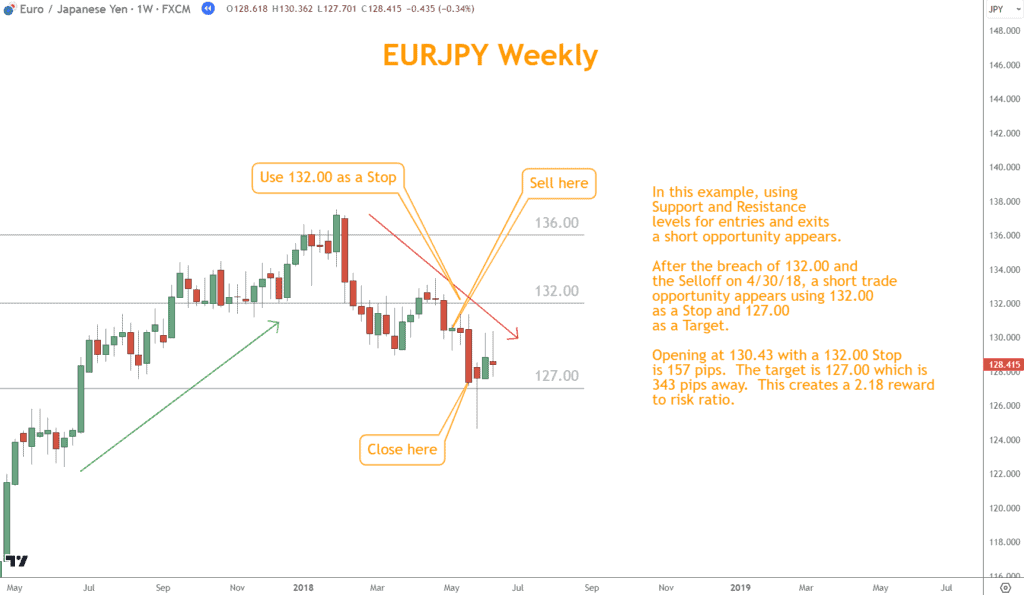
- Entries: Look for bounces or confirmed breakouts near key levels.
- Stops: Place stop-losses slightly beyond confirmed Support or Resistance.
- Targets: Use opposite levels to define logical take-profit points.
For instance, you can establish stop-loss and take-profit levels based on these Support and Resistance zones, helping you manage risk more precisely and maximize your profits.
By basing your trades on these levels, you transform observation into strategy—building consistency and discipline over time.
Conclusion
Mastering Support and Resistance levels transforms how you interpret price action.
These areas represent real market psychology—zones where traders agree or disagree on value.
By combining horizontal and channel analysis with Momentum and Candlestick confirmations, you can anticipate turning points, refine your entries, and manage risk with confidence.
Quiz: Understanding Support and Resistance Levels
1. What does a Support level represent in Forex trading?
a. A zone of selling pressure
b. A price area where buying interest prevents further decline
c. The midpoint of a trading range
d. A sign of market imbalance
2. Which method helps visualize dynamic Support and Resistance?
a. Horizontal levels only
b. Bollinger Bands
c. Channel Lines
d. Fibonacci retracements
3. What confirmation tool is most useful for validating a Resistance zone?
a. TSI Momentum Indicator
b. MACD histogram divergence
c. Japanese Candlestick reversal pattern
d. Random oscillation index
4. Why should traders confirm Support or Resistance with multiple tools?
a. To add unnecessary complexity
b. To validate levels and reduce false breakouts
c. To make charts look more advanced
d. To eliminate price volatility entirely
5. How can Support and Resistance help with trade management?
a. By predicting central bank policy decisions
b. By setting structured entries, exits, and stop levels
c. By identifying overbought market sentiment only
d. By timing economic reports
Answer Key
- b. A price area where buying interest prevents further decline
- c. Channel Lines
- c. Japanese Candlestick reversal pattern
- b. To validate levels and reduce false breakouts
- b. By setting structured entries, exits, and stop levels
What’s the Next Step?
Open a Forex chart and draw your horizontal Support and Resistance levels. Then identify channel lines in trending markets to confirm structure and momentum.
Combine these insights with Momentum, Japanese Candlestick, and Chart Pattern analysis for deeper confirmation.

For step-by-step training, download Six Basics of Chart Analysis and subscribe to Forex Forecast—delivered every Sunday with:
- Trade ideas based on the Six Basics
- Case studies from successful trades
- Educational videos and guides
- Updates and webinars from PositionForex.com
Forex Trading Disclosure Statement
Risk Warning:
Forex trading involves significant risk and may not be suitable for all investors. The leveraged nature of Forex trading can work both for and against you, leading to substantial gains or losses. Before trading Forex, you should carefully consider your financial objectives, experience level, and risk tolerance. It is possible to lose more than your initial investment, and you should only trade with money you can afford to lose.
Market Risks and Volatility:
Forex markets are influenced by global economic, political, and social events, which can result in unpredictable price movements. High market volatility can lead to sudden and substantial changes in currency values, potentially causing losses that exceed your initial deposit.
Leverage Risks:
Leverage amplifies both potential gains and potential losses. While leverage can increase profitability, it also increases the risk of significant losses, including the loss of your entire trading capital.
Trading Tools and Technology Risks:
Forex trading platforms, including those offered by brokers, are subject to technology risks, such as system failures, latency issues, and potential errors in price feeds. Traders should be aware that these risks can impact the execution of trades and trading outcomes.
No Guarantee of Profitability:
Past performance in Forex trading is not indicative of future results. There is no guarantee that you will achieve profits or avoid losses when trading Forex. Market conditions and individual trading strategies vary, and no trading system can eliminate the inherent risks of Forex trading.
Educational Purposes Only:
Any information provided about Forex trading, including strategies, analysis, or market commentary, is for educational purposes only and should not be considered financial advice. Consult a qualified financial advisor or tax professional before making any trading decisions.
Regulatory Compliance:
Forex trading is regulated differently in various jurisdictions. Ensure that you are trading with a licensed and compliant broker in your country of residence.
Responsibility:
You are solely responsible for your trading decisions and the associated risks. It is your duty to understand the terms and conditions of Forex trading, including margin requirements, stop-losses, and other risk management tools.
Acknowledgment:
By engaging in Forex trading, you acknowledge that you have read, understood, and accepted this disclosure statement. You accept full responsibility for the outcomes of your trading decisions and agree to trade at your own risk.
This disclosure is intended to provide an overview of the risks associated with Forex trading and is not exhaustive. For additional information, consult your broker and other reliable financial resources.