
Support and Resistance are among the most essential concepts in Forex trading.
They represent price areas where buying or selling pressure repeatedly causes markets to pause, reverse, or break out.
These levels are not precise lines. They are zones shaped by trader psychology, created by repeated price interaction over time. Understanding how to identify, interpret, and trade Support and Resistance correctly can dramatically improve trade entries, stop placement, and risk-reward.
This guide explains what Support and Resistance are, how to draw them accurately, why they work, and how to avoid the most common mistakes traders make.
TL;DR — Quick Summary
- Support and Resistance are price zones, not exact lines
- They work because they reflect collective trader psychology
- The best levels are tested multiple times over long timeframes
- Broken Resistance often becomes new Support (and vice versa)
- Horizontal levels, channel lines, and round numbers matter most
- Moving averages are poor substitutes for true Support/Resistance
Table of Contents
- TL;DR — Quick Summary
- Do Support and Resistance Levels Work?
- What Is Support and What Is Resistance?
- The Psychology Behind Support and Resistance
- How to Draw Support and Resistance Correctly
- Support and Resistance Are Areas — Not Lines
- Can Channel Lines Act as Support and Resistance?
- Why Round Numbers Matter
- When Resistance Becomes Support (and Vice Versa)
- Why Higher Timeframes Matter
- What’s Your Next Step?
- 5-Question Quiz
- Conclusion
- Forex Trading Disclosure Statement
Do Support and Resistance Levels Work?
Yes—support and resistance work because markets remember.
Price charts repeatedly show areas where buying or selling pressure halts price movement.
These levels matter because traders remember them and act when price returns. The more often price reacts to a level, the stronger that level becomes.
Support and resistance help traders:
- Identify high-probability reversal zones
- Set logical stop-loss levels
- Define realistic profit targets
- Avoid chasing price during breakouts
What Is Support and What Is Resistance?
Concept | Definition | Trader Behavior |
Support | A price area where buying pressure prevents further decline | Buyers step in expecting a bounce |
Resistance | A price area where selling pressure prevents further rise | Sellers step in, expecting rejection |
Support and Resistance are areas, not exact prices. Markets are noisy, and price frequently trades slightly above or below a level before reacting.
The Psychology Behind Support and Resistance
Support and Resistance exist because of herd behavior.
- Buyers place orders near prior lows they believe are “cheap”
- Sellers place orders near prior highs they think are “expensive”
- Breakouts trigger emotion, stops, and reassessment
Markets constantly test these zones. The key is patience—waiting for confirmation instead of predicting outcomes.
How to Draw Support and Resistance Correctly
Key Rules for Accurate Levels
Rule | Explanation |
Multiple touches matter | Levels tested repeatedly carry more weight |
Turning points define levels | Use swing highs and lows |
Extremes are critical | Market tops and bottoms matter most |
Context beats precision | Focus on zones, not single prices |
When drawing channel lines, connect at least two swing highs or lows. Three or more confirmations improve reliability.
Looking for a Strategy?
Download the Six Basics of Chart Analysis and sign up for Forex Forecast to learn a bottom-up approach to analyzing Forex markets and weekly market updates.
Support and Resistance Are Areas — Not Lines
Forex markets rarely respect a single price.
Candlesticks often pierce levels before reversing. This behavior is normal and reinforces why support and resistance should be treated as zones.
Traders who expect perfect reactions often get stopped out unnecessarily.
Can Channel Lines Act as Support and Resistance?
Yes. Channel lines function as dynamic support and resistance.
Channel Feature | Role |
Upper channel | Acts as Resistance in a Rally |
Lower channel | Acts as Support in a Rally |
Inverse in Selloffs | Roles flip in downtrends |
Channel lines become especially powerful when they intersect with horizontal support or resistance.
Why Round Numbers Matter
Round numbers (e.g., 1.3000, 0.6500, 111.00) attract attention because they are easy reference points.
- Institutions place orders near round numbers
- Breaks often accelerate momentum
- Retests frequently confirm validity
Always check whether a support or resistance zone aligns with a round number.
Why You Should Avoid Moving Averages for support and resistance
Moving averages are derived calculations, not market structure.
Problem | Why It Matters |
Subjective settings | Different traders see different levels |
Lagging indicator | Reacts after price moves |
Not price-based structure | Support/Resistance is built from price memory |
Moving averages may provide trend context, but are poor substitutes for true support and resistance.
When Resistance Becomes Support (and Vice Versa)
A core principle:
Broken resistance often becomes new support.
This happens because sellers reassess, buyers step in, and market psychology shifts.
Scenario | Market Behavior |
Resistance breaks | Buyers overwhelm sellers |
Retest occurs | Market validates the level |
Continuation follows | Trend resumes |
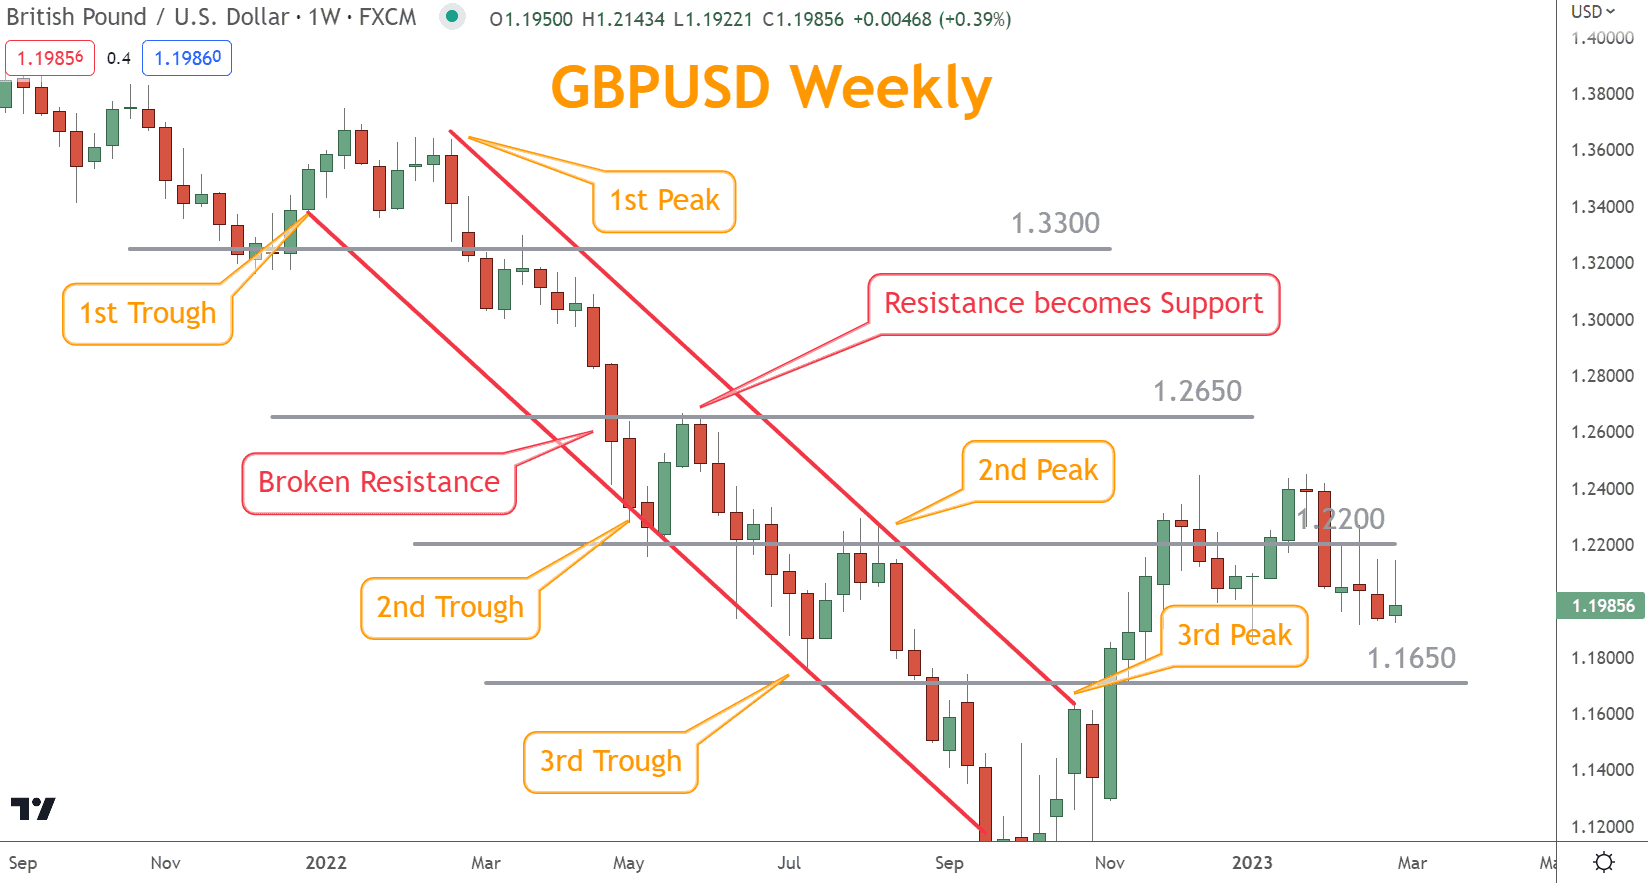
Channel lines serve as support and resistance as the price moves through the channel. An example of this is in the GBP/USD chart below.
The first resistance zone or level in this Selloff is at 1.2650, where on the week of 04/25/22, GBPUSD closed below 1.2650.
In the subsequent two sessions (in this example, weeks), GBP/USD makes new lows, enabling the creation of channel lines between troughs 1 and 2.
Before reaching 1.2200 GBP/USD, it moves higher, testing 1.2650, and is quickly rejected near its old support zone.
This price action confirms that 1.2650 is a significant, respected level for traders.
This pattern is repeated four sessions later when GBP/USD breaks 1.2200 and retests that level five sessions later.
You will find this price behavior repeated on many instruments.
Why? Many traders evaluate momentum during trading and see that market breaks of significant levels can signal overbought and oversold conditions.
As a result, they have a trading strategy designed to exploit that opportunity when it presents itself.
Technical analysts will use broken resistance areas as stop-loss levels and the next resistance level as targets.
This concept applies equally in selloffs, where broken support becomes new resistance.
Why Higher Timeframes Matter
Support and Resistance are more reliable on higher timeframes.
Timeframe | Reliability |
Weekly / Daily | High (many participants) |
Intraday (15-min) | Lower (thin participation) |
Scalping | Highest failure rate |
Lower timeframes lack the participation needed to create a durable structure.
What’s Your Next Step?
- Identify major support and resistance on daily or weekly charts
- Add channel lines and look for confluence
- Observe how price reacts, not how fast it moves
- Combine levels with Candlesticks, Momentum, and Trend

If you want a structured process, download the Six Basics of Chart Analysis and receive the free weekly Forex Forecast every Sunday.
5-Question Quiz
Questions
- Support and Resistance levels work primarily because of:
A. Mathematical formulas
B. Market psychology and memory
C. Broker algorithms
D. Moving averages - Support and Resistance should be treated as:
A. Exact prices
B. Trend indicators
C. Fixed numbers
D. Price zones - What strengthens a Support or Resistance level the most?
A. Indicator crossovers
B. One sharp rejection
C. Multiple price tests
D. Tight stop-loss placement - When Resistance breaks, it most often becomes:
A. A false signal
B. Market noise
C. New Resistance
D. New Support - Which timeframe produces the most reliable Support and Resistance?
A. 5-minute
B. 15-minute
C. Daily or Weekly
D. Tick charts
Answer Key
- B
- D
- C
- D
- C
Conclusion
Support and Resistance are foundational tools that reveal where traders are most likely to act.
When drawn correctly and combined with Trend, Momentum, and Candlesticks, they provide clarity, structure, and discipline. Traders who respect these zones gain better entries, smarter stops, and higher-probability trades.
Forex Trading Disclosure Statement
Risk Warning:
Forex trading involves significant risk and may not be suitable for all investors. The leveraged nature of Forex trading can work both for and against you, leading to substantial gains or losses. Before trading Forex, you should carefully consider your financial objectives, experience level, and risk tolerance. It is possible to lose more than your initial investment, and you should only trade with money you can afford to lose.
Market Risks and Volatility:
Forex markets are influenced by global economic, political, and social events, which can result in unpredictable price movements. High market volatility can lead to sudden and substantial changes in currency values, potentially causing losses that exceed your initial deposit.
Leverage Risks:
Leverage amplifies both potential gains and potential losses. While leverage can increase profitability, it also increases the risk of significant losses, including the loss of your entire trading capital.
Trading Tools and Technology Risks:
Forex trading platforms, including those offered by brokers, are subject to technology risks, such as system failures, latency issues, and potential errors in price feeds. Traders should be aware that these risks can impact the execution of trades and trading outcomes.
No Guarantee of Profitability:
Past performance in Forex trading is not indicative of future results. There is no guarantee that you will achieve profits or avoid losses when trading Forex. Market conditions and individual trading strategies vary, and no trading system can eliminate the inherent risks of Forex trading.
Educational Purposes Only:
Any information provided about Forex trading, including strategies, analysis, or market commentary, is for educational purposes only and should not be considered financial advice. Consult a qualified financial advisor or tax professional before making any trading decisions.
Regulatory Compliance:
Forex trading is regulated differently in various jurisdictions. Ensure that you are trading with a licensed and compliant broker in your country of residence.
Responsibility:
You are solely responsible for your trading decisions and the associated risks. It is your duty to understand the terms and conditions of Forex trading, including margin requirements, stop-losses, and other risk management tools.
Acknowledgment:
By engaging in Forex trading, you acknowledge that you have read, understood, and accepted this disclosure statement. You accept full responsibility for the outcomes of your trading decisions and agree to trade at your own risk.
This disclosure is intended to provide an overview of the risks associated with Forex trading and is not exhaustive. For additional information, consult your broker and other reliable financial resources.