
The Stochastic Indicator is one of the most popular momentum oscillators in Forex trading.
It helps traders identify overbought and oversold conditions, gauge market momentum, and anticipate potential reversals.
When combined with other tools like trend analysis, candlestick patterns, chart patterns, and support/resistance, the Stochastic Indicator becomes a powerful confirmation tool that filters out false signals and improves the accuracy of trade setups.
This guide explains:
- How the Stochastic Indicator works
- How to interpret its signals (overbought/oversold, signal line crosses, divergence)
- Four ways to integrate it with other tools
- The limitations of relying solely on Stochastic
Quick Reference: Stochastic Indicator
| Aspect | Details |
| Indicator Type | Momentum oscillator |
| Default Settings | %K = 14, %K smoothing = 1, %D = 3 |
| Slow Stochastic | %K = 5, %K smoothing = 3, %D = 3 (commonly used) |
| Key Signals | Overbought/oversold, %K/%D crosses, divergences |
| Best Used With | Trend analysis, candlestick patterns, chart patterns, support/resistance |
| Main Limitation | Generates false signals in choppy or strongly trending markets |
TL;DR – Master the Stochastic Indicator
This article teaches you how to trade with the Stochastic Indicator by focusing on four areas:
- Identifying overbought and oversold conditions
- Watching for %K/%D signal line crosses
- Spotting bullish and bearish divergence
- Combining Stochastic with trend analysis, candlesticks, chart patterns, and support/resistance
You’ll also learn the limitations of Stochastic and why it should always be used with other forms of analysis.
Table of Contents
- TL;DR – Master the Stochastic Indicator
- How the Stochastic Indicator Works
- How to Interpret Stochastic Indicator Signals
- 4 Tips for Mastering Stochastic with Other Tools
- Limitations of the Stochastic Indicator
- Conclusion
- What’s the Next Step?
- Quiz: Understanding the Stochastic Indicator in Forex
- Forex Trading Disclosure Statement
How the Stochastic Indicator Works
The Stochastic Indicator measures momentum by comparing a closing price to the highest high and lowest low over a set period.
- In uptrends: closing prices cluster near the high of the range.
- In downtrends: closing prices cluster near the low of the range.
Key components:
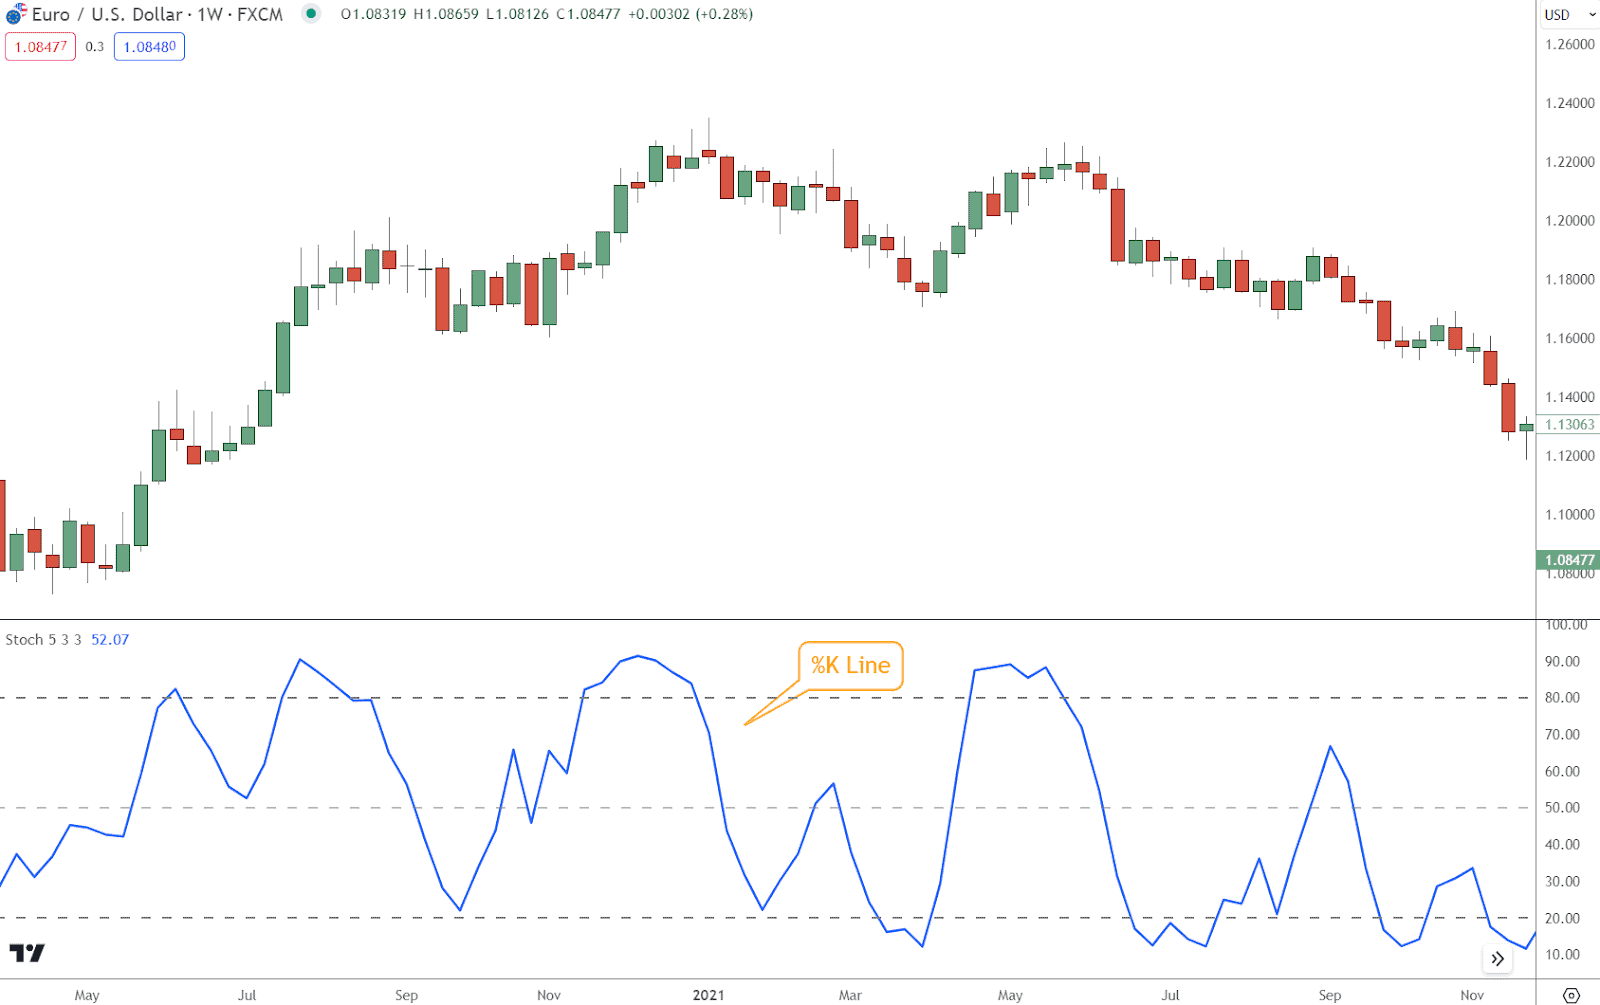
- %K line: raw value showing where the close sits within the range.
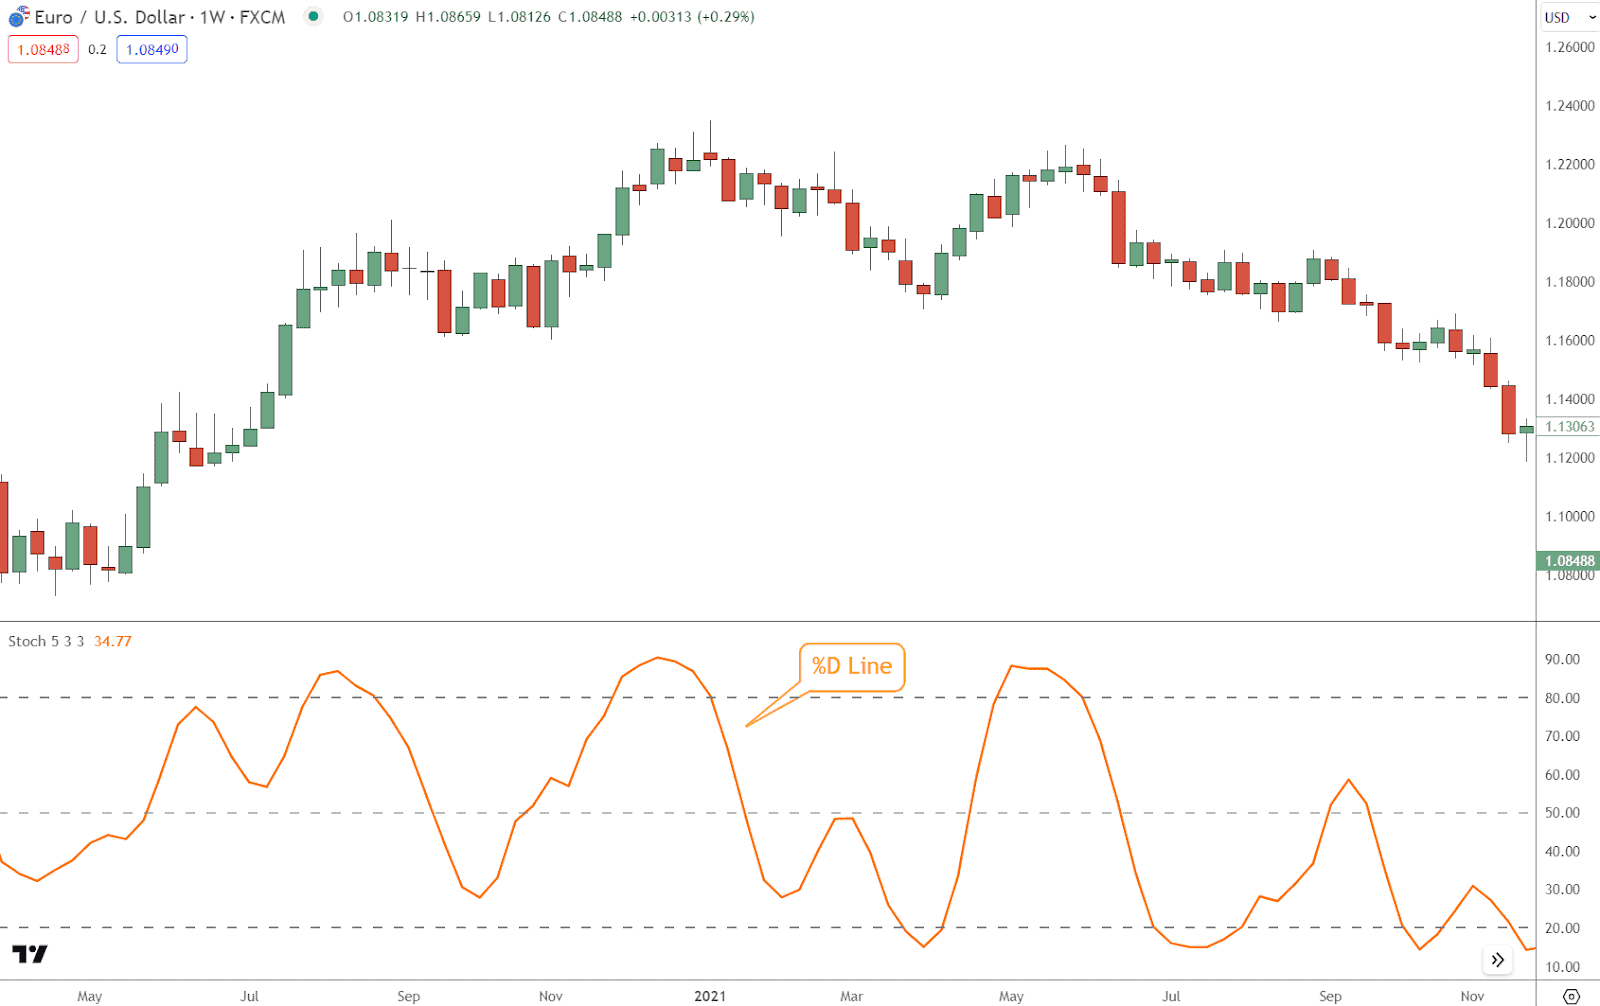
- %D line: moving average of %K, smoothing out short-term noise.
Readings fluctuate between 0 and 100:
- High values = strong bullish momentum.
- Low values = bearish momentum.
The Slow Stochastic settings (%K = 5, smoothing = 3, %D = 3) are often preferred to reduce false signals.
The %K line represents the current closing price’s position relative to the highest high and lowest low over a set period.
The %D line is a moving average of the %K line and appears smoother on the indicator chart.
How to Interpret Stochastic Indicator Signals
Understanding Stochastic signals is the foundation for using this tool effectively.
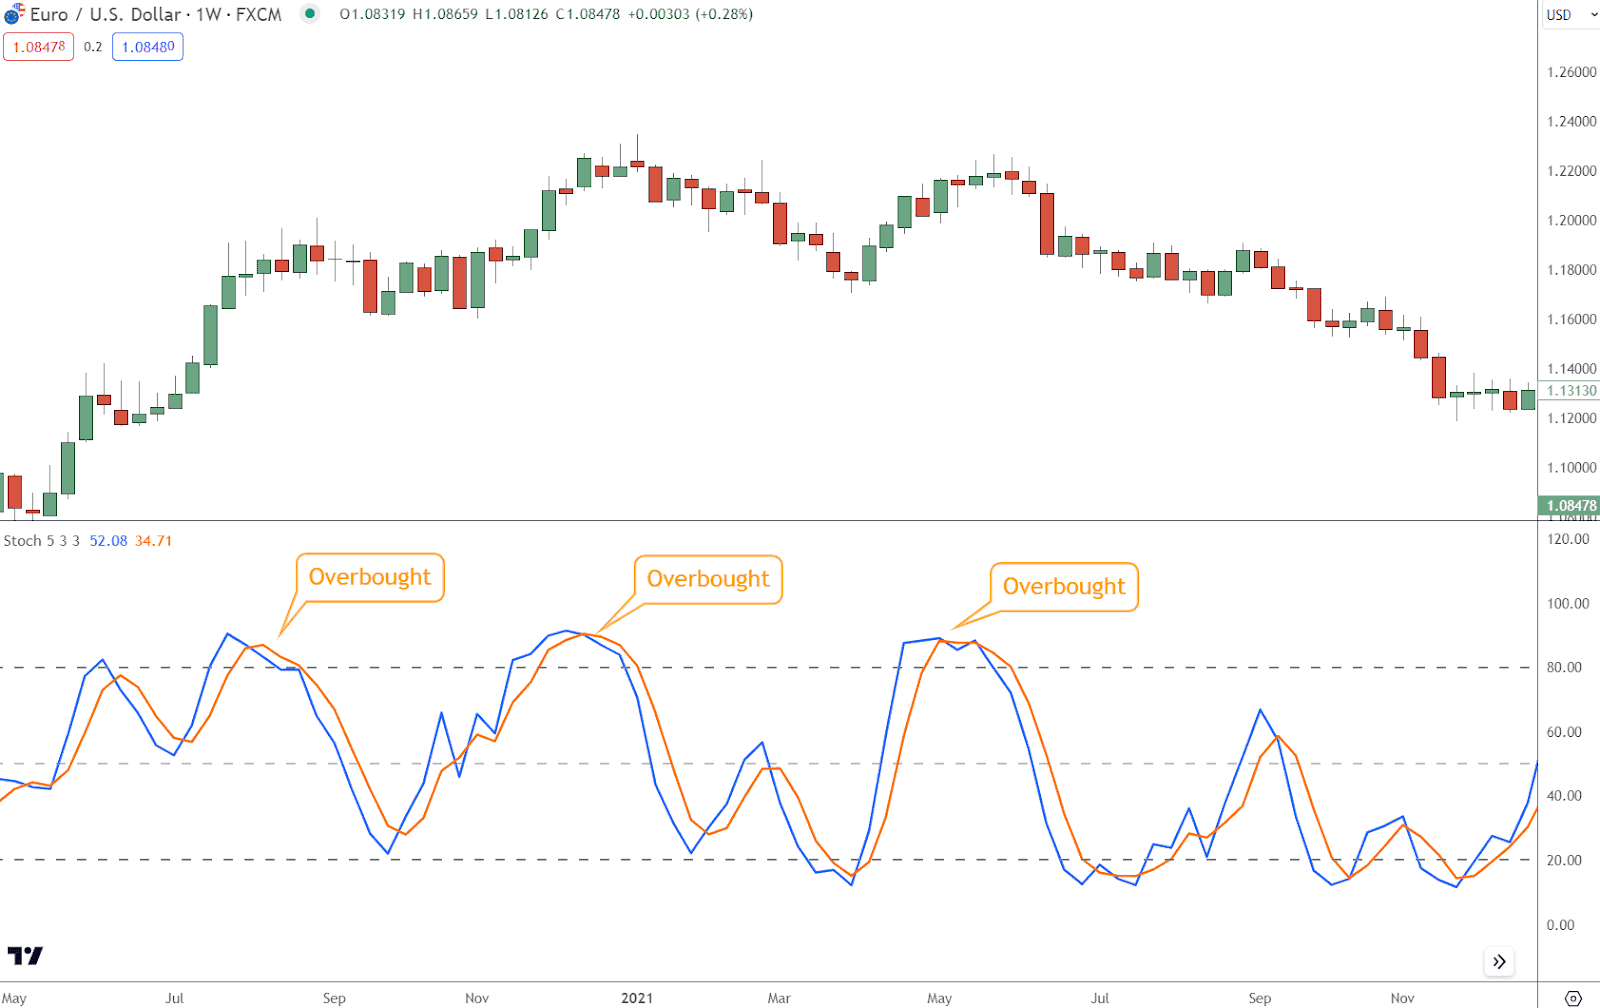
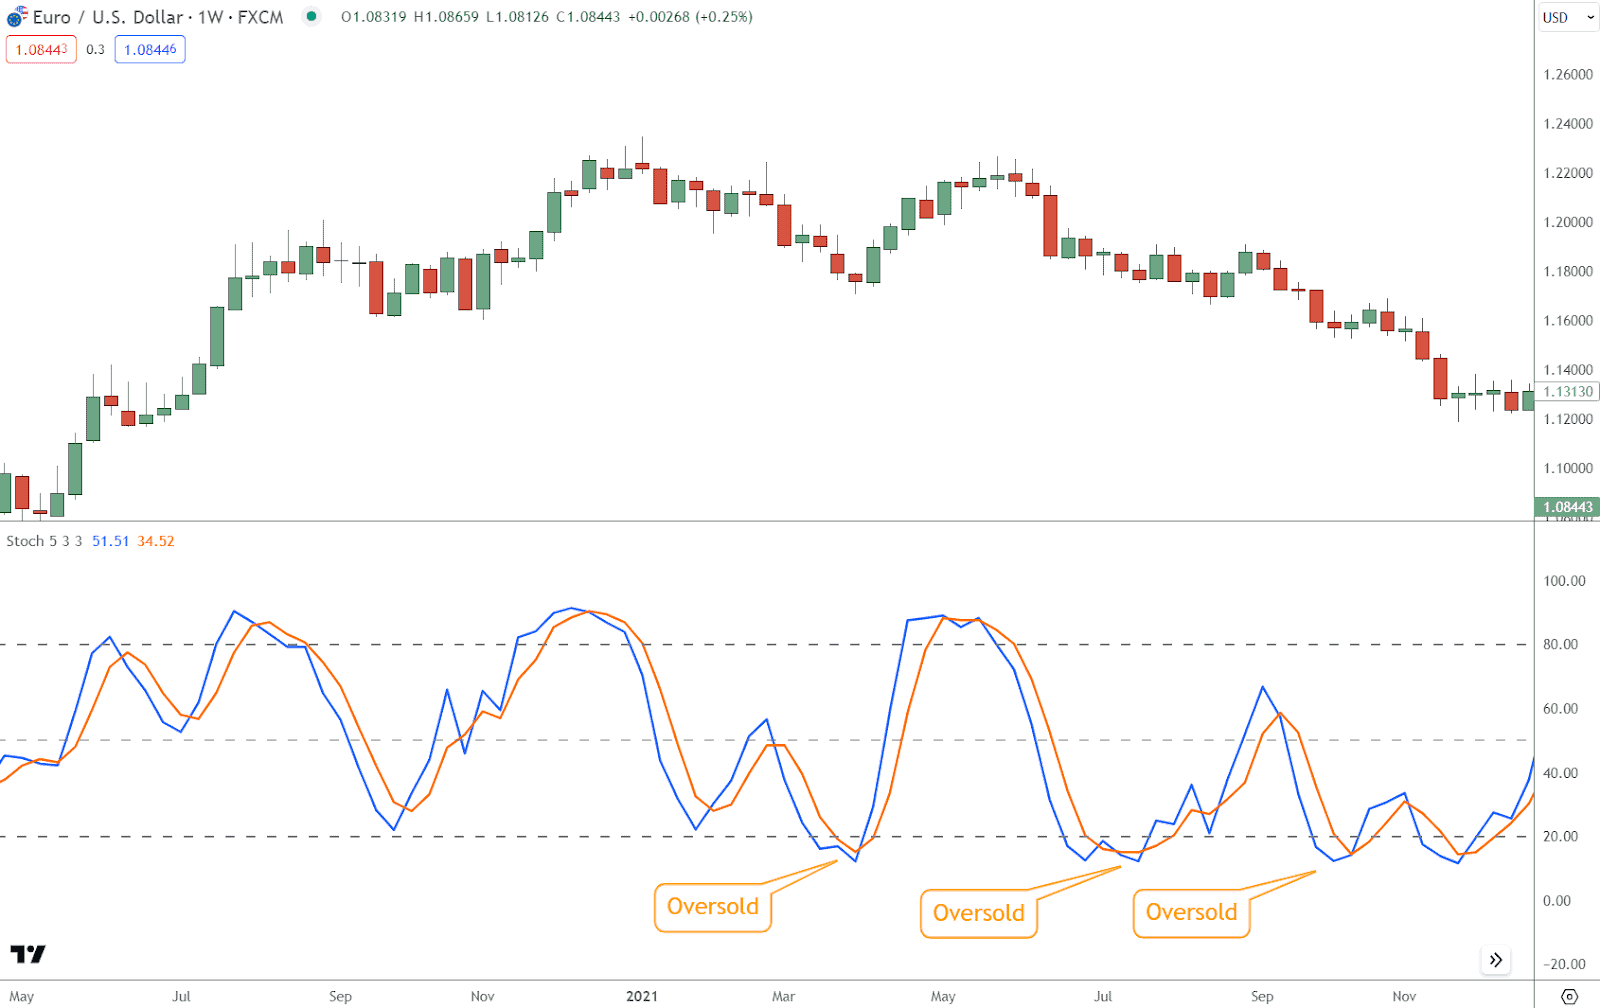
Overbought and Oversold Conditions
- Overbought (>80): signals strong buying pressure, risk of reversal or pullback.
- Oversold (<20): signals strong selling pressure, potential for rebound.
Use these zones to plan profit-taking, reversals, or tighter stop-losses.
This condition suggests that the market may be overbought, and a price reversal or corrective pullback could be imminent.
View overbought conditions as opportunities to consider taking profits on long positions or potentially initiating short positions.
This condition indicates that the market may be oversold, and a price rebound or reversal could be on the horizon.
Interpret oversold conditions as potential opportunities to enter long positions or tighten stop-loss orders on existing short positions.
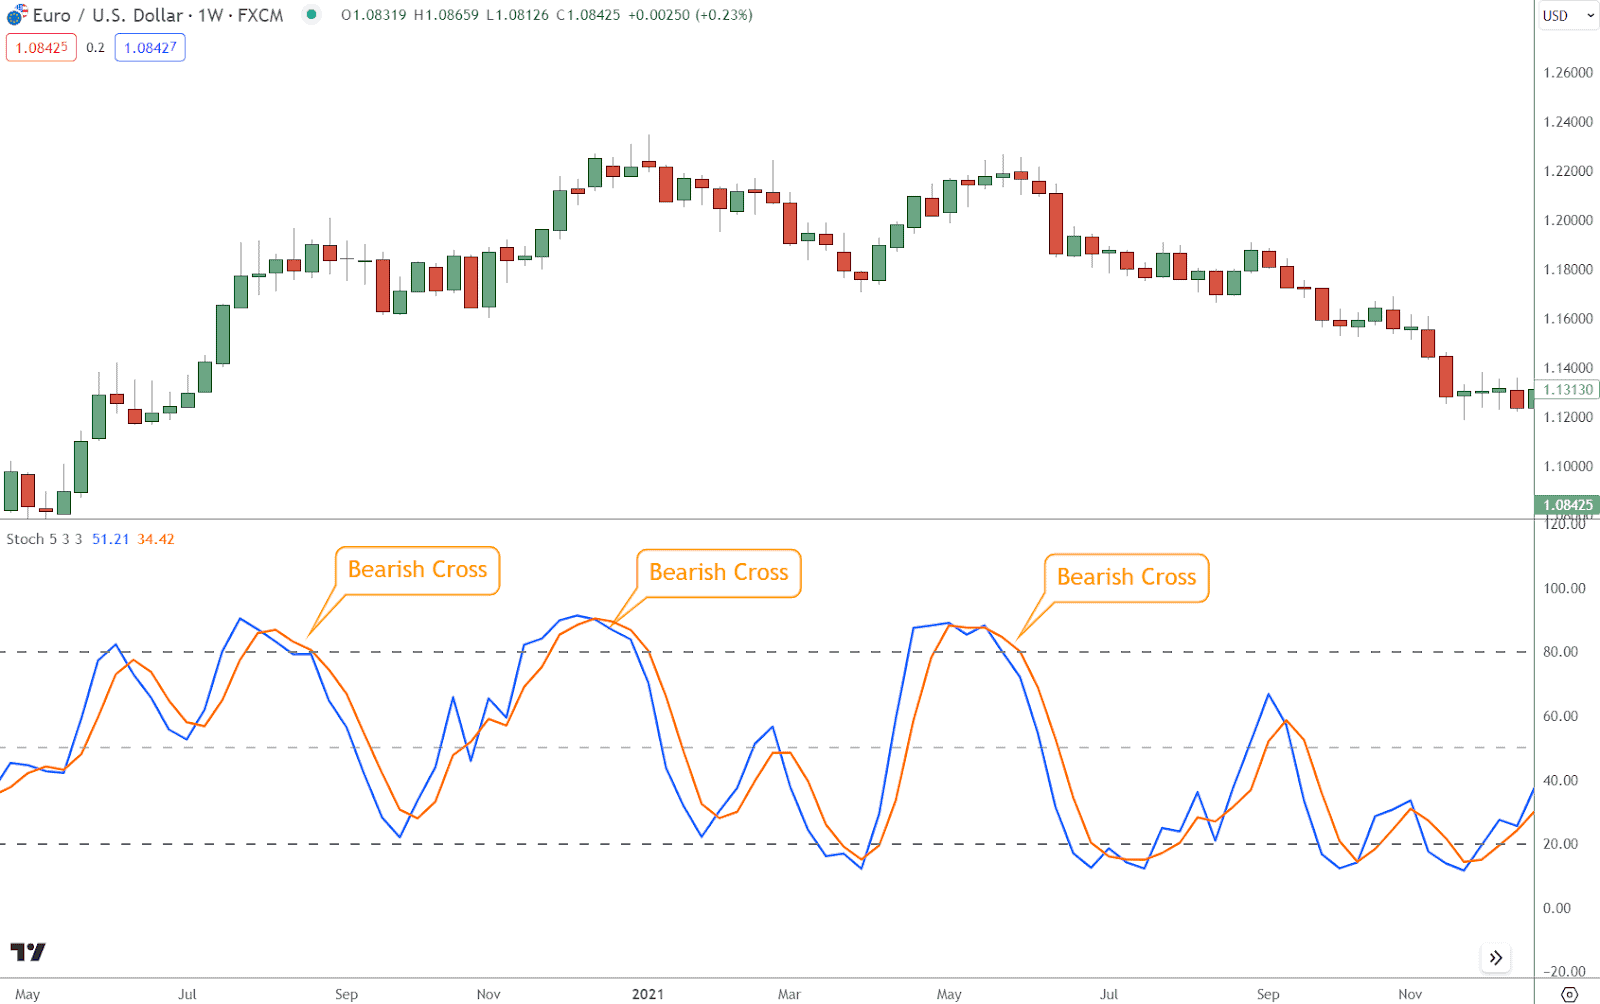
Signal Line Crosses
The signal line crosses play a pivotal role in Stochastic analysis, providing clear indications of shifts in market momentum.
- Bullish cross: %K moves above %D → potential upward move.
- Bearish cross: %K moves below %D → potential downward move.
Crosses are best when confirmed with trend direction or other tools.
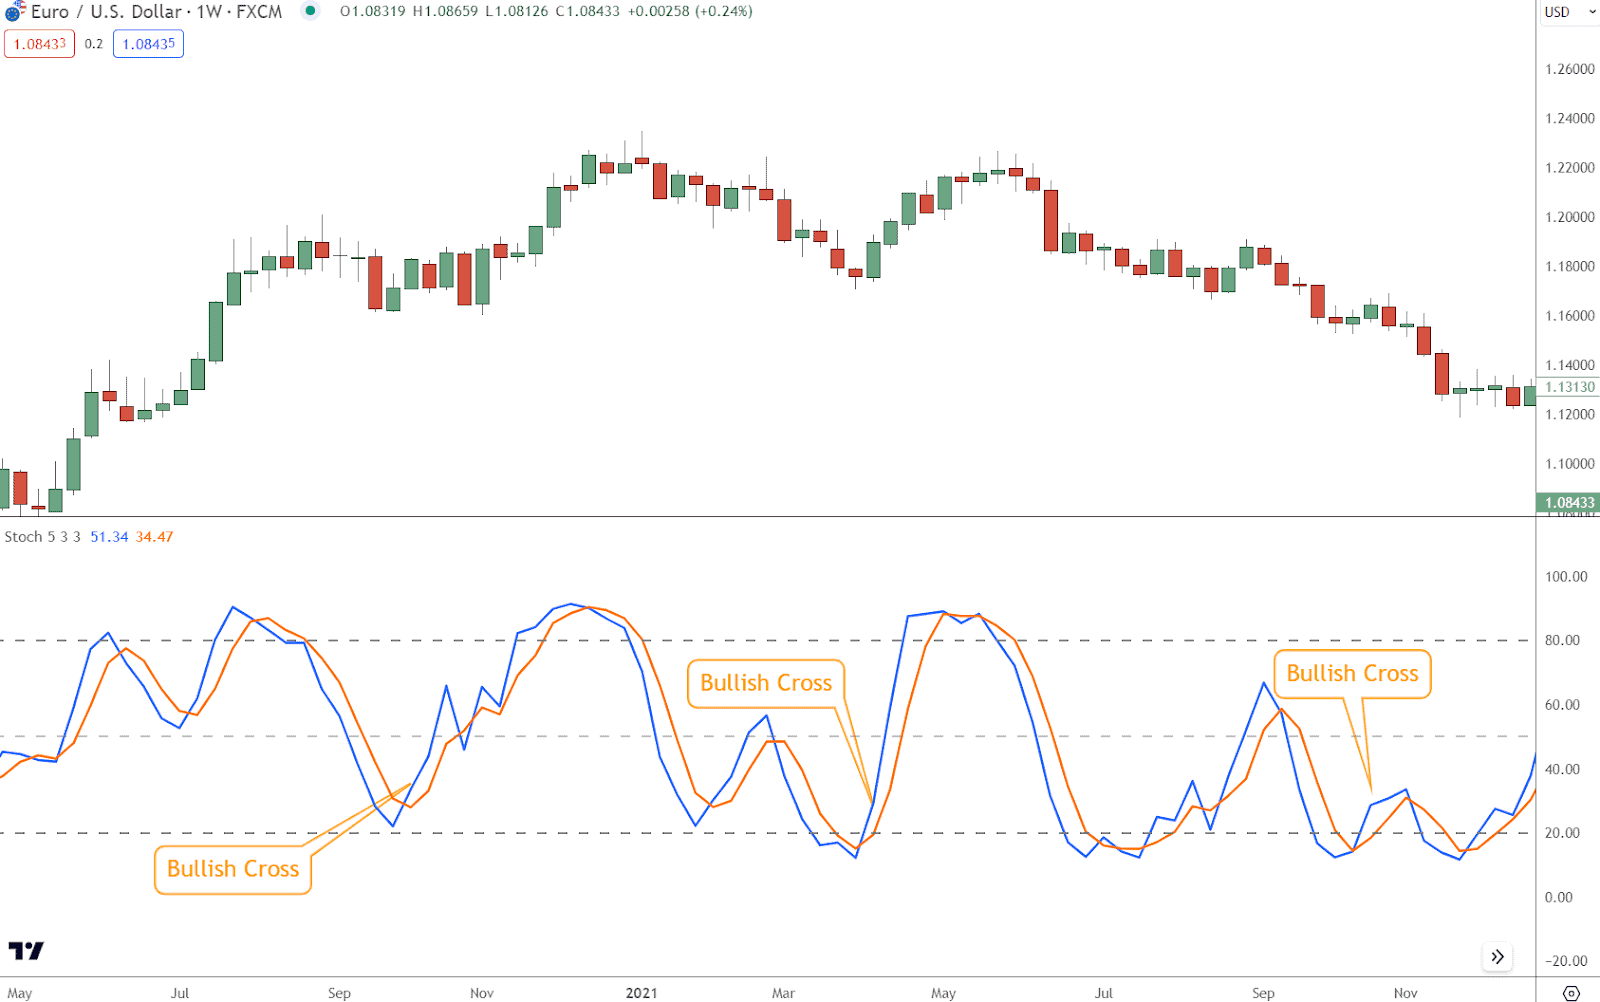
Interpret bullish signal line crosses as opportunities to enter long positions or add to existing ones, anticipating continued upward momentum.
Divergence
The divergence between price action and the indicator can offer valuable insights into potential trend reversals.
- Bullish divergence: price makes lower lows, but Stochastic makes higher lows → reversal upward likely.
- Bearish divergence: price makes higher highs, but Stochastic makes lower highs → reversal downward likely.
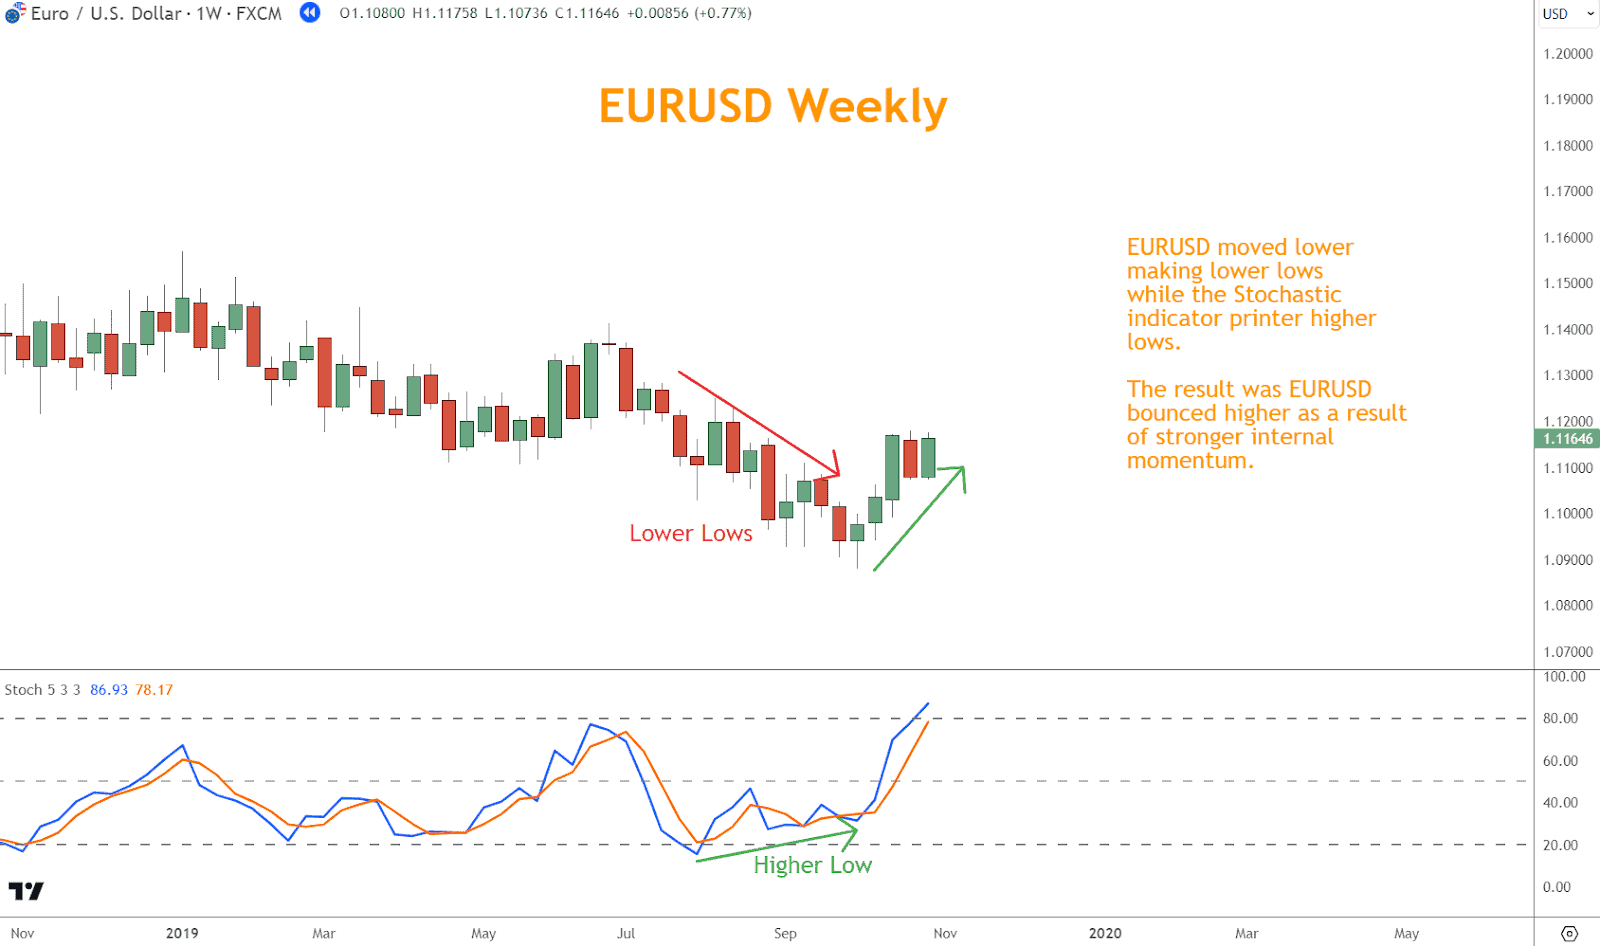
Interpret bullish divergence as a potential precursor to a bullish reversal, considering it an opportunity to enter long positions or tighten stop-loss orders on short positions.
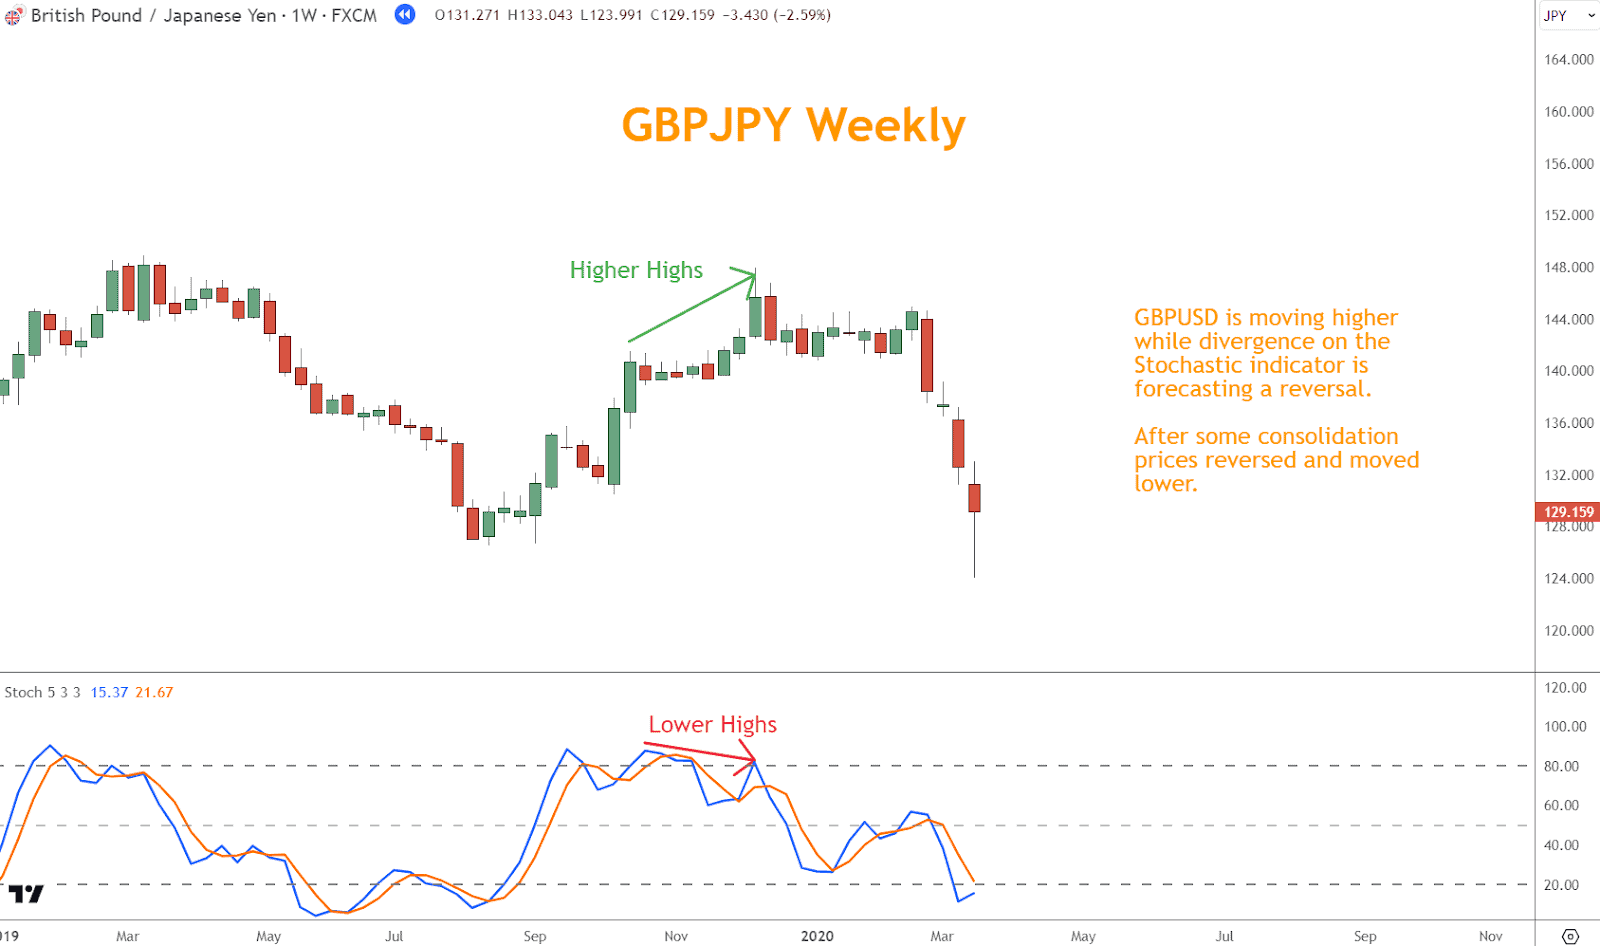
View bearish divergence as a warning sign for a bearish reversal, considering it an opportunity to enter short positions or tighten stop-losses on long positions.
Looking for a Strategy?
Download the Six Basics of Chart Analysis and sign up for Forex Forecast to learn a bottom-up approach to analyzing Forex markets and weekly market updates.
4 Tips for Mastering Stochastic with Other Tools
Using Stochastic alone leads to false signals. Pairing it with other methods strengthens trading accuracy.
1. Combine with Trend Analysis
- In an uptrend, use oversold signals (<20) as long-entry points.
- In a downtrend, use overbought signals (>80) as short-entry points.
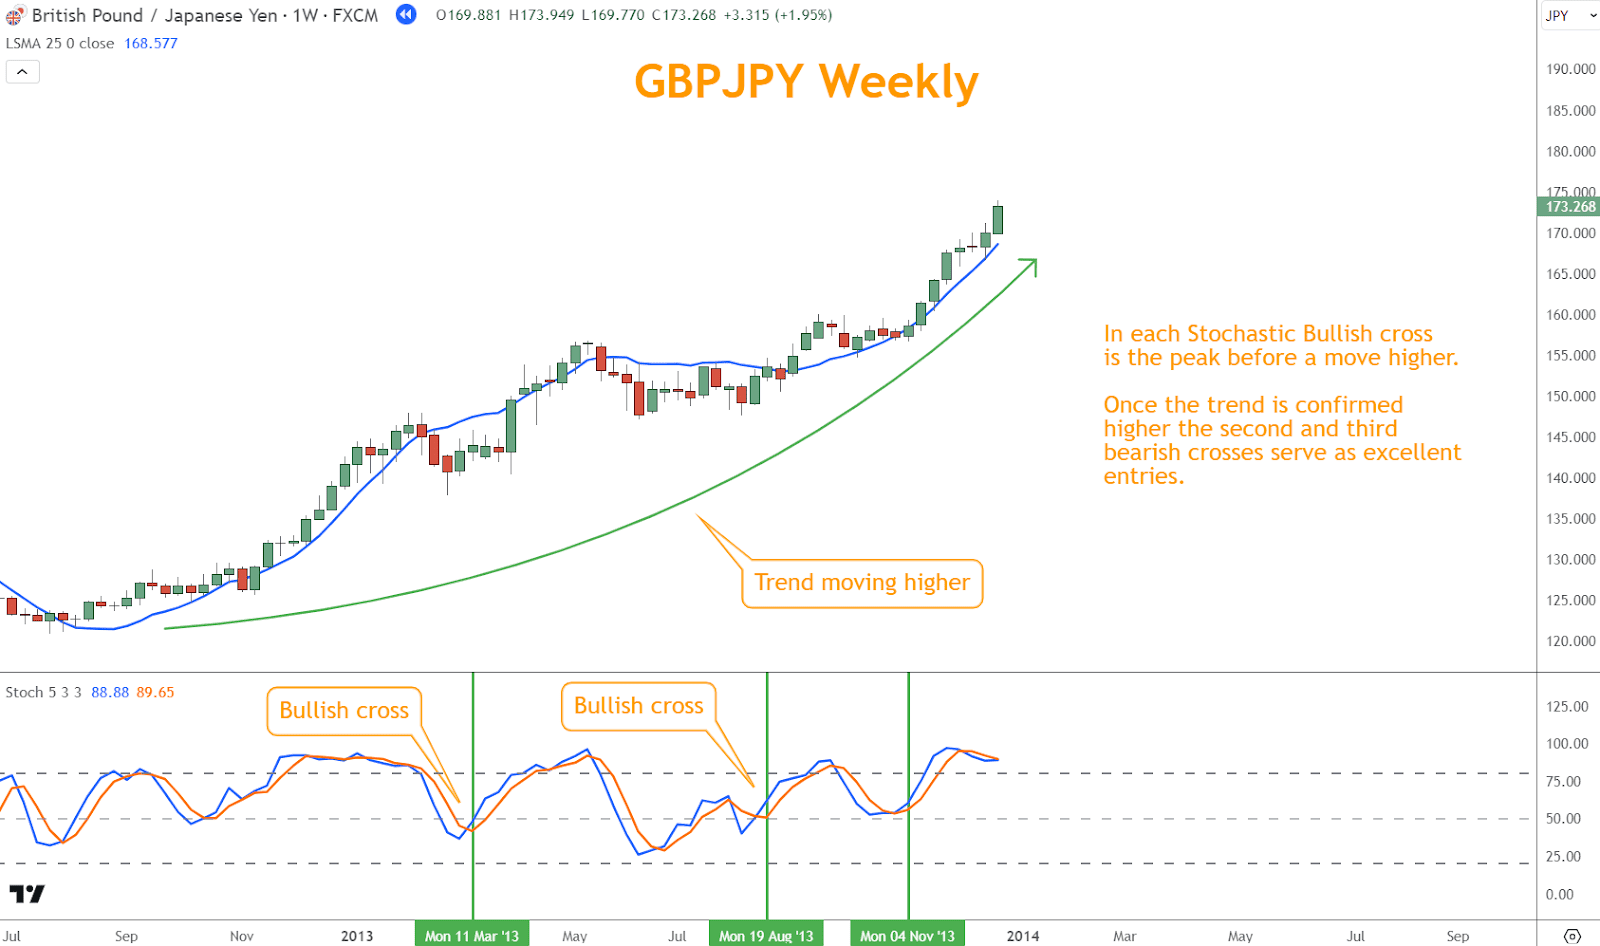
When Stochastic readings reach oversold levels (below 20%) and align with the uptrend, it signals a high-probability buying opportunity.
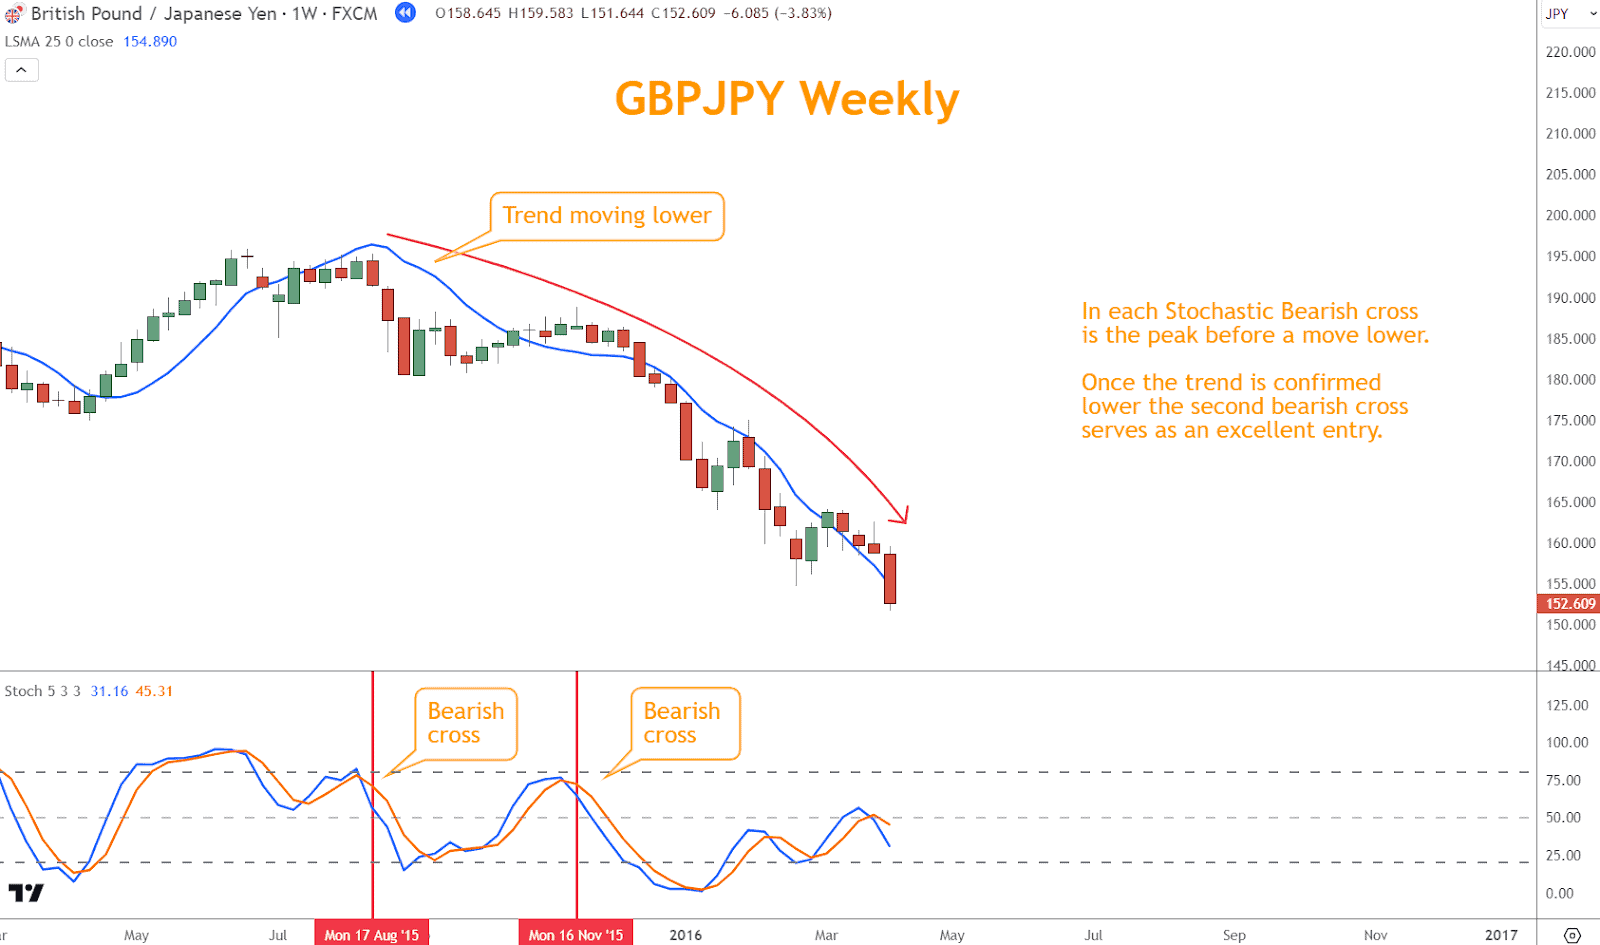
In the example above, the confirmed selloff creates opportunities each time the bearish cross on the Stochastic indicator appears.
This alignment filters out signals that go against the prevailing market direction.
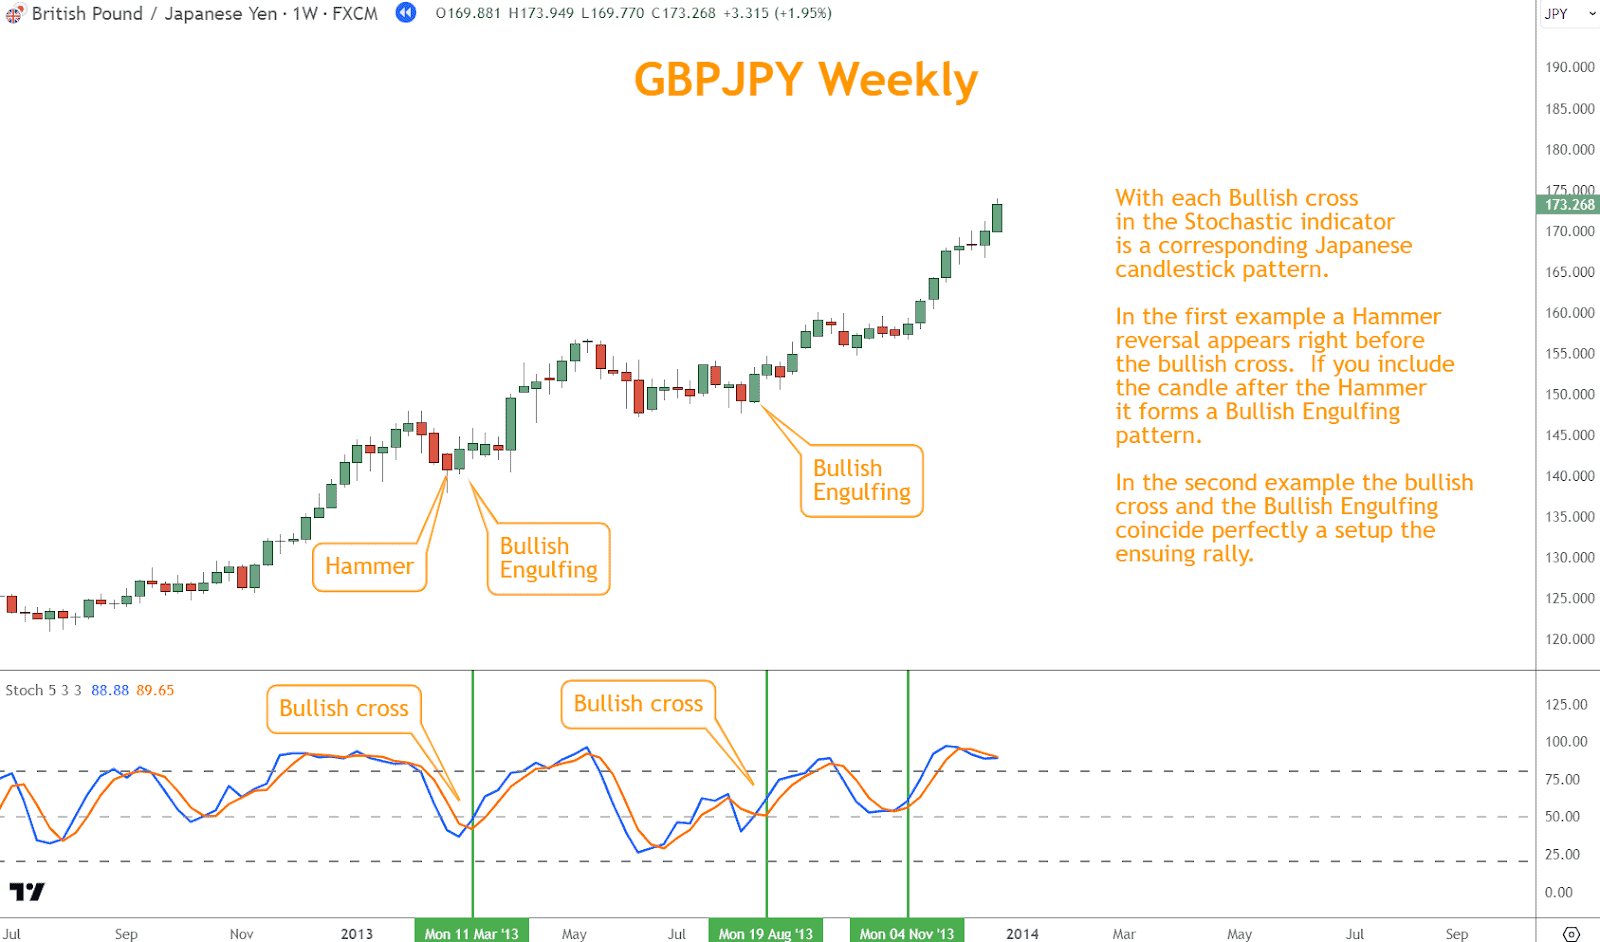
2. Validate with Candlestick Patterns
You can validate Stochastic signals with common candlestick patterns such as Bullish Engulfing, Hammers, or Morning Star reversals.
Candlestick confirmation examples in the diagram below include:
- Bullish Engulfing or Hammer with bullish cross = strong long setup.
- Evening Star with bearish cross = strong short setup.
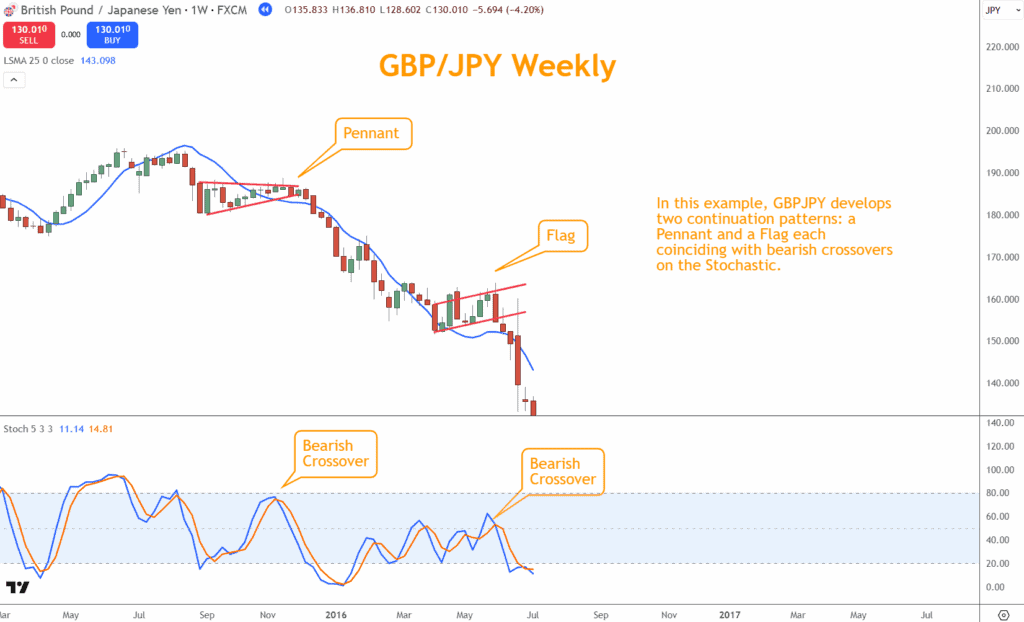
3. Confirm with Chart Patterns
You can use double tops, double bottoms, head and shoulders, or triangles to confirm stochastic indicator signals.
Examples:
- Pennant coinciding with a bearish cross → strong sell signal.
- Flag coinciding with bullish cross → strong buy signal.
4. Integrate with Support and Resistance
Integrating Stochastic analysis with support and resistance levels provides valuable insights into potential reversal or breakout points in the market.
- At support: oversold + bullish cross = potential rebound.
- At resistance: overbought + bearish cross = potential pullback.
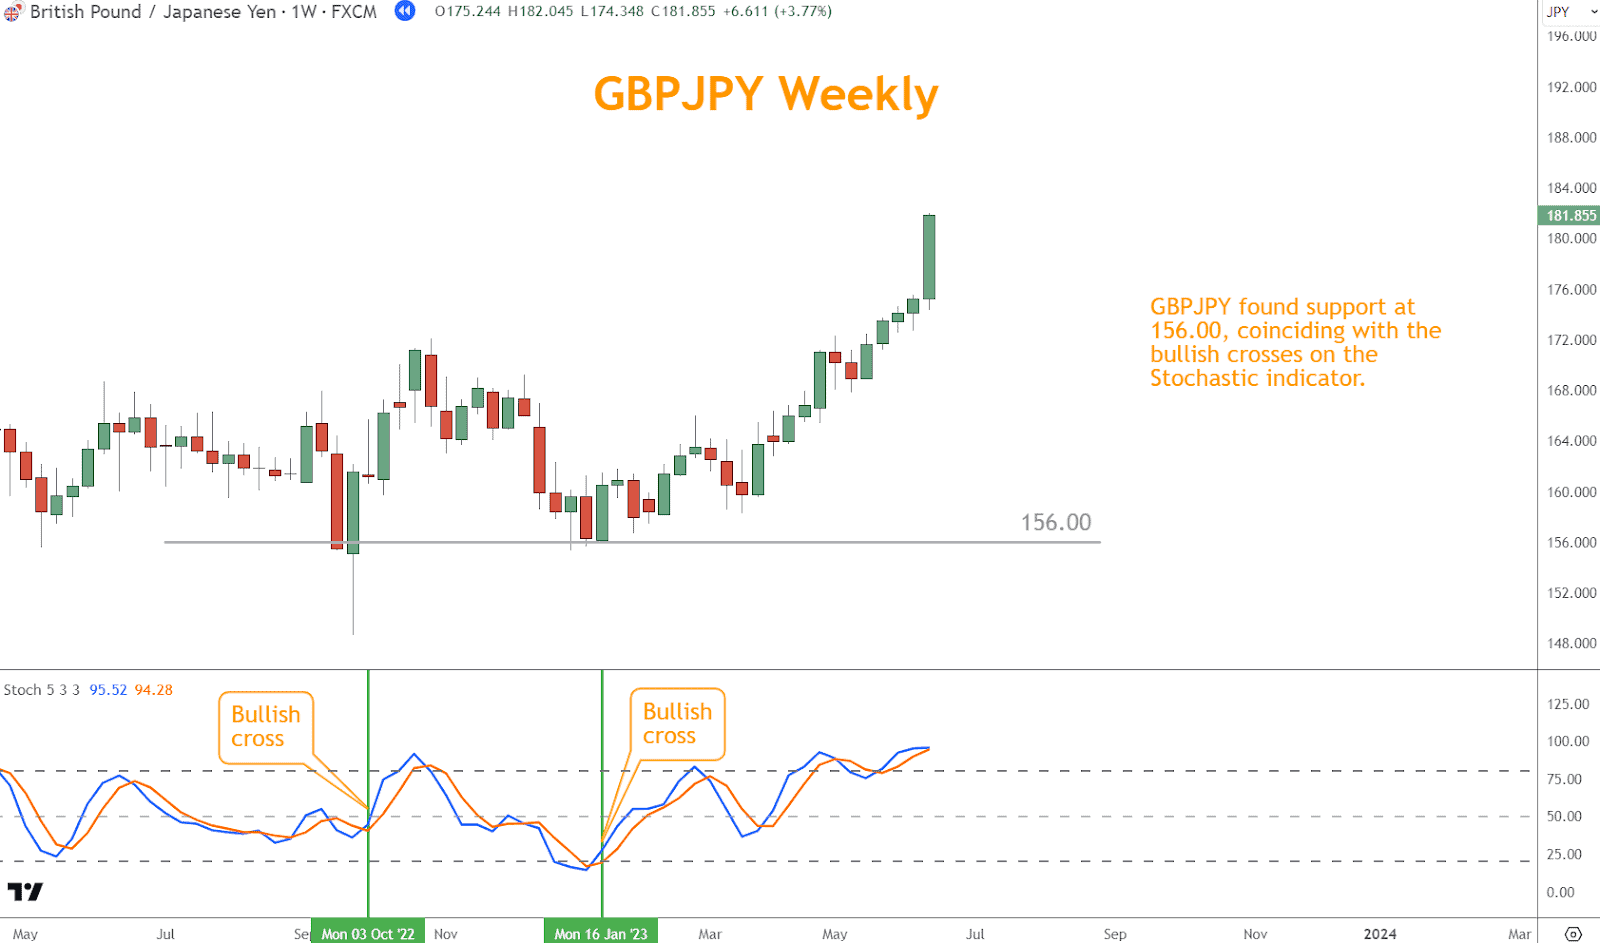
In the example above, GBPJPY found support at 156.00, coinciding with the bullish crosses on the Stochastic indicator.
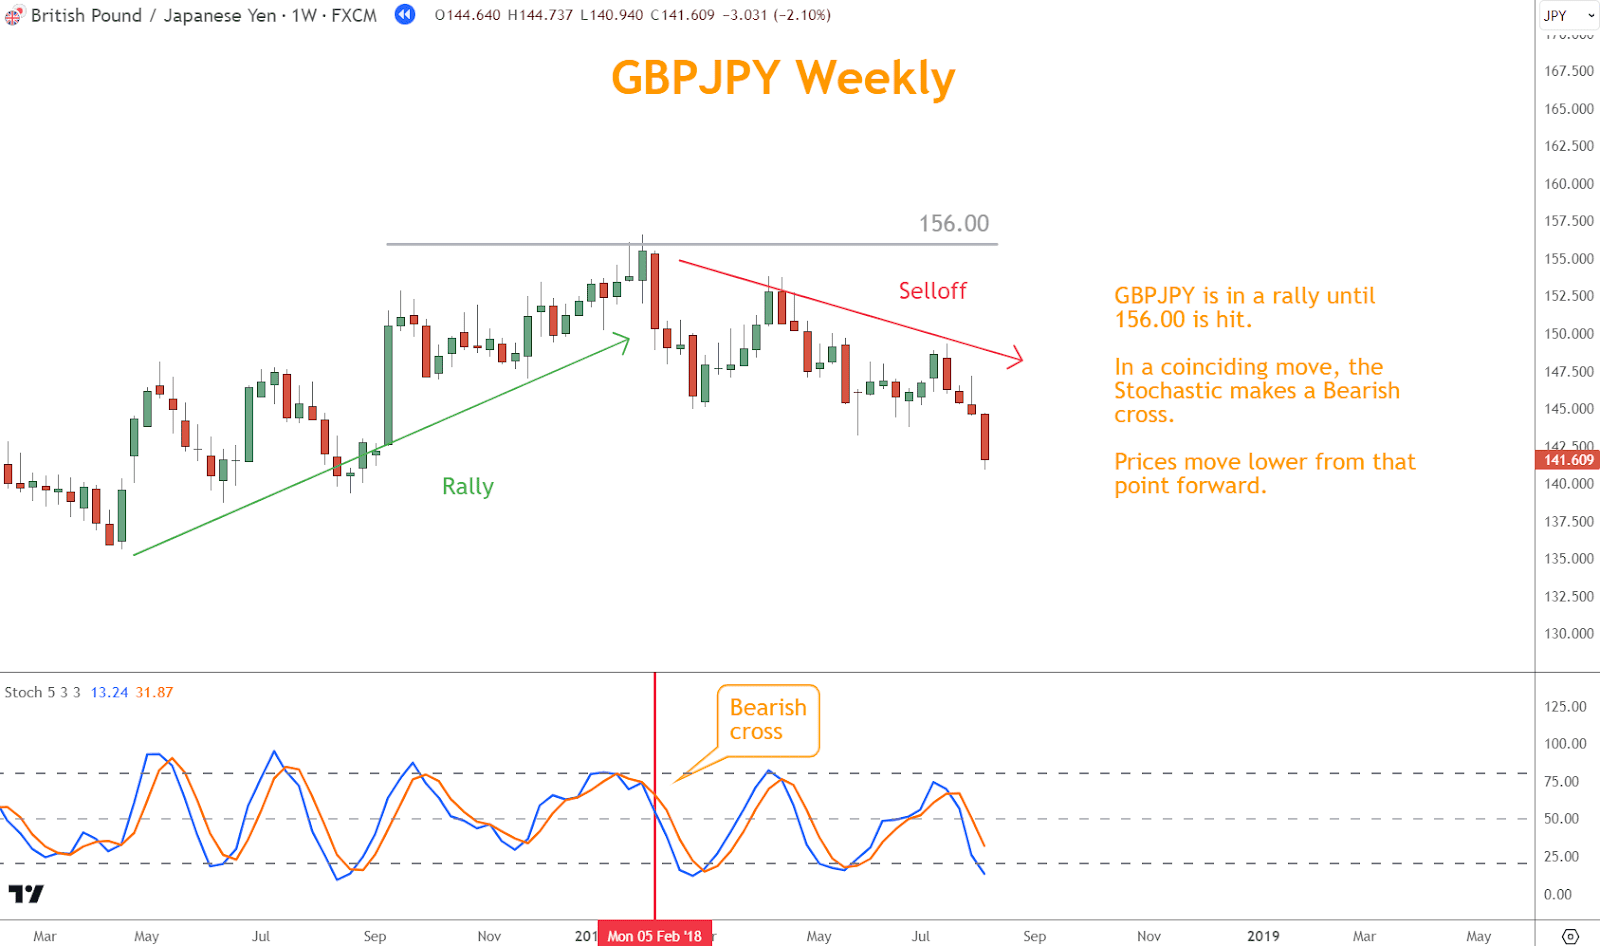
In the above example, GBPJPY rallies until 156.00. is hit. In a coinciding move, the Stochastic makes a Bearish cross.
Limitations of the Stochastic Indicator
The Stochastic Indicator is powerful but not perfect.
- False signals: common in sideways or choppy markets.
- Lagging in strong trends: Stochastic can remain overbought/oversold for extended periods.
- Whipsaws: frequent conflicting signals may lead to losses.
This makes it essential to use Stochastic with other forms of analysis (trend, candlesticks, fundamentals).
Conclusion
The Stochastic Indicator provides critical insights into market momentum and potential reversal zones.
On its own, it can mislead traders—but when paired with trend analysis, candlestick patterns, chart formations, and support/resistance, it becomes far more effective.
To achieve consistent profitability, combine Stochastic with other tools and always apply risk management.
What’s the Next Step?
Open your charts and apply Stochastic to your favorite Forex pairs.
Test it with the four integration tips outlined above.
If you need a structured process, start with the Six Basics of Chart Analysis—free to download. When you get it, you’ll also receive Forex Forecast, a free Sunday newsletter that includes:
- Trade ideas using the Six Basics
- Case studies from successful trades
- Trading education guides and videos
- Links to new articles and upcoming webinars
- Position Forex updates and exclusive tools

Quiz: Understanding the Stochastic Indicator in Forex
1. What does the Stochastic Indicator measure?
a. Price volatility over time
b. The relationship of closing price to high/low range
c. Average trading volume
d. Interest rate differentials
2. What does a reading above 80 typically suggest?
a. Neutral momentum
b. Overbought conditions
c. Oversold conditions
d. Strong divergence
3. When the %K line crosses above the %D line, what does it signal?
a. Bearish momentum
b. Trend exhaustion
c. Bullish momentum
d. Neutral signal
4. What does bullish divergence indicate?
a. Price makes lower lows, Stochastic makes higher lows
b. Price makes higher highs, Stochastic makes lower highs
c. Price consolidates, Stochastic remains flat
d. Stochastic exceeds 80% while price declines
5. Which tool enhances the accuracy of Stochastic signals?
a. Moving averages only
b. Chart patterns and candlesticks
c. Random price levels
d. Fundamental news alone
6. What is a key limitation of the Stochastic Indicator?
a. It cannot detect momentum
b. It always lags in sideways markets
c. It generates false signals in choppy or strongly trending markets
d. It only works with stocks, not Forex
Answer Key
- b
- b
- c
- a
- b
- c
Forex Trading Disclosure Statement
Risk Warning:
Forex trading involves significant risk and may not be suitable for all investors. The leveraged nature of Forex trading can work both for and against you, leading to substantial gains or losses. Before trading Forex, you should carefully consider your financial objectives, experience level, and risk tolerance. It is possible to lose more than your initial investment, and you should only trade with money you can afford to lose.
Market Risks and Volatility:
Forex markets are influenced by global economic, political, and social events, which can result in unpredictable price movements. High market volatility can lead to sudden and substantial changes in currency values, potentially causing losses that exceed your initial deposit.
Leverage Risks:
Leverage amplifies both potential gains and potential losses. While leverage can increase profitability, it also increases the risk of significant losses, including the loss of your entire trading capital.
Trading Tools and Technology Risks:
Forex trading platforms, including those offered by brokers, are subject to technology risks, such as system failures, latency issues, and potential errors in price feeds. Traders should be aware that these risks can impact the execution of trades and trading outcomes.
No Guarantee of Profitability:
Past performance in Forex trading is not indicative of future results. There is no guarantee that you will achieve profits or avoid losses when trading Forex. Market conditions and individual trading strategies vary, and no trading system can eliminate the inherent risks of Forex trading.
Educational Purposes Only:
Any information provided about Forex trading, including strategies, analysis, or market commentary, is for educational purposes only and should not be considered financial advice. Consult a qualified financial advisor or tax professional before making any trading decisions.
Regulatory Compliance:
Forex trading is regulated differently in various jurisdictions. Ensure that you are trading with a licensed and compliant broker in your country of residence.
Responsibility:
You are solely responsible for your trading decisions and the associated risks. It is your duty to understand the terms and conditions of Forex trading, including margin requirements, stop-losses, and other risk management tools.
Acknowledgment:
By engaging in Forex trading, you acknowledge that you have read, understood, and accepted this disclosure statement. You accept full responsibility for the outcomes of your trading decisions and agree to trade at your own risk.