
RSI trading is one of the most popular indicator-driven trading styles in technical analysis—and one of the most misunderstood.
Traders often ask:
- Should RSI be added to your chart?
- Can it help find winning trades?
- Why does it get so much attention?
- Is it a trend indicator, a momentum indicator, or both?
The RSI is frequently used to identify momentum, overbought and oversold conditions, and potential reversals. However, when RSI is used in isolation, it often produces false signals and frustration.
This article explains what RSI actually measures, how it differs from similar indicators, and six common RSI trading techniques—including which ones work, which ones fail, and why context matters more than the indicator itself.
TL;DR — Quick Summary
- RSI is a momentum indicator, not a trend indicator
- Default RSI settings (14) are not universally optimal
- Overbought and oversold signals work best with context
- RSI divergence is popular but unreliable on its own
- RSI performs best when combined with trend, price structure, and support/resistance
- RSI should confirm trades—not generate them alone
Table of Contents
- TL;DR — Quick Summary
- What Is the Relative Strength Index (RSI)?
- Understanding RSI Settings
- RSI vs. Stochastic: What’s the Difference?
- How Traders Actually Use RSI (6 Common Techniques)
- Why RSI Fails When Used Alone
- Best Practices for Using RSI Effectively
- Conclusion
- 5-Question Quiz
- Forex Trading Disclosure Statement
What Is the Relative Strength Index (RSI)?
The Relative Strength Index (RSI) is a momentum oscillator that measures the speed and magnitude of recent price changes.
RSI helps traders identify:
- Momentum shifts
- Overbought and oversold conditions
- Potential price exhaustion
- Changes in buying and selling pressure
RSI values range from 0 to 100:
- Above 70 → overbought
- Below 30 → oversold
- Around 50 → neutral momentum
RSI does not define market direction. It measures energy, not trend.
Understanding RSI Settings
The default RSI setting is 14 periods, but there is no universally “best” setting.
How RSI Settings Affect Signals
| Setting Type | Effect | Trade-Off |
| Lower periods (e.g., 7–10) | More sensitive, faster signals | More false signals |
| Default (14) | Balanced responsiveness | Still context-dependent |
| Higher periods (20+) | Smoother, fewer signals | Late entries and exits |
RSI settings must be adjusted based on volatility, timeframe, and trading style. No single configuration works in all markets.
RSI vs. Stochastic: What’s the Difference?
Although RSI and Stochastic often appear similar on charts, they measure different things.
The RSI and Stochastic are commonly used oscillators that generate indicators based on different mathematical formulas.
For example, while RSI uses the average gain vs. average loss over a set number of periods, Stochastic uses the closing price relative to the highest high and lowest low over the same period.
| Indicator | Calculation Focus | Overbought | Oversold |
| RSI | Average gains vs. losses | 70 | 30 |
| Stochastic | Close vs. price range | 80 | 20 |
You can see the difference in the USD/JPY chart below.
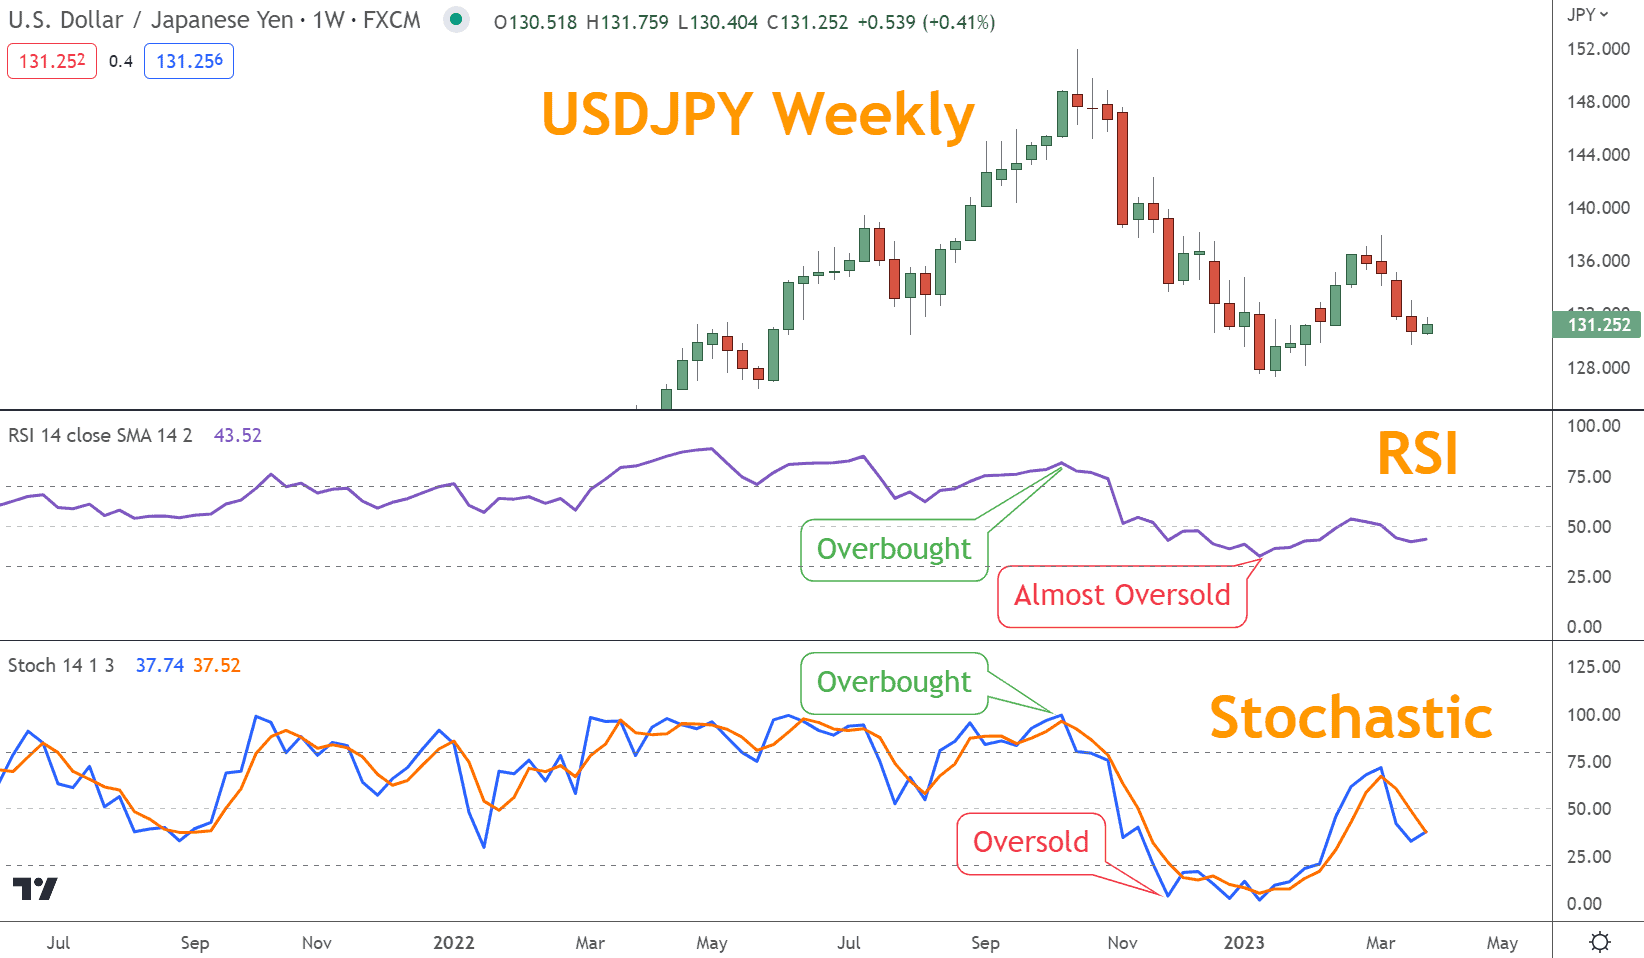
Both identify momentum extremes, but they are not interchangeable. Signals may align or conflict depending on context.
Looking for a Strategy?
Download the Six Basics of Chart Analysis and sign up for Forex Forecast to learn a bottom-up approach to analyzing Forex markets and weekly market updates.
How Traders Actually Use RSI (6 Common Techniques)
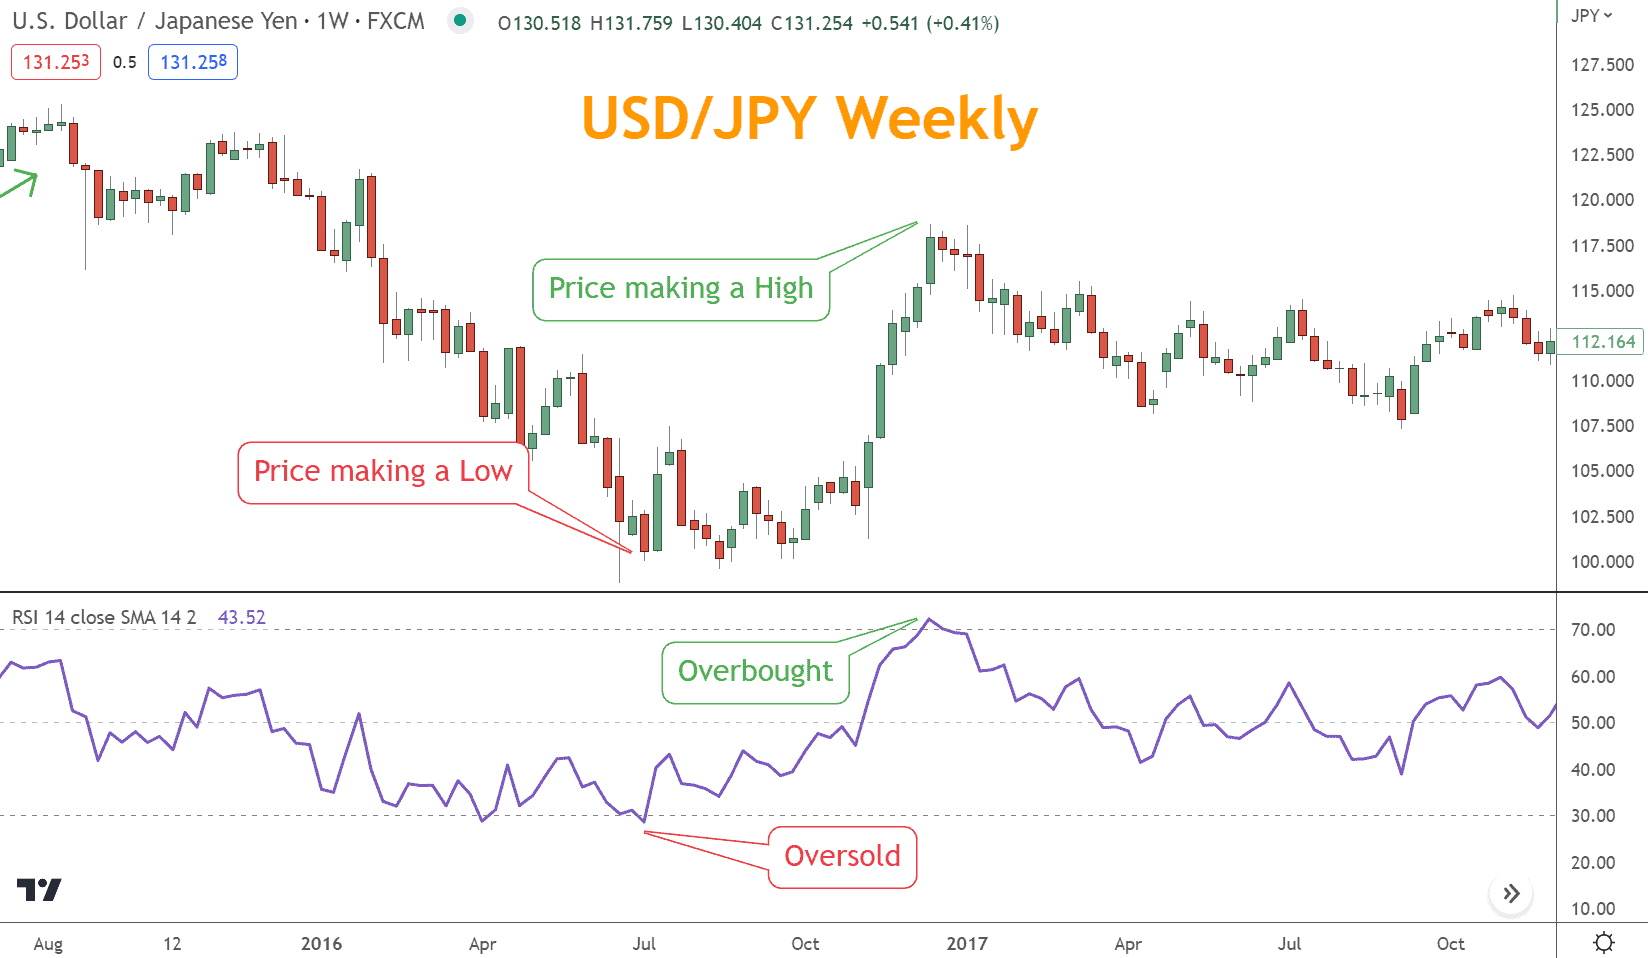
1. Overbought and Oversold Signals
RSI readings above 70 or below 30 suggest price exhaustion, not automatic reversals.
Best use:
- During pullbacks in trends
- Near support or resistance
- With confirmation from price action
Worst use:
- Blindly fading strong trends
- Treating overbought as “must sell”
You can see the relationship between the two in the USD/JPY chart below.
2. RSI Trendlines
Trendlines can be drawn on RSI itself, not just price.
- Rising RSI trendlines show strengthening momentum
- Falling RSI trendlines show weakening momentum
- A trendline break can lead price
To draw an upward trendline on the chart, traders should connect two or more lows when the RSI rises.
Likewise, a downward trendline is drawn by linking two or more highs when the RSI falls.
A break of a trendline can signal an impending price reversal or continuation.
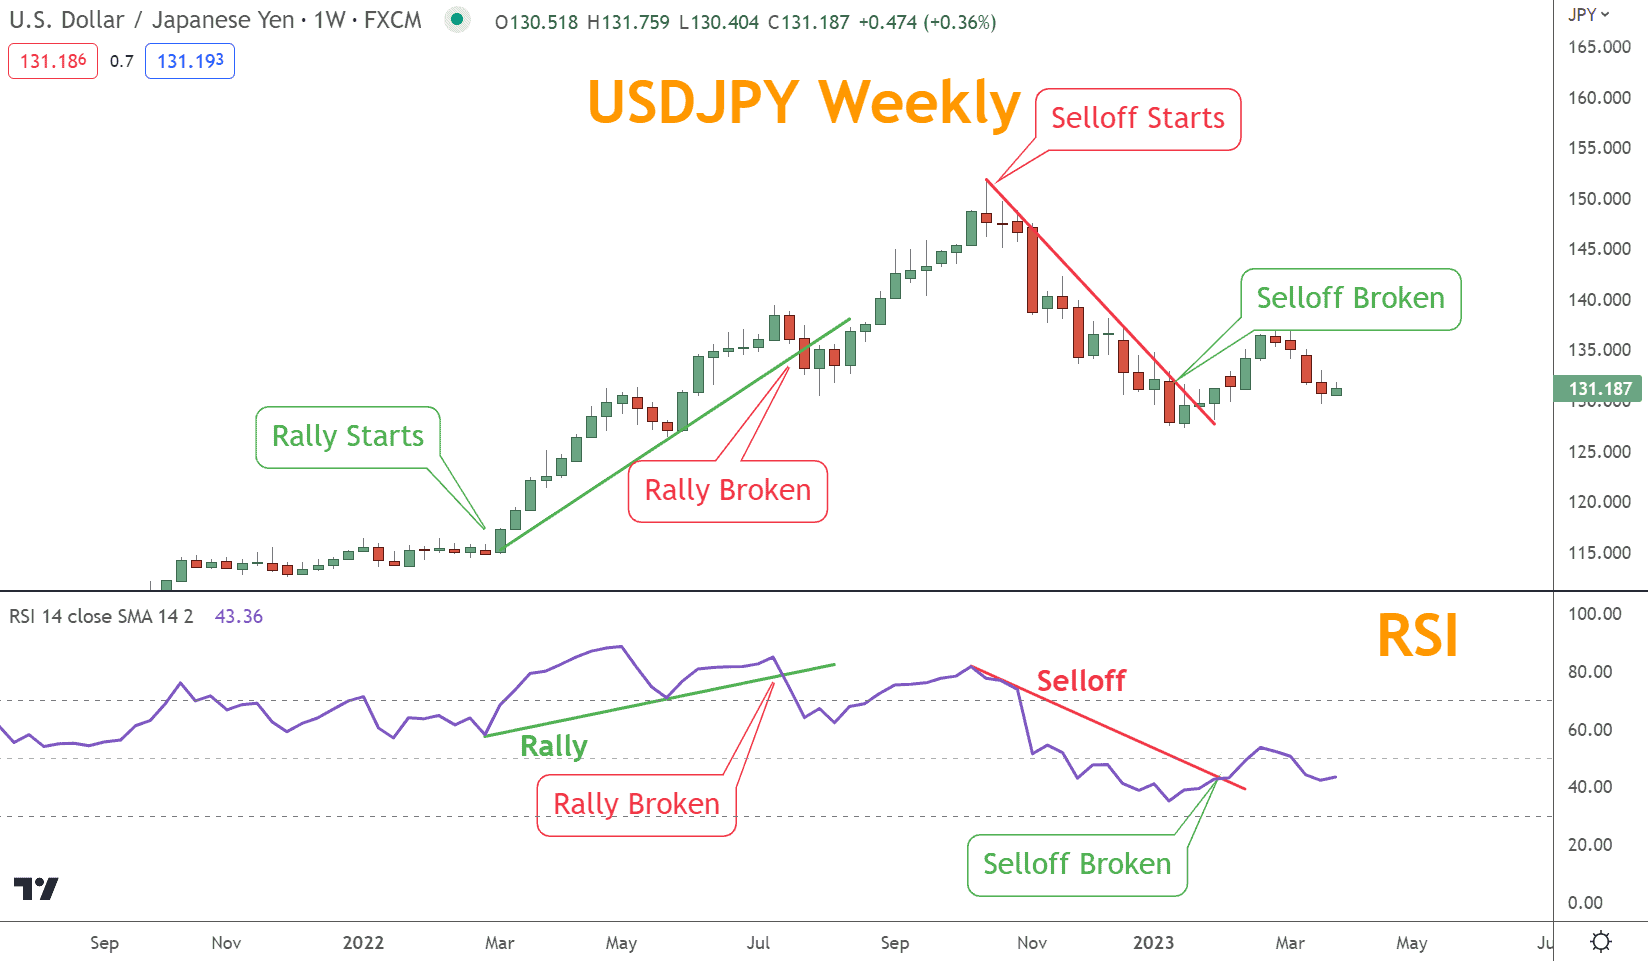
RSI trendlines often signal momentum shifts before price reacts.
3. RSI Divergence (Popular but Weak)
Divergence occurs when price and RSI disagree.
| Type | Signal |
| Bearish divergence | Price higher highs, RSI lower highs |
| Bullish divergence | Price lower lows, RSI higher lows |
The divergence indicates momentum is changing and can signal a possible reversal in future price movements.
By using divergence in trading strategies, traders can identify price reversals and optimize their entry and exit points.
The divergence technique, however, could be more reliable.
An example of a successful divergence signal is on the AUD/NZD chart below.
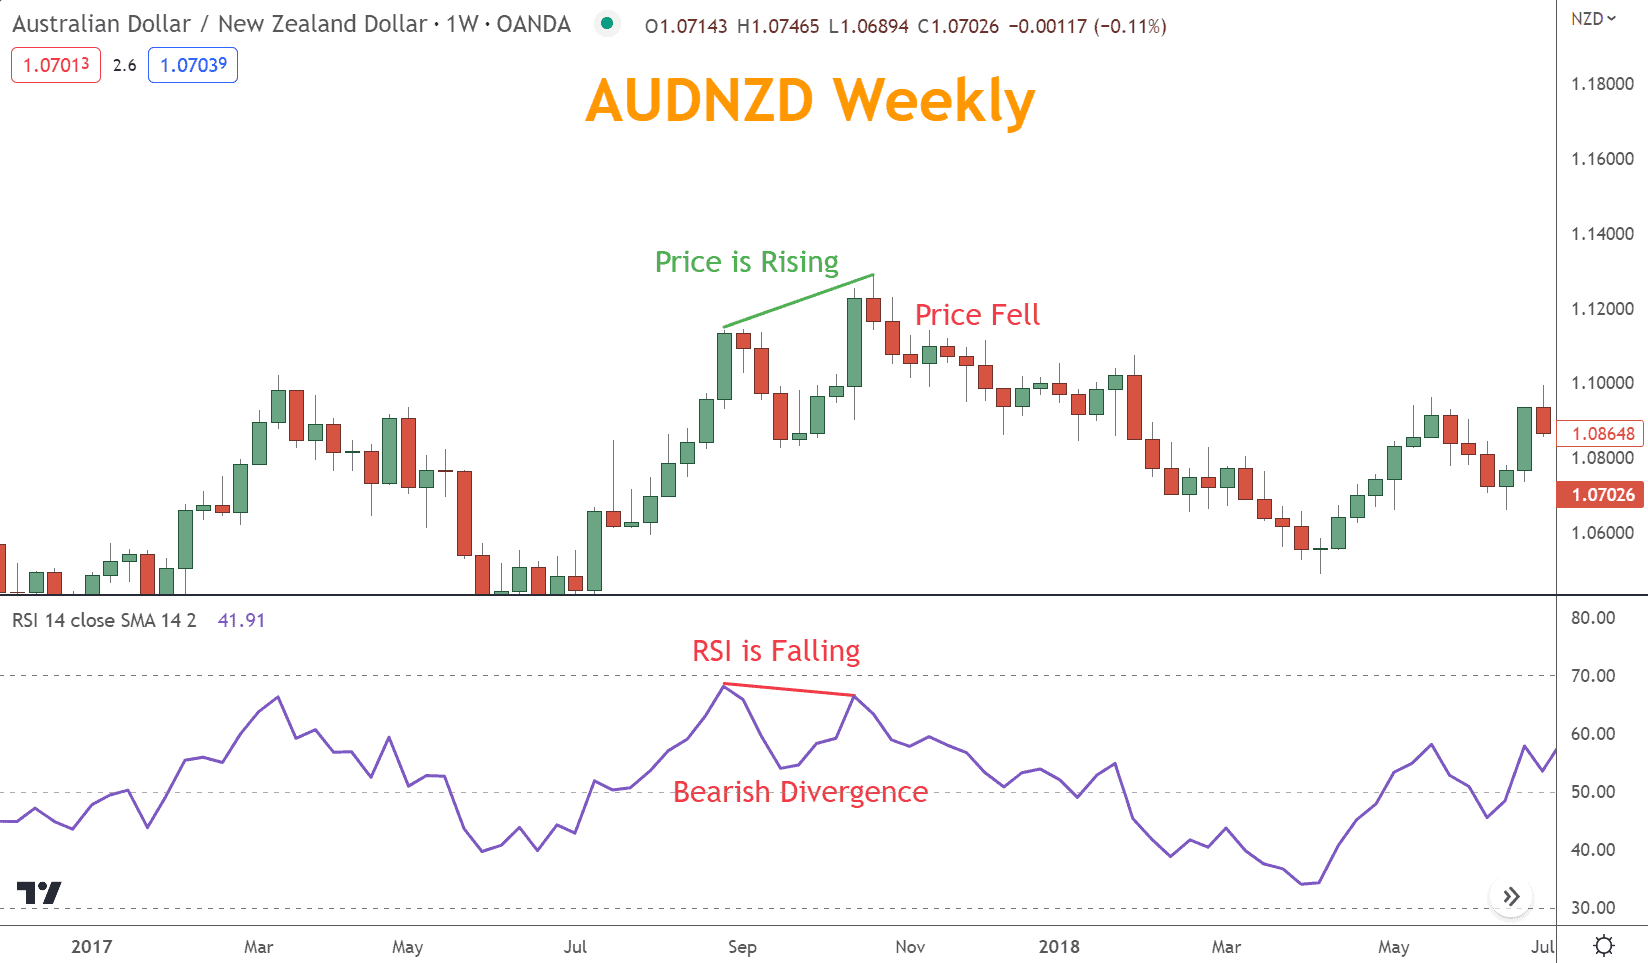
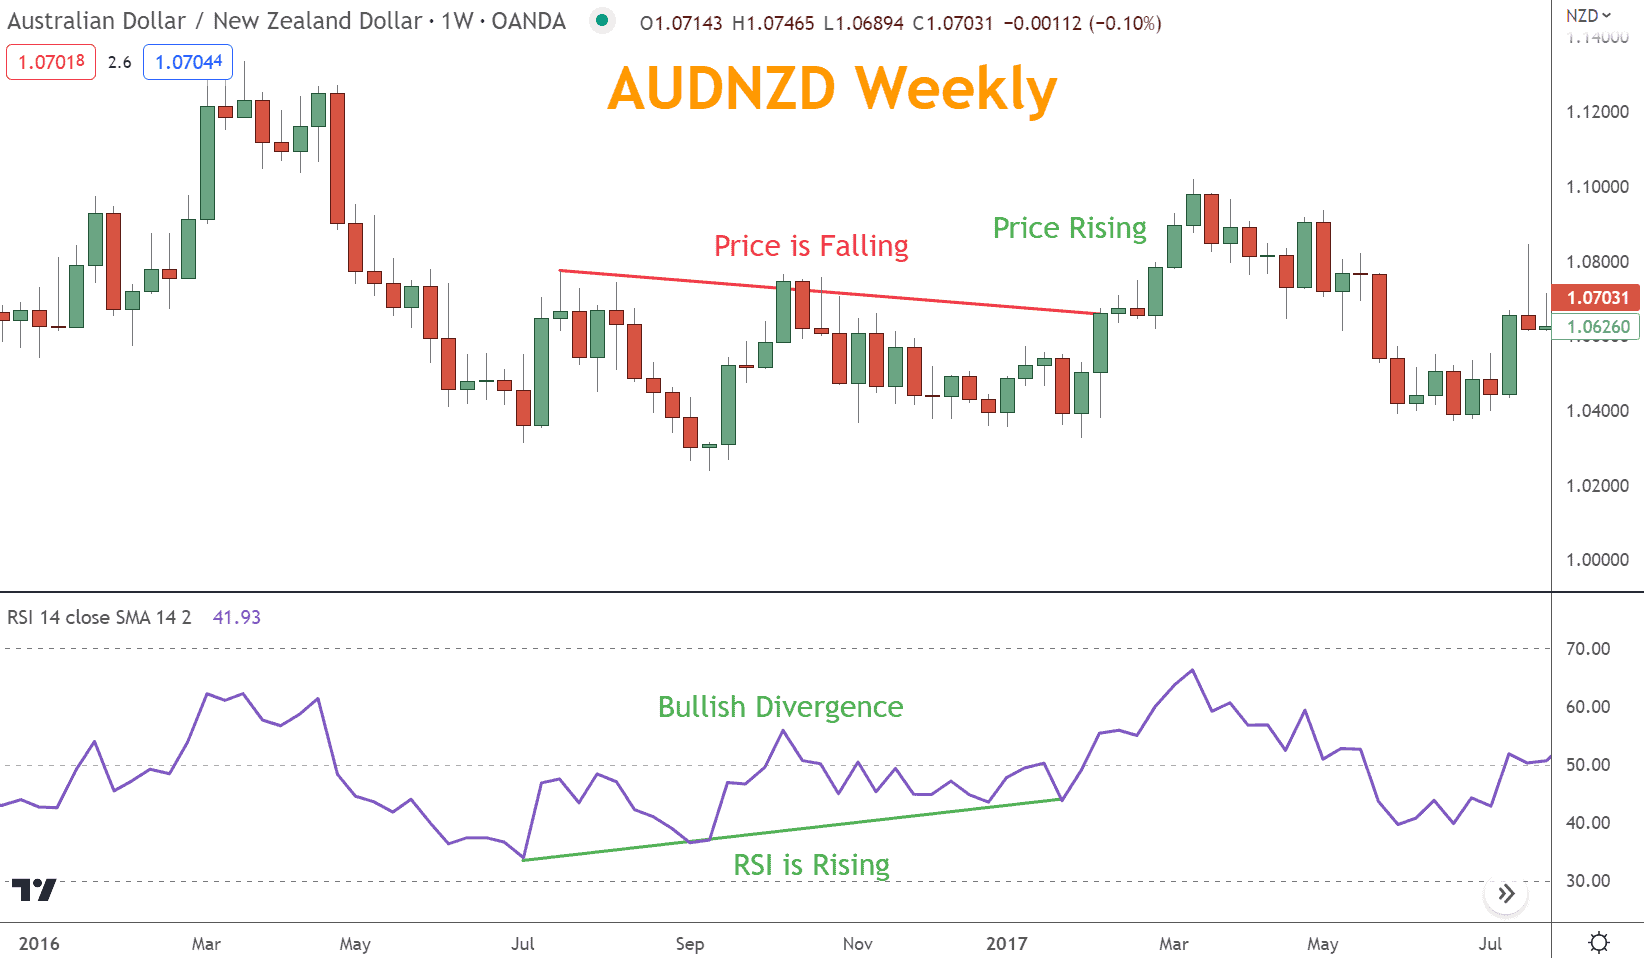
Divergence can precede reversals—but frequently fails in strong trends. It should never be traded alone.
4. RSI Chart Patterns
RSI can form:
- Double tops and bottoms
- Triangles
- Wedges
- Channels
By analyzing these patterns and applying the associated psychology, traders can plan trade entries and exits just as they would on an instrument’s price chart.
Whether using channel lines, divergence, or chart patterns, you will find the RSI more effective when combined with other forms of technical analysis.
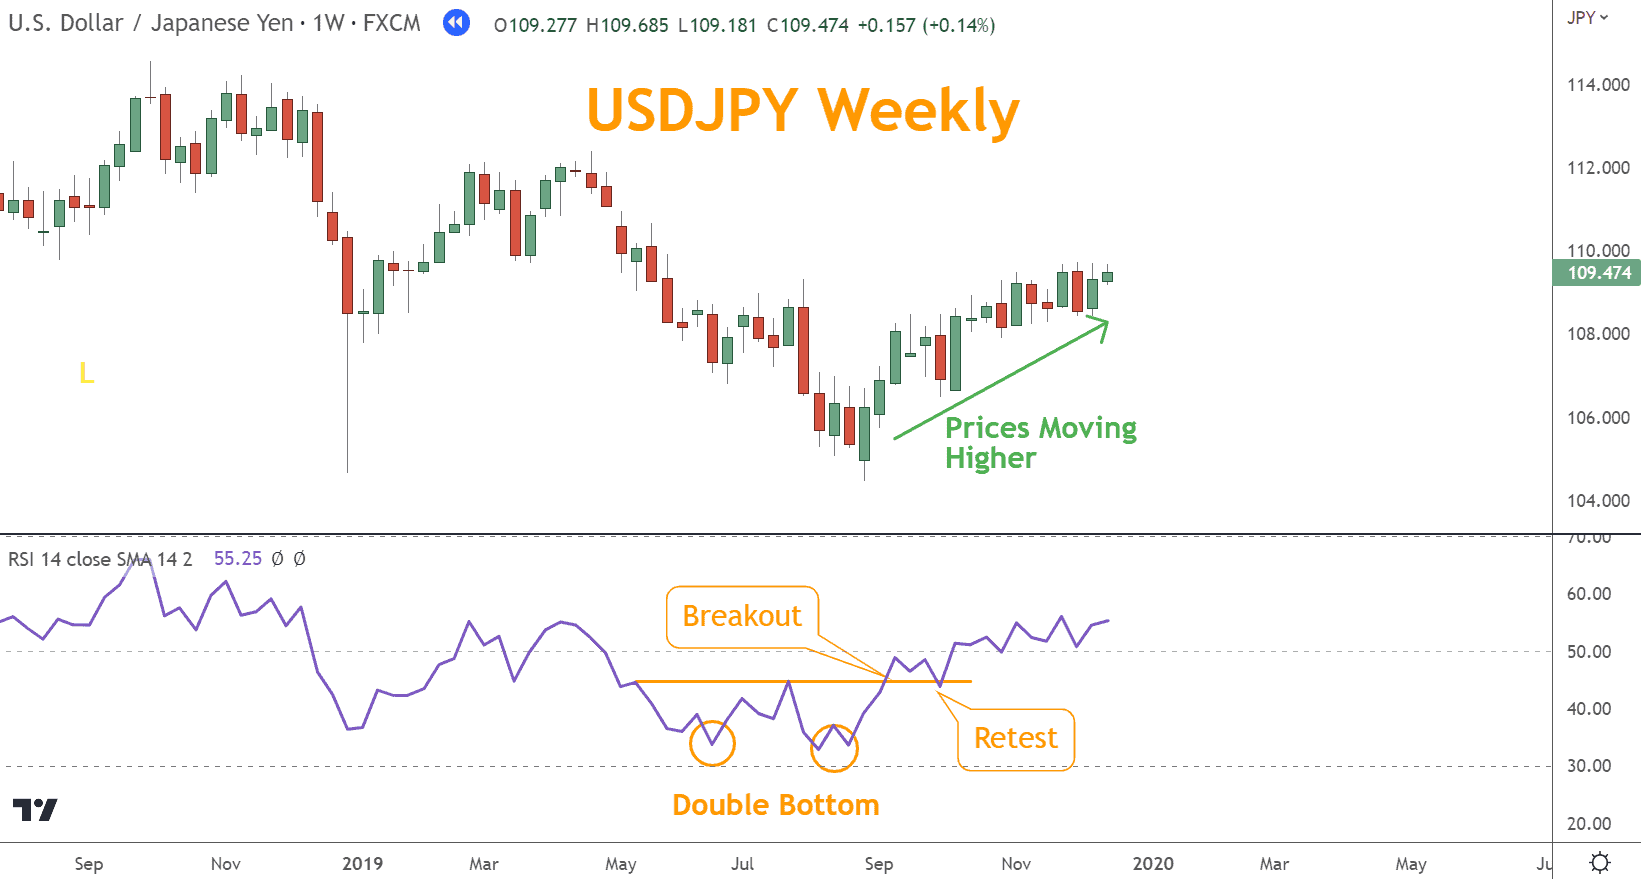
These patterns reflect momentum psychology and are most effective when they confirm price-based patterns—not replace them.
5. RSI + MACD Strategy
MACD provides trend context. RSI provides momentum timing.
Typical approach:
- MACD defines bullish or bearish bias
- RSI crossing above or below 50 confirms momentum
- Trades are filtered for alignment
The MACD is a trend-following indicator that can help qualify signals from the RSI.
By combining the two indicators, traders can make more informed decisions when entering or exiting trades.
This can help improve overall profitability and reduce potential losses.
You can see in the example below that the MACD gives a bullish trend signal when its signal line crosses the MACD line. The crossover is beneath the MACD “0” level, making the Bullish signal less sure.
Waiting for RSI confirmation that it crosses above the “50” line increases the likelihood of success.
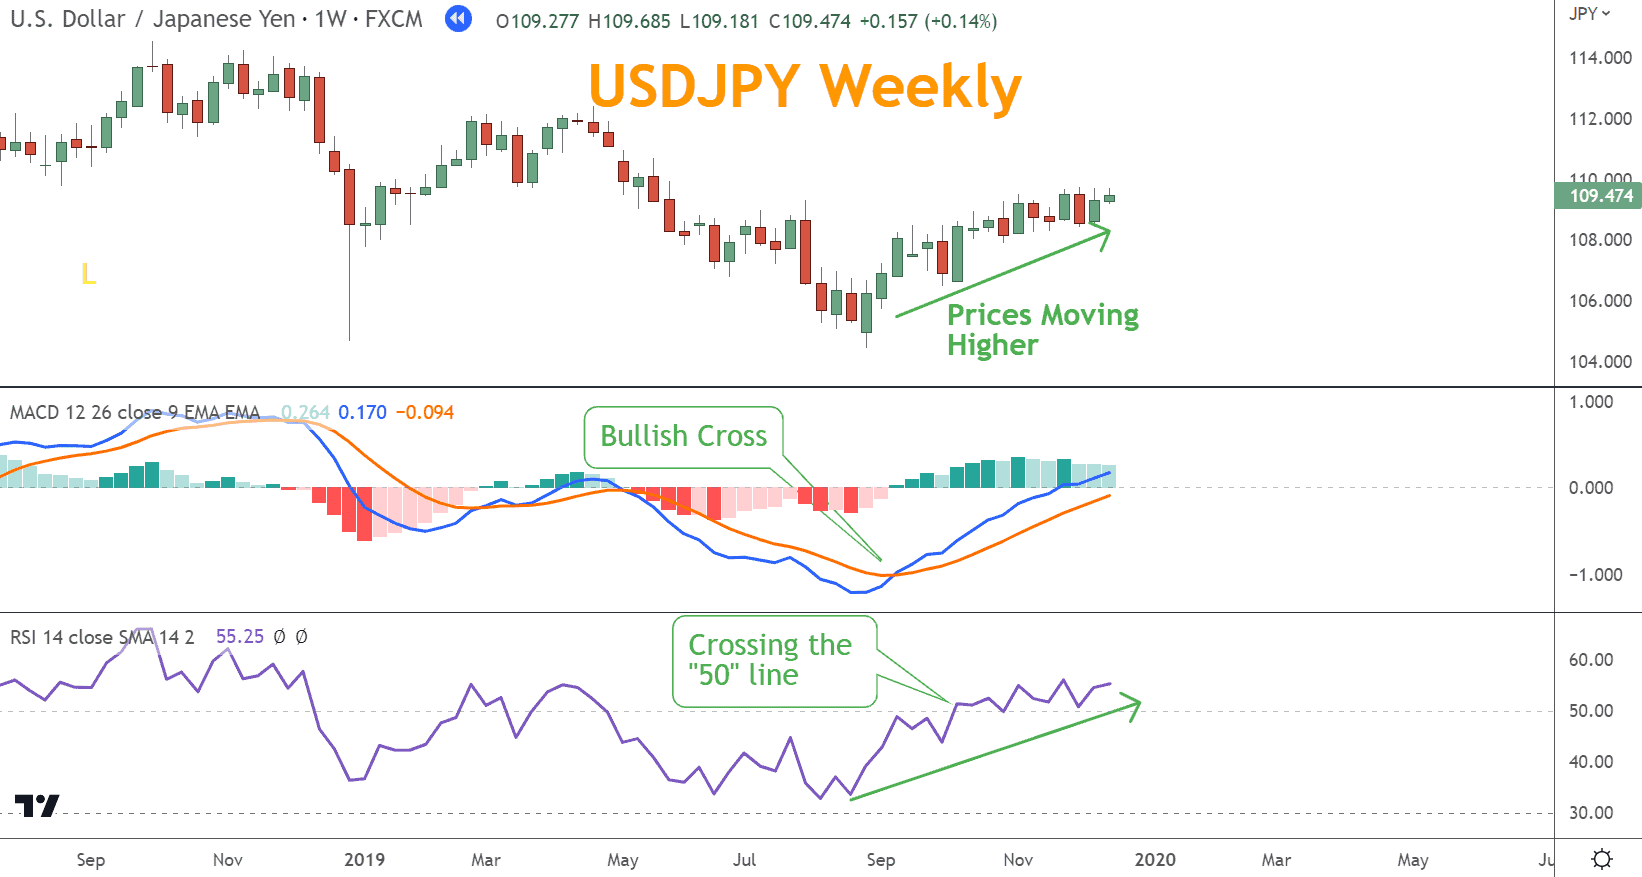
This combination reduces false RSI signals in choppy markets.
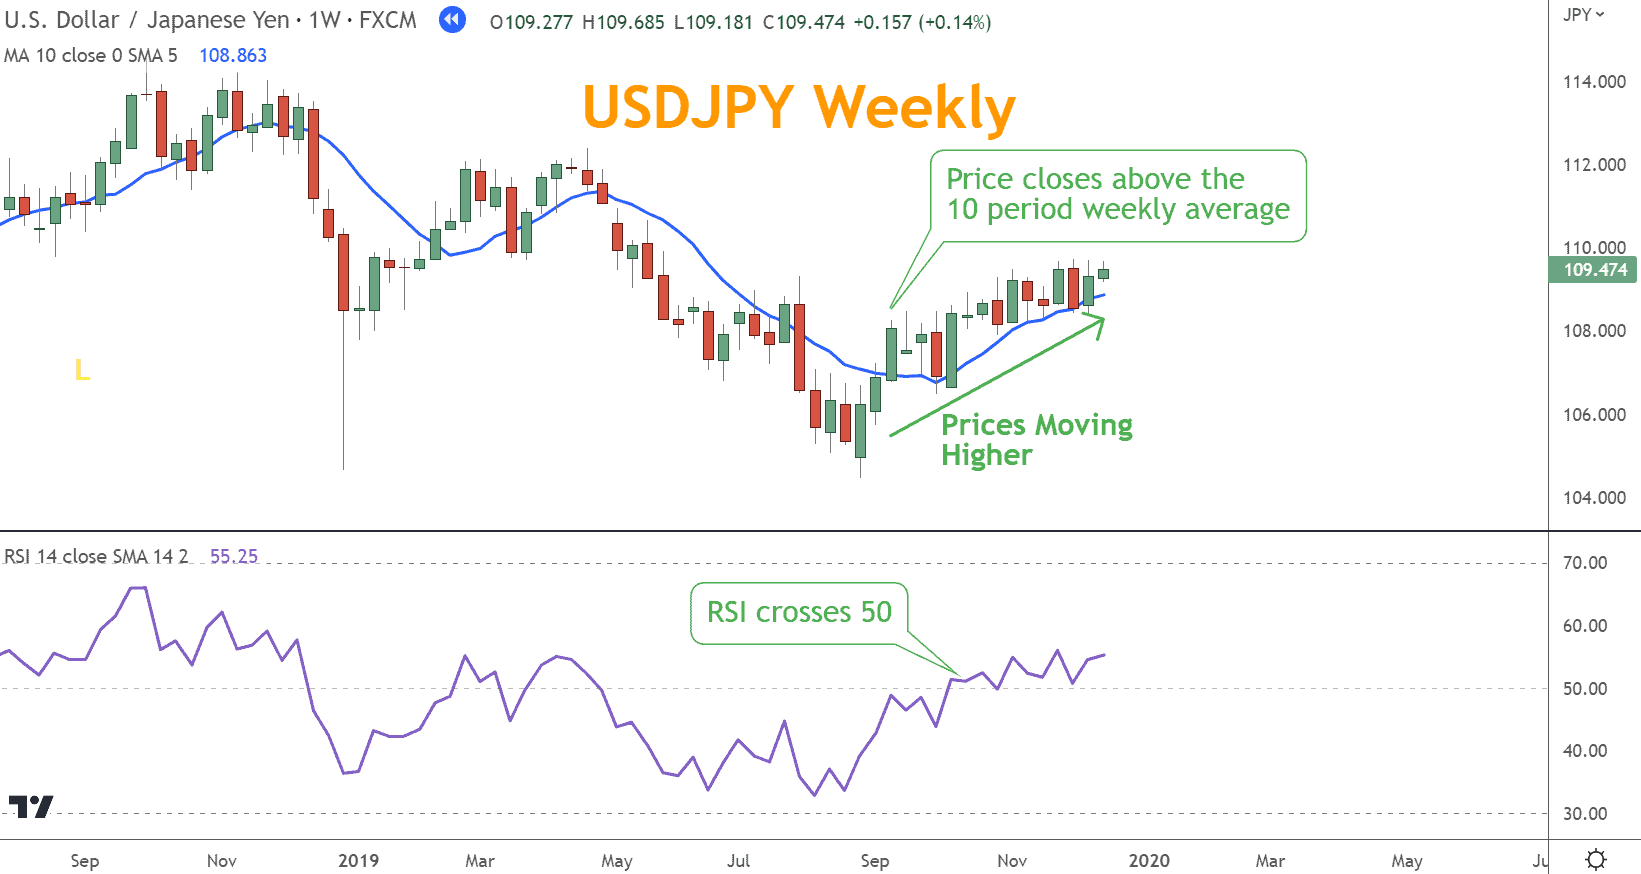
6. RSI + Simple Moving Average (SMA)
This is one of the simplest—and most misused—RSI strategies.
Basic structure:
- Price above SMA → bullish bias
- Price below SMA → bearish bias
- RSI crossing 50 confirms entry
- Exit at overbought or oversold levels
This works only when:
- The trend is clear
- The market is not range-bound
- Risk management is strict
This combination allows traders to identify when a market is overbought or oversold and when it may enter a new trend.
A 10-period SMA can be used as a filter. The trend is bullish when the price is above the SMA and bearish below the SMA.
Whenever the RSI value crosses the “50” line, complementing the trend analysis, a buy signal or sell signal is given, and a trade can be opened.
A transaction should be closed when an overbought or oversold reading is detected.
The goal is to identify a trend reversal in an uptrend or downtrend and coordinate it with the RSI signal.
Ideally, prices continue to reverse in the opposite direction, and this combination provides many opportunities from recent price changes.
These technical trading systems are employed in day trading, swing trading, and position trading, each in a unique time frame.
Why RSI Fails When Used Alone
RSI lacks context.
Without:
- Trend direction
- Support and resistance
- Price structure
- Candlestick confirmation
RSI signals become noise.
Using RSI alone is like feeling acceleration in a car without knowing whether you’re driving uphill, downhill, or into a wall.
Best Practices for Using RSI Effectively
- Always identify trend first
- Use RSI to time entries, not define direction
- Combine with support and resistance
- Ignore divergence without confirmation
- Favor higher timeframes for reliability
RSI should confirm what price is already suggesting.
Conclusion
RSI is neither good nor bad—it is context-dependent. When traders treat RSI as a signal generator, it fails.
When they treat it as a momentum confirmation tool within a broader technical framework, it becomes highly effective.
The key is understanding what RSI measures, respecting its limitations, and integrating it with trend, support, and resistance, and price structure.
Used correctly, RSI enhances decision-making.
Misused, it amplifies mistakes.
What’s Your Next Step?
Start by adding the RSI to a few of your regularly traded Forex pairs and observe how it behaves across different market conditions.
Identify whether the pair is in a rally, selloff, or neutral state first—then study how RSI reacts during pullbacks, consolidations, and breakouts within that context.
Next, practice combining RSI with structure, not signals.
Look for RSI shifts near support and resistance, during chart pattern development, or alongside Japanese Candlestick reversals. Focus on confirmation, not prediction.
If you want a repeatable process for doing this consistently, learn the Six Basics of Chart Analysis.
The Six Basics provide a structured framework for combining trend, momentum, candlesticks, chart patterns, and support and resistance—exactly the context RSI requires to be useful.
When you download the Six Basics, you’ll also receive the Forex Forecast every Sunday, which includes:
- Trade ideas using real charts
- Step-by-step technical reasoning
- Case studies showing how the Six Basics work in live markets
- New educational guides and articles
- Updates, webinars, and tools from PositionForex

The best way to improve with RSI—and any indicator—is to apply it within a disciplined process. Start small, stay consistent, and let structure guide every decision.
5-Question Quiz
Questions
- RSI is best described as a:
A. Trend indicator
B. Volatility indicator
C. Momentum indicator
D. Support tool - An RSI reading above 70 typically indicates:
A. Guaranteed reversal
B. Strong trend continuation
C. Oversold conditions
D. Overbought conditions - RSI divergence is best used as:
A. A standalone entry signal
B. A confirmation tool
C. A stop-loss method
D. A trend filter - The RSI “50” line primarily indicates:
A. Trend direction
B. Volatility
C. Momentum bias
D. Support and Resistance - RSI works best when combined with:
A. Random indicators
B. Volume only
C. News events
D. Trend and price structure
Answer Key
- C
- D
- B
- C
- D
Forex Trading Disclosure Statement
Risk Warning:
Forex trading involves significant risk and may not be suitable for all investors. The leveraged nature of Forex trading can work both for and against you, leading to substantial gains or losses. Before trading Forex, you should carefully consider your financial objectives, experience level, and risk tolerance. It is possible to lose more than your initial investment, and you should only trade with money you can afford to lose.
Market Risks and Volatility:
Forex markets are influenced by global economic, political, and social events, which can result in unpredictable price movements. High market volatility can lead to sudden and substantial changes in currency values, potentially causing losses that exceed your initial deposit.
Leverage Risks:
Leverage amplifies both potential gains and potential losses. While leverage can increase profitability, it also increases the risk of significant losses, including the loss of your entire trading capital.
Trading Tools and Technology Risks:
Forex trading platforms, including those offered by brokers, are subject to technology risks, such as system failures, latency issues, and potential errors in price feeds. Traders should be aware that these risks can impact the execution of trades and trading outcomes.
No Guarantee of Profitability:
Past performance in Forex trading is not indicative of future results. There is no guarantee that you will achieve profits or avoid losses when trading Forex. Market conditions and individual trading strategies vary, and no trading system can eliminate the inherent risks of Forex trading.
Educational Purposes Only:
Any information provided about Forex trading, including strategies, analysis, or market commentary, is for educational purposes only and should not be considered financial advice. Consult a qualified financial advisor or tax professional before making any trading decisions.
Regulatory Compliance:
Forex trading is regulated differently in various jurisdictions. Ensure that you are trading with a licensed and compliant broker in your country of residence.
Responsibility:
You are solely responsible for your trading decisions and the associated risks. It is your duty to understand the terms and conditions of Forex trading, including margin requirements, stop-losses, and other risk management tools.
Acknowledgment:
By engaging in Forex trading, you acknowledge that you have read, understood, and accepted this disclosure statement. You accept full responsibility for the outcomes of your trading decisions and agree to trade at your own risk.
This disclosure is intended to provide an overview of the risks associated with Forex trading and is not exhaustive. For additional information, consult your broker and other reliable financial resources.