
The Parabolic Stop and Reverse (PSAR) is a versatile Forex trading tool that combines momentum tracking with trailing stop-loss functionality in a single indicator.
Developed by Welles Wilder, the PSAR plots a series of dots above or below price bars to highlight potential changes in trend direction. These dots adapt dynamically to price volatility, providing traders with real-time insights into both trend strength and potential reversals.
In this guide, you’ll learn how the PSAR works, how to use it for entries and exits, and how to combine it with other technical tools like the LSMA trend indicator, Japanese candlestick patterns, chart patterns, and support/resistance levels for better trade timing and decision-making.
Summary: PSAR Forex Strategies at a Glance
This quick-reference table outlines the main applications of the PSAR and its integrations with complementary tools.
| Strategy | Signal Type | Confirmation Tools |
| PSAR Alone | Dot flip above/below price bars | Trend direction, volatility |
| PSAR + LSMA Trend Indicator | PSAR aligns with LSMA slope | LSMA up/down slope confirmation |
| PSAR + Candlestick Patterns | Reversal/continuation candlesticks | Hammers, Engulfing, Morning/Evening Star |
| PSAR + Chart Patterns | Breakouts or reversals | Triangles, Head & Shoulders |
| PSAR + Support & Resistance | Dot alignment with S/R levels | Horizontal or channel S/R validation |
TL;DR – Master These PSAR Combinations
This article will teach you how to:
- Use the PSAR to identify trend direction and trailing stop levels
- Combine PSAR with the LSMA trend indicator for higher-probability setups
- Confirm PSAR signals with Japanese candlestick patterns
- Enhance entries and exits using chart patterns and support/resistance levels
Table of Contents
- Summary: PSAR Forex Strategies at a Glance
- TL;DR – Master These PSAR Combinations
- What Is the PSAR Indicator and How Does It Work?
- Using PSAR with the LSMA Trend Indicator
- Enhancing PSAR Signals with Japanese Candlestick Patterns
- Using PSAR with Chart Patterns
- Combining PSAR with Support and Resistance Levels
- What’s the Next Step?
- Frequently Asked Questions
- Forex Trading Disclosure Statement
What Is the PSAR Indicator and How Does It Work?
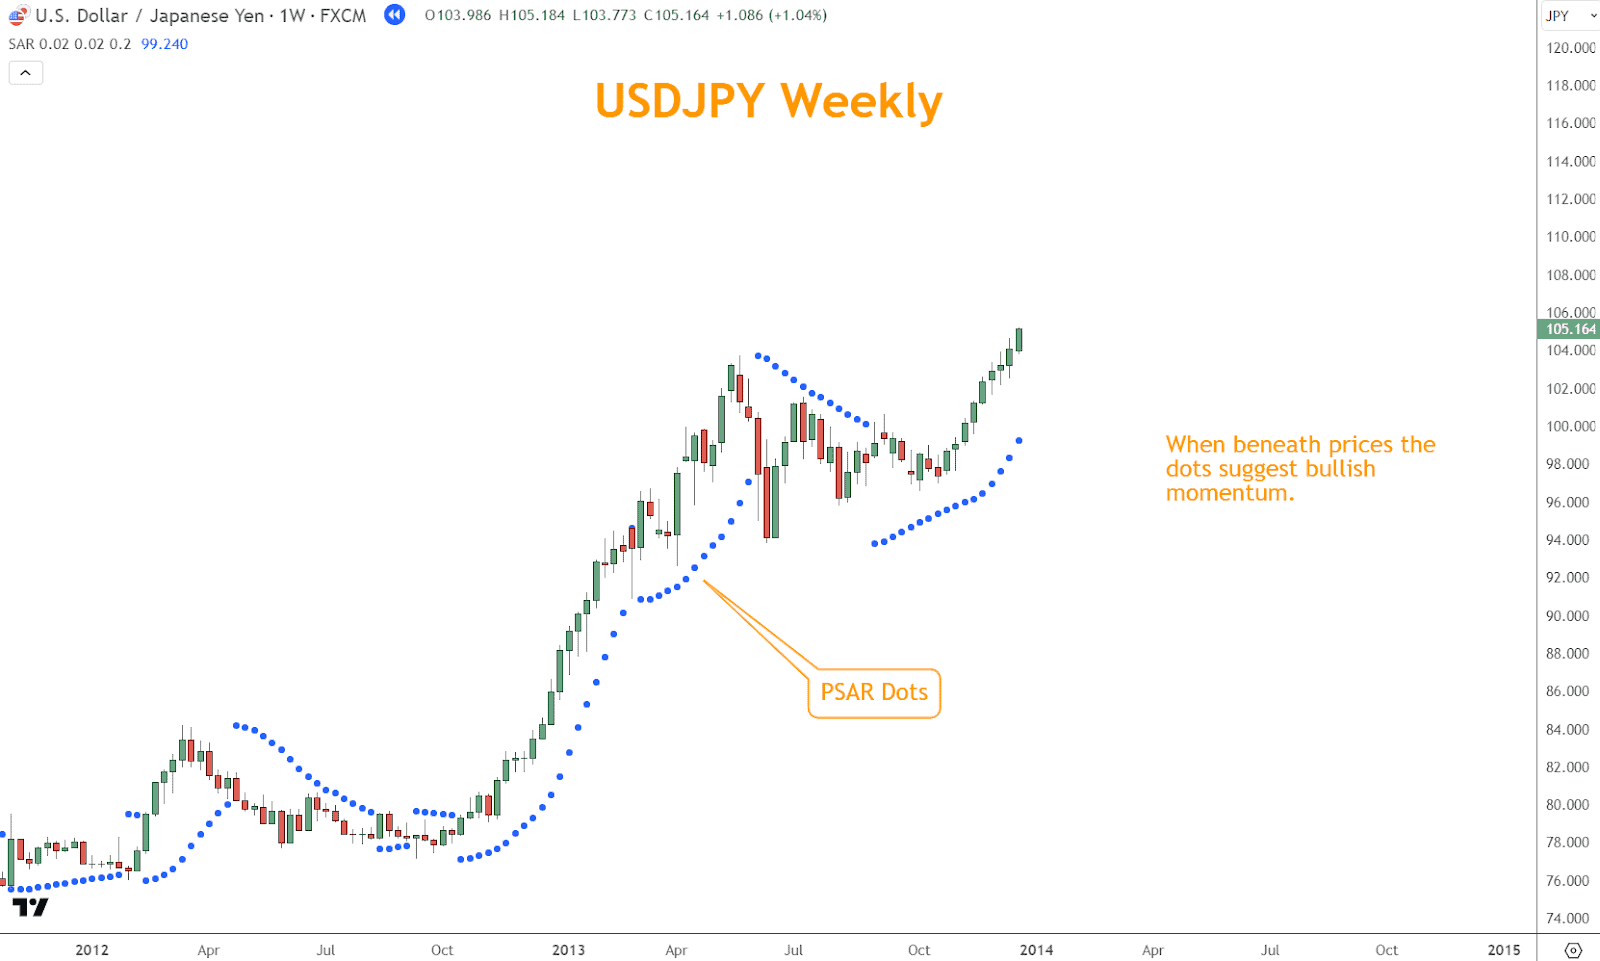
The PSAR is a trend-following and stop-and-reverse tool designed to track momentum and provide dynamic stop levels.
- Dots Below Price Bars → Indicate bullish momentum and potential support
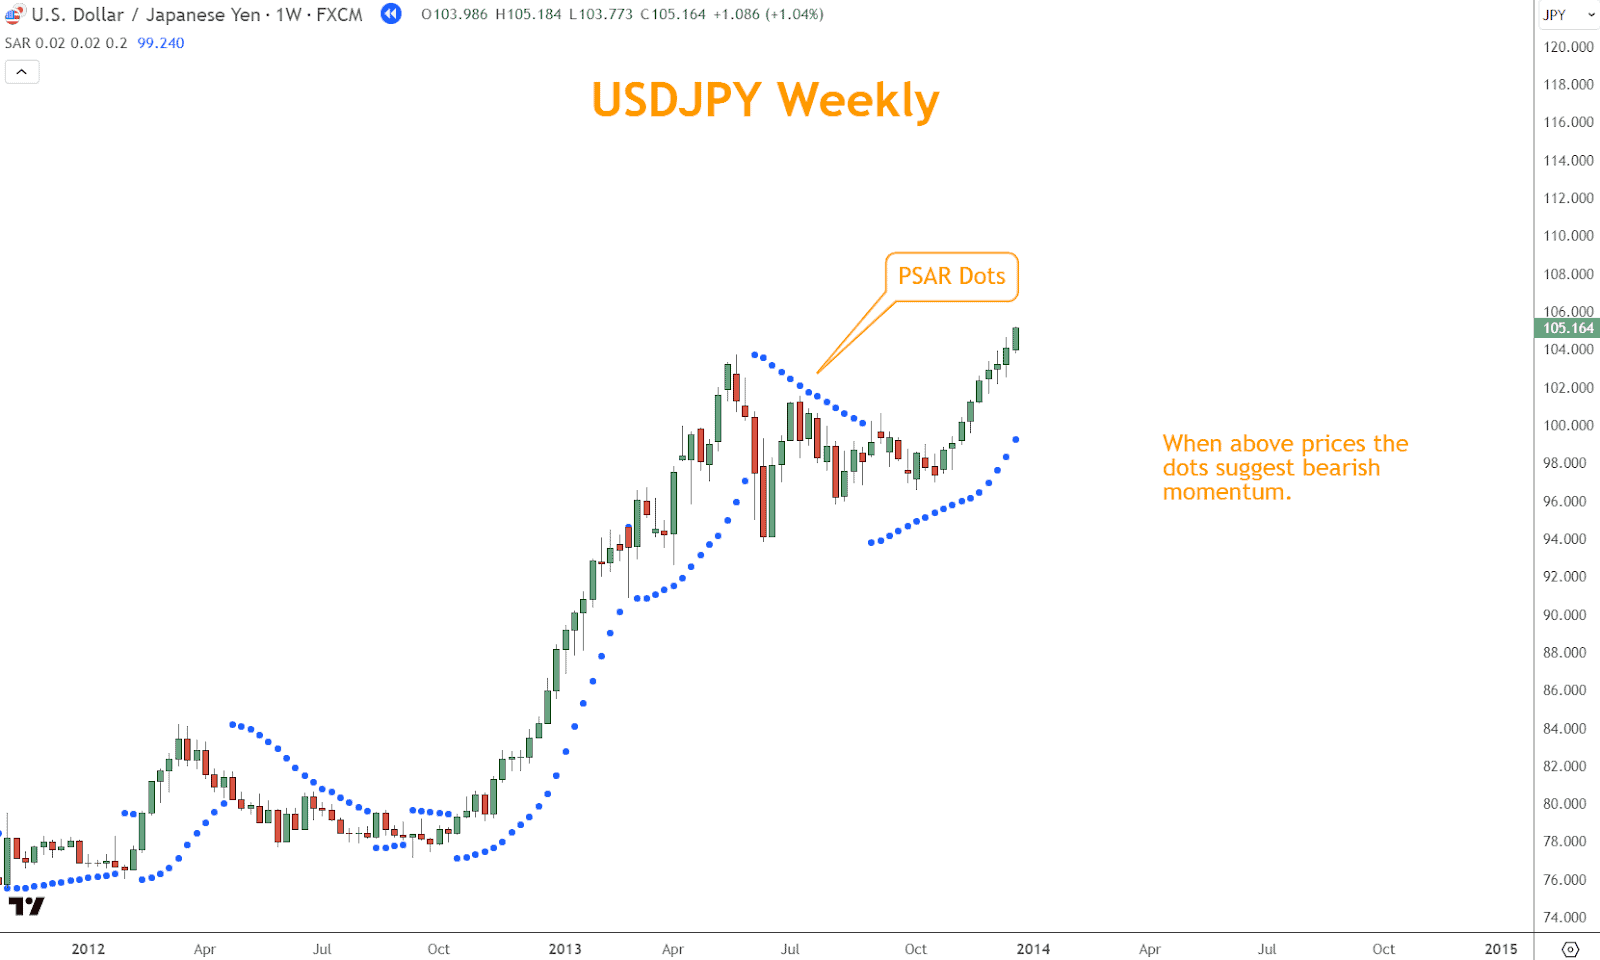
- Dots Above Price Bars → Indicate bearish momentum and potential resistance
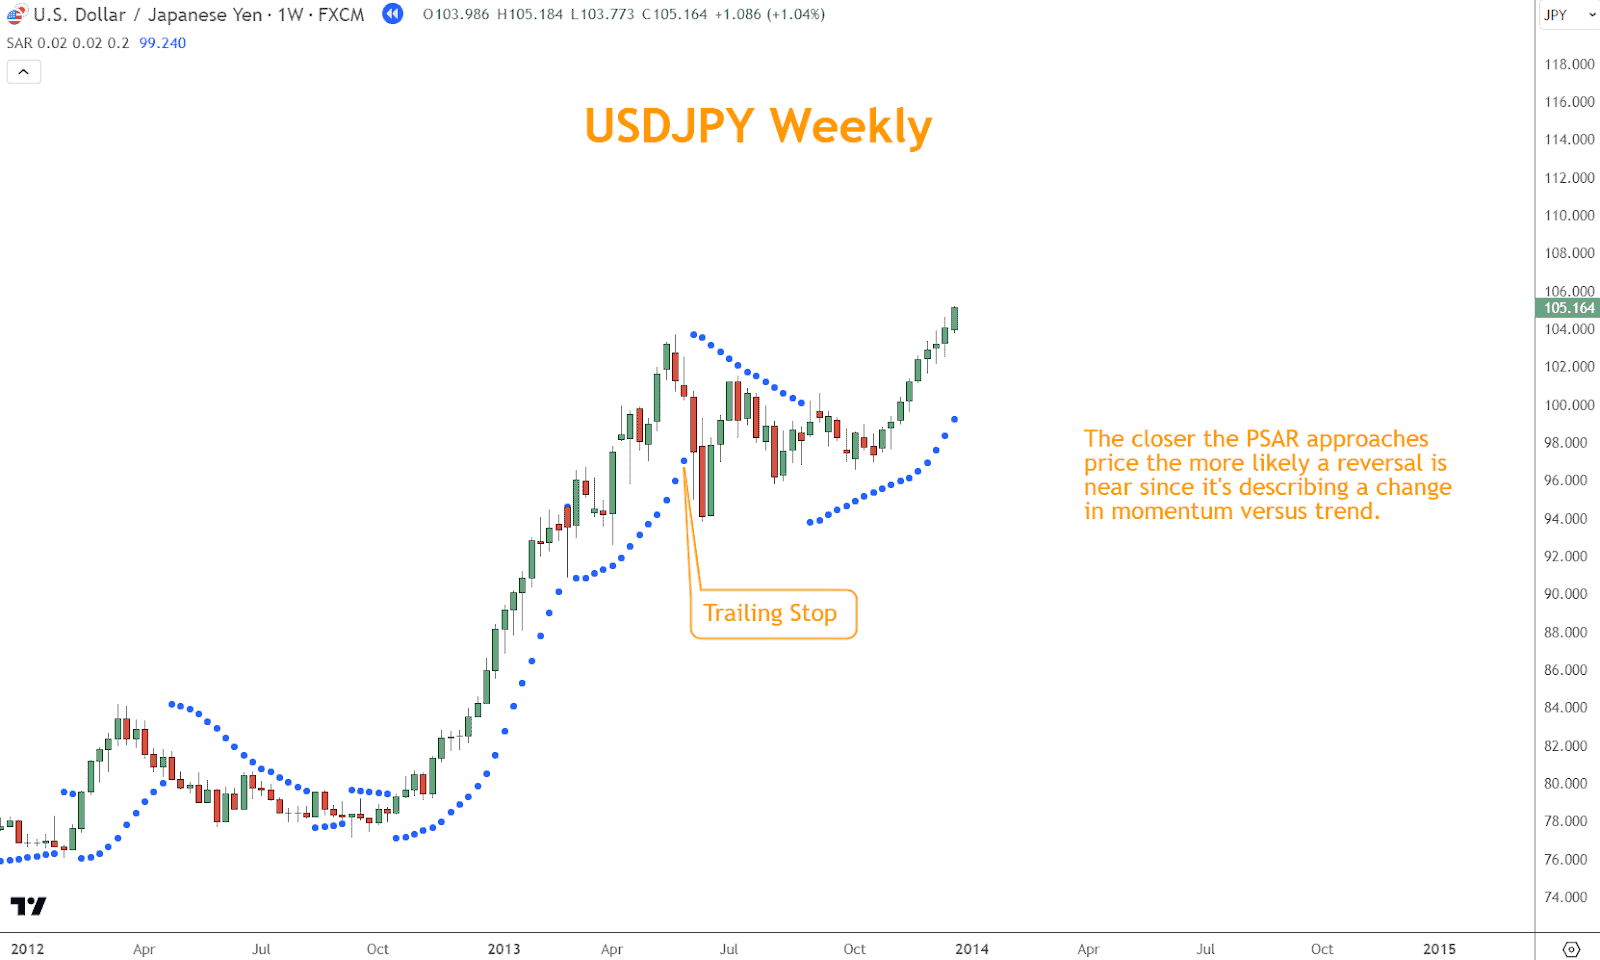
The spacing between dots changes with volatility — closer in calm markets, wider during high volatility. This makes it helpful in spotting both trend strength and possible reversals.
Example in Practice:
In a rally, the price pulling back near PSAR dots can signal a low-risk buying opportunity.
In a selloff, price moving up toward PSAR dots can signal a short-selling opportunity.
The PSAR can also function as a trailing stop, moving the stop level along with price to lock in gains while leaving room for the trade to run.
Using PSAR with the LSMA Trend Indicator
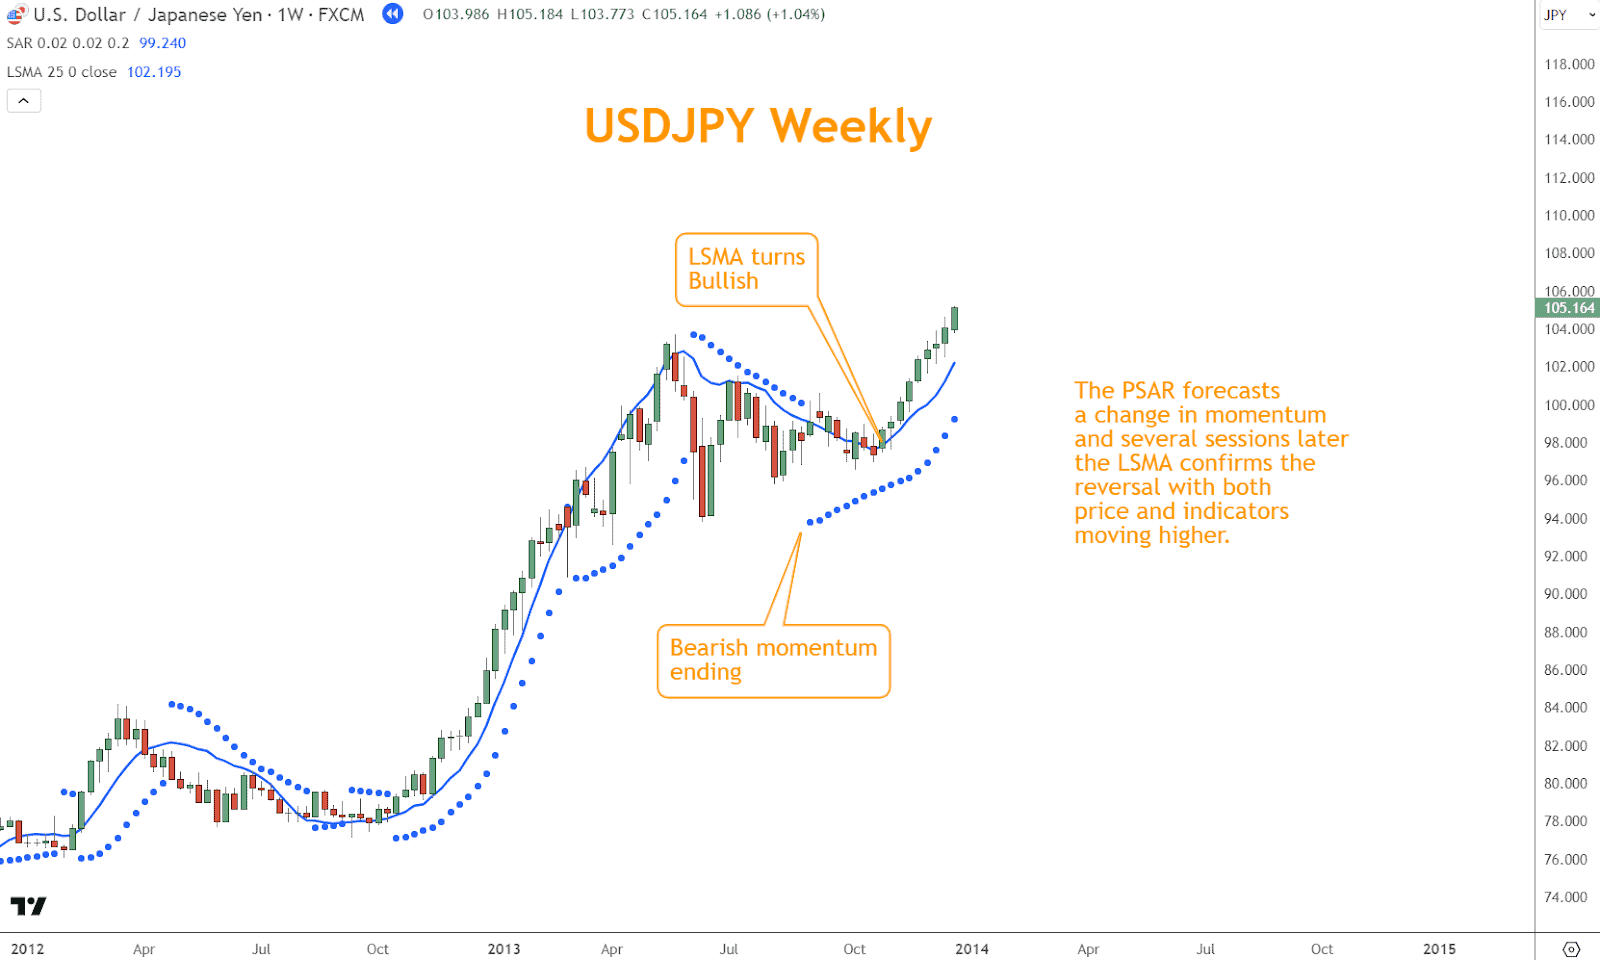
Integrating PSAR with the Least Squares Moving Average (LSMA) creates a robust, trend-confirming system. The LSMA calculates a linear regression line, smoothing out price noise to reveal the actual directional bias.
- Upward LSMA Slope + PSAR Dots Below Price → Strong bullish setup
- Downward LSMA Slope + PSAR Dots Above Price → Strong bearish setup
Example:
If PSAR dots flip below price and the LSMA slope turns upward within a few sessions, it reinforces the bullish reversal signal. This alignment boosts confidence in entries and helps filter false signals.
Looking for a Strategy?
Download the Six Basics of Chart Analysis and sign up for Forex Forecast to learn a bottom-up approach to analyzing Forex markets and weekly market updates.
Enhancing PSAR Signals with Japanese Candlestick Patterns
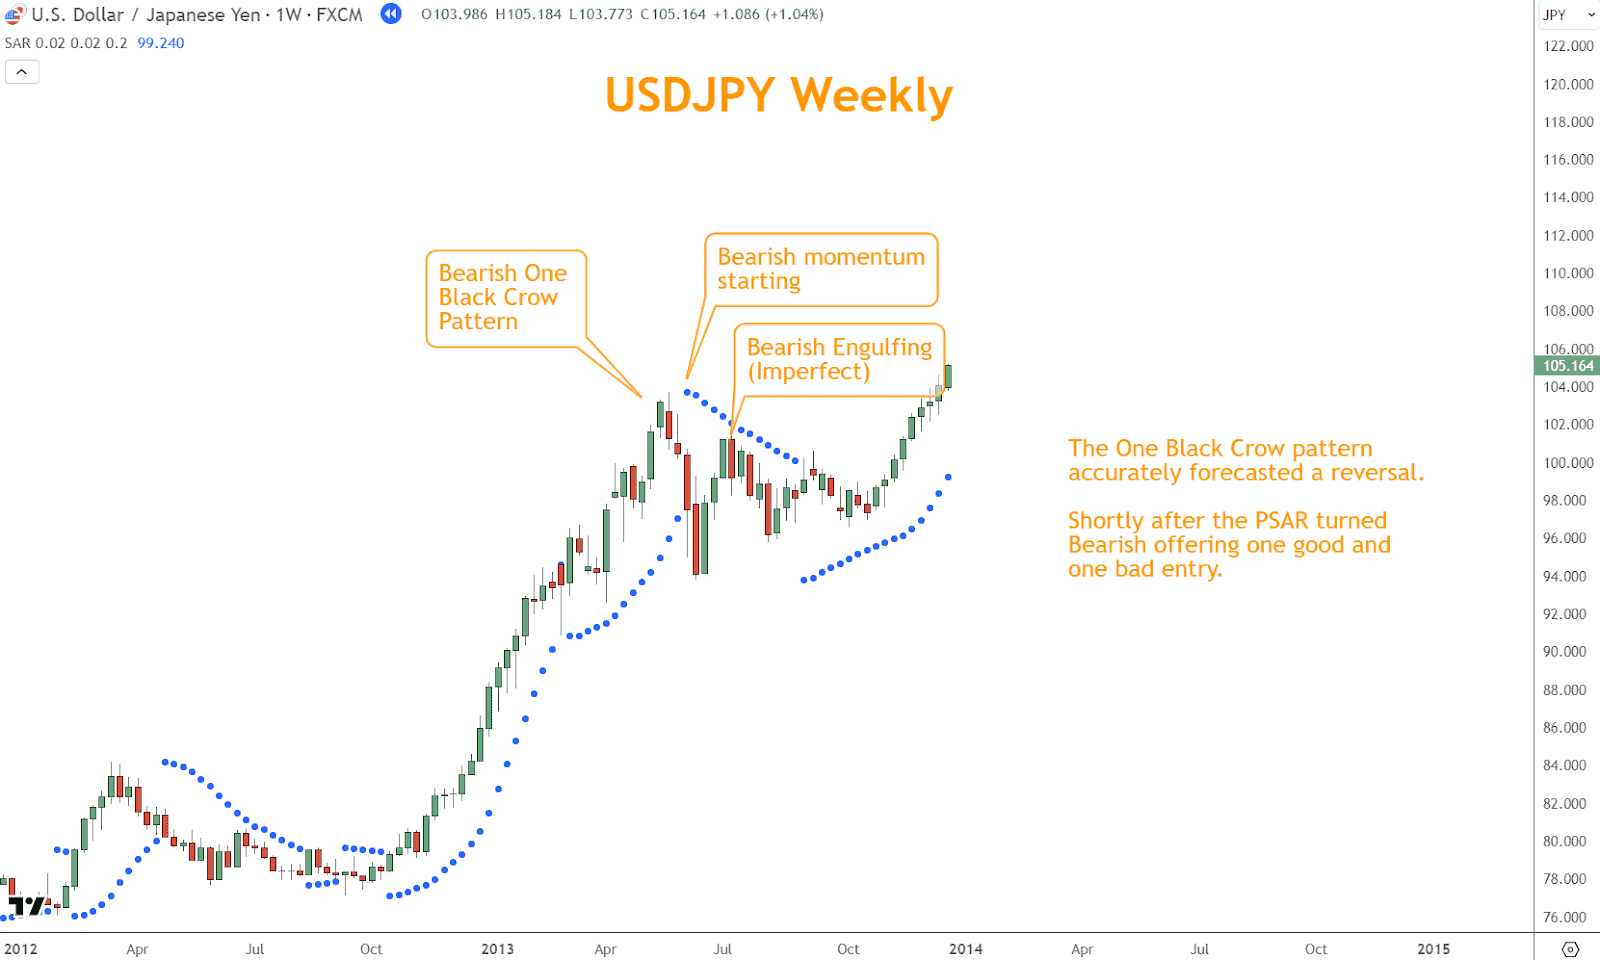
Japanese candlestick patterns add a layer of price action confirmation to PSAR signals. Each candlestick encapsulates market sentiment for its time period, revealing shifts between buyers and sellers.
- Bullish Patterns: Hammer, Bullish Engulfing, Morning Star
- Bearish Patterns: Shooting Star, Bearish Engulfing, Evening Star
Example:
A Bearish Engulfing pattern forming just before PSAR dots flip above price bars strengthens the case for a short entry. Conversely, a Hammer at support when PSAR dots remain below price reinforces a long setup.
Using PSAR with Chart Patterns
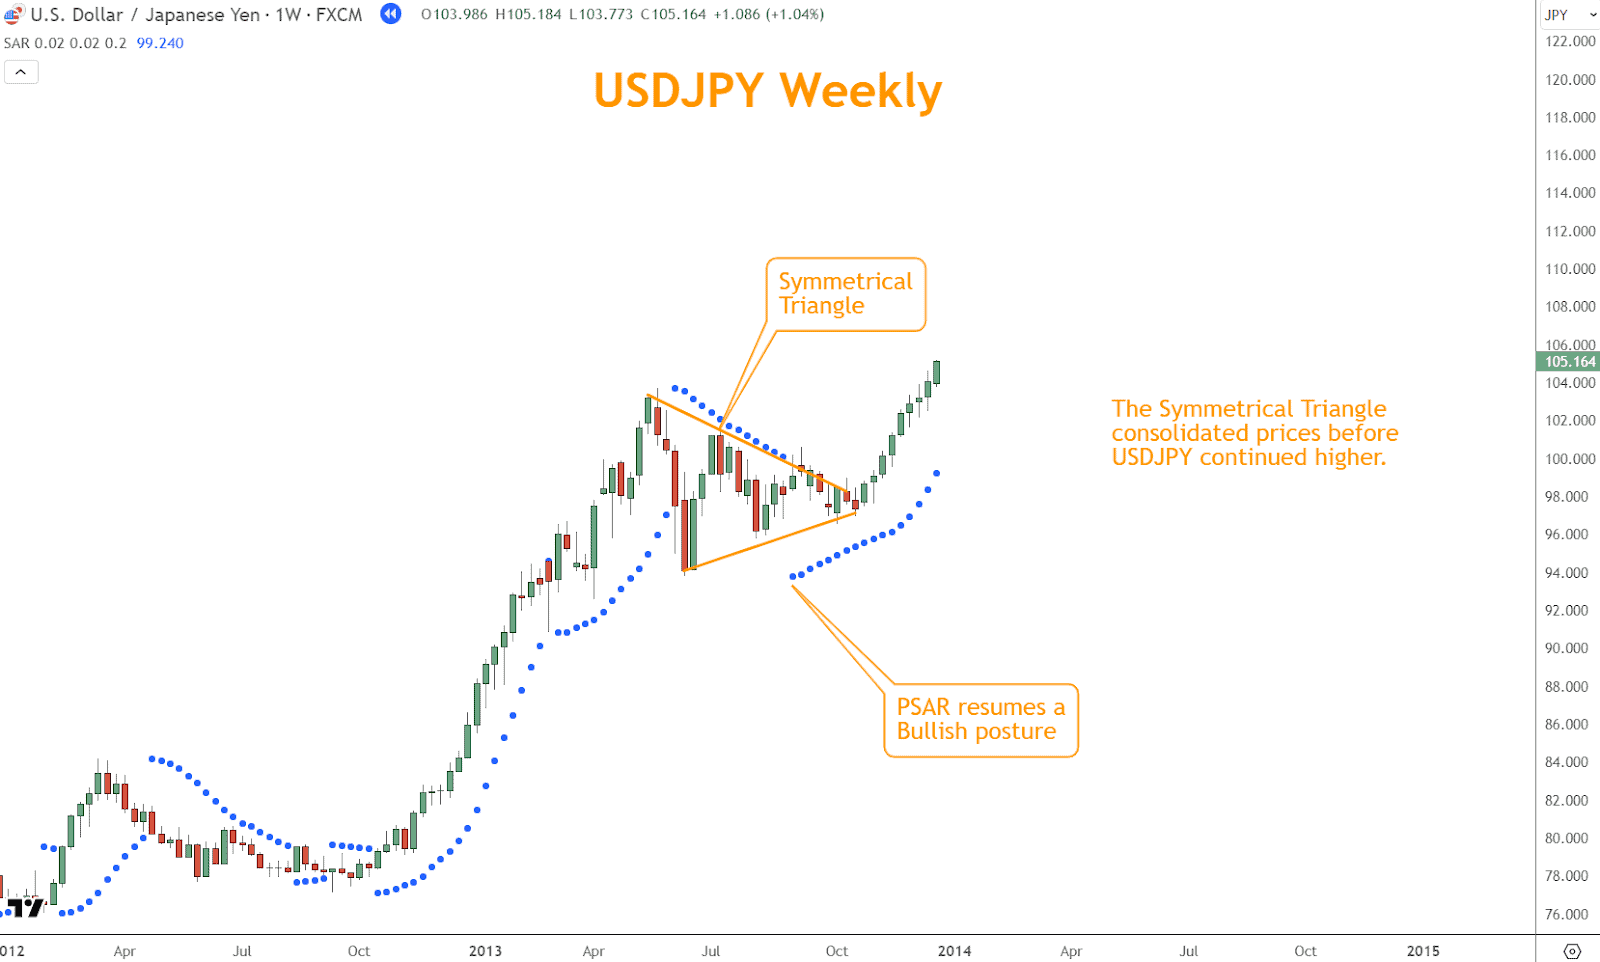
Chart patterns help identify market structure and potential breakouts or reversals. When combined with PSAR, they provide multi-layered confirmation.
- Continuation Patterns: Flags, Pennants, Triangles — PSAR aligns to confirm trend continuation.
- Reversal Patterns: Head & Shoulders, Double Tops/Bottoms — PSAR dot flip confirms reversal.
Example:
A Symmetrical Triangle breakout on USDJPY, with PSAR dots flipping below price at the breakout point, provides a strong long entry signal.
Combining PSAR with Support and Resistance Levels
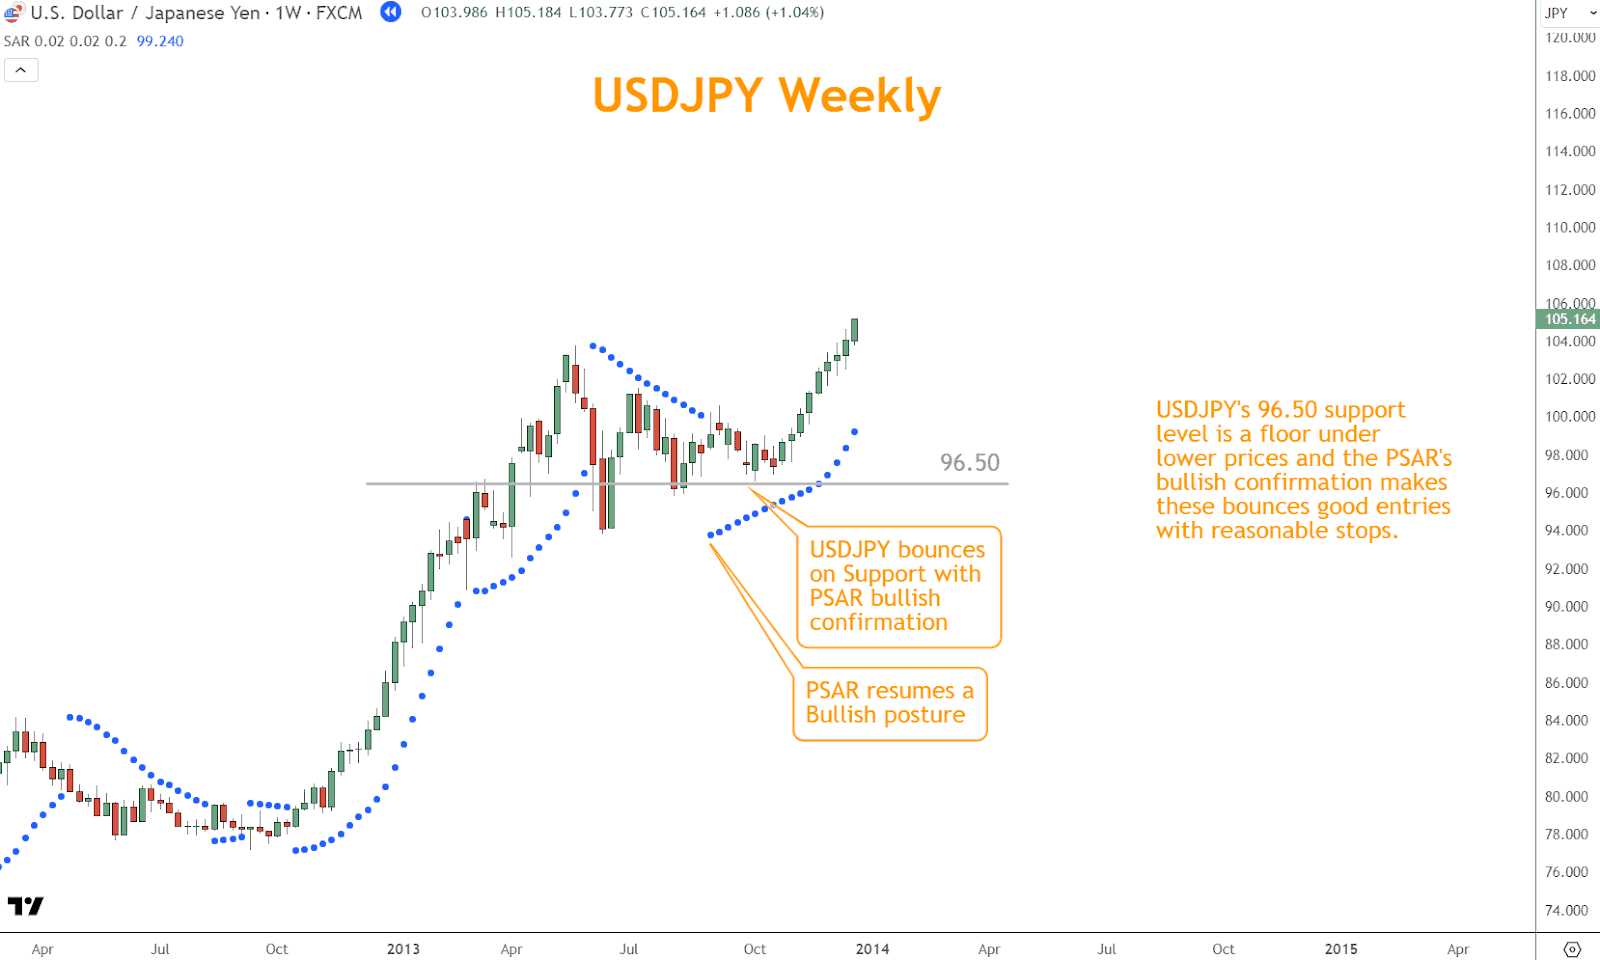
Support and resistance levels are critical decision zones where market sentiment often shifts. When PSAR signals align with these levels, the probability of a successful trade increases.
- Bullish Setup: Price bounces off support, PSAR dots remain below price.
- Bearish Setup: Price rejects resistance, PSAR dots remain above price.
Example:
USDJPY is holding at 96.50 support with bullish PSAR dots, offering an attractive buy entry with a well-defined stop just below the level.
What’s the Next Step?
- Apply PSAR to your charts and observe how it reacts in different market conditions.
- Test combinations with LSMA, candlestick patterns, chart patterns, and support/resistance.
- Keep a trading journal to track which combinations produce the best results.
If you need a structured approach to chart reading, download the Six Basics of Chart Analysis and subscribe to the Forex Forecast for weekly trade ideas, case studies, and educational content — all free.

Frequently Asked Questions
Q: What is the Parabolic Stop and Reverse, and why is it important?
A: It’s a technical indicator developed by Welles Wilder to spot momentum shifts and potential reversals in Forex markets.
Q: How does it work?
A: It places dynamic dots above or below price bars that adjust to volatility, acting as a trailing stop and momentum signal.
Q: How does LSMA improve PSAR signals?
A: LSMA confirms the prevailing trend, helping filter false reversals and improve entry accuracy.
Q: Can candlestick patterns enhance PSAR setups?
A: Yes. They validate PSAR signals, especially near key support or resistance levels.
Q: Why use support/resistance with PSAR?
A: It adds context, confirming whether a PSAR signal is occurring at a meaningful market level.
Forex Trading Disclosure Statement
Risk Warning:
Forex trading involves significant risk and may not be suitable for all investors. The leveraged nature of Forex trading can work both for and against you, leading to substantial gains or losses. Before trading Forex, you should carefully consider your financial objectives, experience level, and risk tolerance. It is possible to lose more than your initial investment, and you should only trade with money you can afford to lose.
Market Risks and Volatility:
Forex markets are influenced by global economic, political, and social events, which can result in unpredictable price movements. High market volatility can lead to sudden and substantial changes in currency values, potentially causing losses that exceed your initial deposit.
Leverage Risks:
Leverage amplifies both potential gains and potential losses. While leverage can increase profitability, it also increases the risk of significant losses, including the loss of your entire trading capital.
Trading Tools and Technology Risks:
Forex trading platforms, including those offered by brokers, are subject to technology risks, such as system failures, latency issues, and potential errors in price feeds. Traders should be aware that these risks can impact the execution of trades and trading outcomes.
No Guarantee of Profitability:
Past performance in Forex trading is not indicative of future results. There is no guarantee that you will achieve profits or avoid losses when trading Forex.
Educational Purposes Only:
Any information provided about Forex trading, including strategies, analysis, or market commentary, is for educational purposes only and should not be considered financial advice.
Regulatory Compliance:
Forex trading is regulated differently in various jurisdictions. Ensure that you are trading with a licensed and compliant broker in your country of residence.
Responsibility:
You are solely responsible for your trading decisions and the associated risks.
Acknowledgment:
By engaging in Forex trading, you acknowledge that you have read, understood, and accepted this disclosure statement.