Price exhaustion is a crucial concept in Forex trading you will use to identify reversals.
It refers to a point in the market where a prevailing direction has reached a state of depletion, suggesting a potential reversal in the near future.
You should learn to identify this circumstance to help you make informed trading decisions, manage risk effectively, and take advantage of profitable opportunities.
This article will explore this concept, understand its significance, and learn how to identify and trade based on this phenomenon.
What are the Dynamics of Price Exhaustion?
This occurs when a currency pair experiences a sustained Rally or Selloff, and the market participants, driven by fear, greed, or news events, push prices to unsustainable levels.
In simpler terms, it’s like a rubber band being stretched to its limit; at some point, it will snap back to its original state. In the Forex market, this “snapback” often leads to a reversal in price direction, creating opportunities for you to profit.
There are two primary forms:
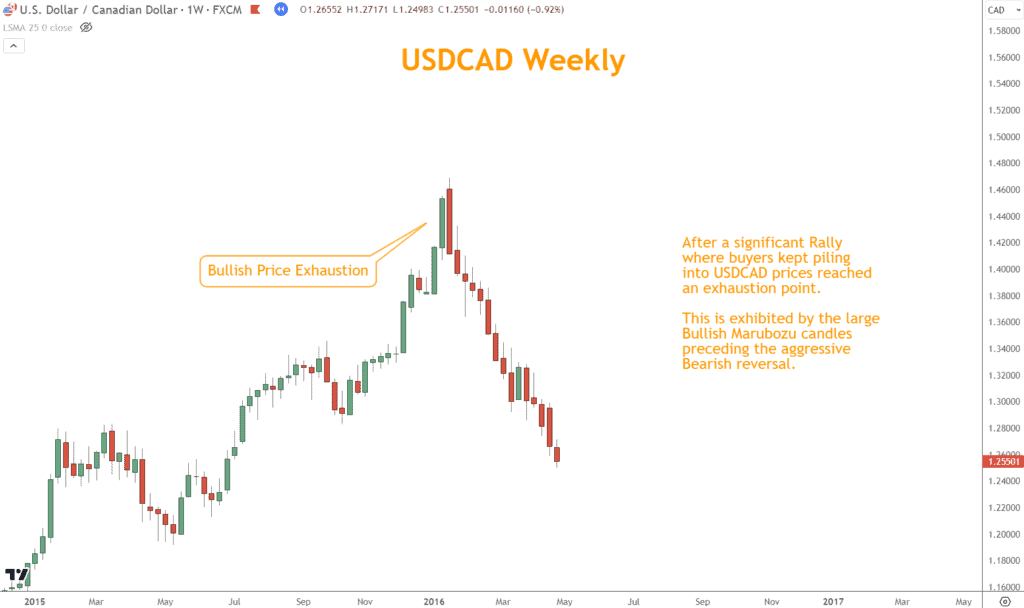
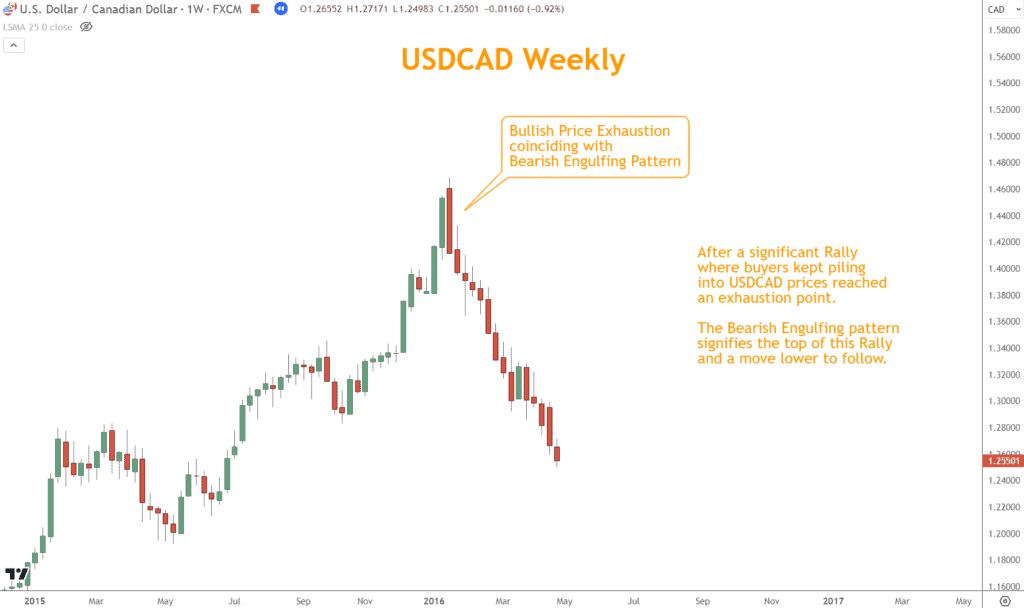
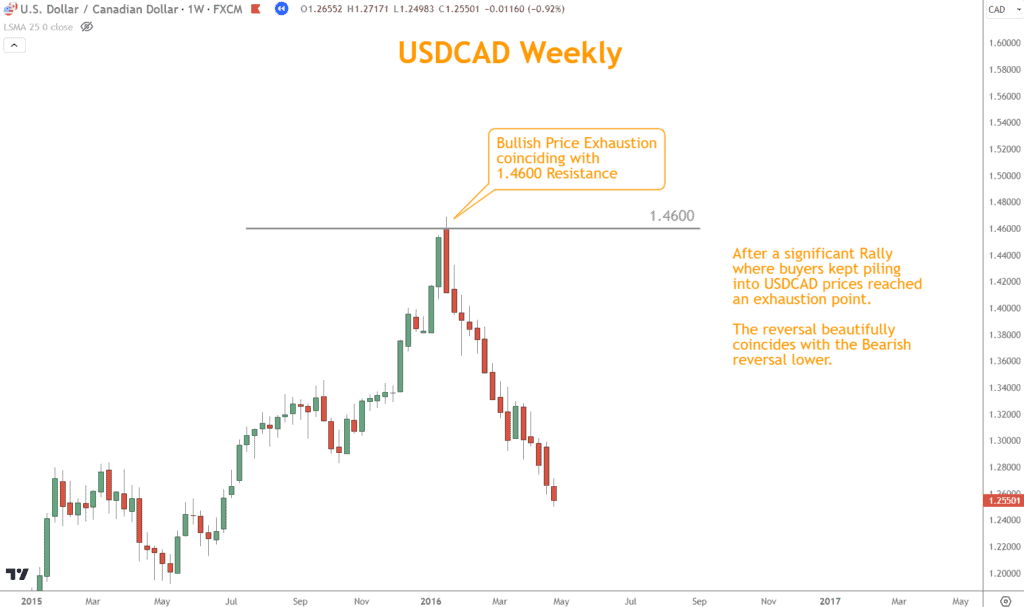
- Bullish Price Exhaustion occurs after a prolonged Rally when buyers become exhausted, and there is a diminishing interest in buying the currency pair at higher prices. It can be a precursor to a reversal from Bullish to Bearish.

- Bearish Price Exhaustion occurs after a prolonged selling period. When this happens, sellers become tired and lose interest in selling the currency pair at lower prices. This can signal an upcoming reversal from a Selloff to a Rally.
How to Identify Exhaustion?
While it’s not an exact science, several technical and fundamental indicators can help traders spot potential exhaustion points:
- Candlestick patterns are visual representations of price movements that can offer valuable insights into market sentiment. Here are some common candlestick patterns associated with exhaustion:
- Doji Candles: Doji candles are characterized by their tiny bodies and lengthy wicks, indicating that the market is indecisive. They often appear at the end of trends, signifying a potential shift in sentiment.
- Shooting Star: A shooting star candlestick has a small body near the bottom of the price range, with a long upper wick. It suggests buyers initially pushed the price higher but failed to maintain control, potentially signaling a reversal.
- Engulfing Patterns: An Engulfing pattern occurs when one candle engulfs the previous one. A Bullish Engulfing pattern in a downtrend or a Bearish Engulfing pattern in an uptrend can indicate a possible reversal.

- Relative Strength Index (RSI): The Relative Strength Index (RSI) is a widely used Momentum oscillator that measures the speed and change of price movements.
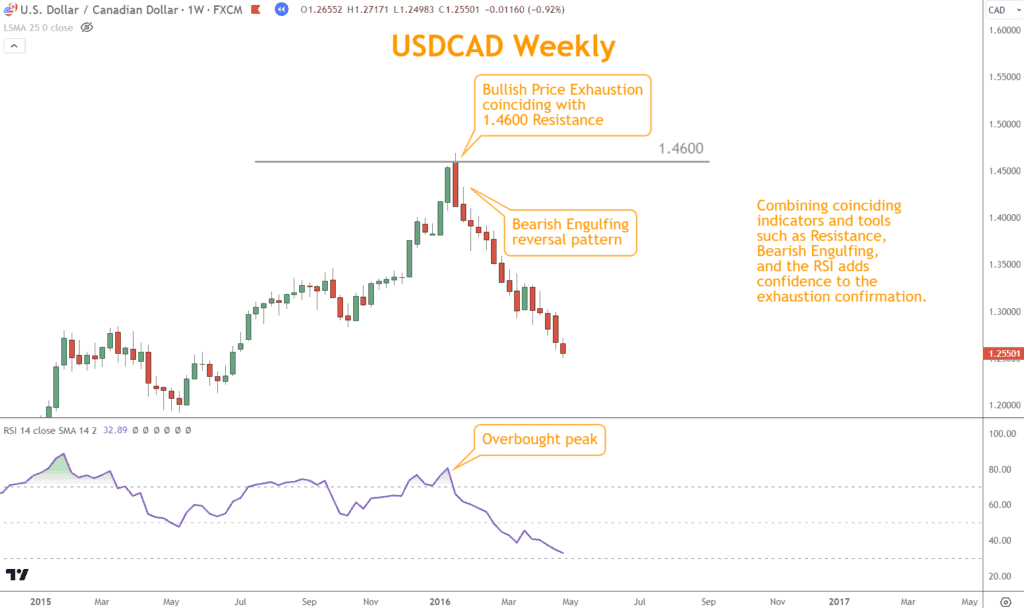
- It oscillates between 0 and 100 and helps traders identify Overbought and Oversold conditions. When the RSI rises above 70, it suggests that the currency pair may be Overbought, potentially indicating an imminent reversal. Conversely, an RSI reading below 30 suggests oversold conditions and the possibility of a Bullish reversal.
- Moving Averages: Moving averages are essential tools for directional analysis.
- They help smooth out price data, making identifying direction and potential exhaustion points easier. When a currency pair’s price deviates significantly from its moving average, it can indicate an overextended Rally or Selloff. Traders often watch for a price pullback or reversal when this occurs.
- Golden Cross and Death Cross: These are specific moving average crossover patterns.
- A golden cross happens when a short-term moving average crosses above a long-term moving average, indicating a potential Bullish reversal. Conversely, a death cross occurs when a short-term moving average crosses below a long-term moving average, suggesting a potential Bearish reversal.
- Support and Resistance Levels: Support and Resistance are essential technical analysis components.
- These levels are formed based on previous price action and represent areas where the price tends to stall or reverse. When the price approaches a significant Resistance level during a Rally or a strong Support level during a Selloff, it may signal a potential exhaustion point. You can look for price rejection or consolidation near these levels.

- Fundamental Factors: Fundamental factors can play a significant role, too.
- Keep an eye on economic releases, central bank decisions, and geopolitical events that can impact the Forex market. For example, a surprise interest rate decision by a central bank can lead to a swift market reaction.
It’s important to note that no single indicator or method is foolproof.
You can use a combination of these techniques to increase the accuracy of their signals.
Moreover, understanding the broader market context, including global economic conditions and geopolitical events, can help you make more informed decisions regarding identifying and acting upon price exhaustion in the Forex market.
What are Trading Strategies I can Apply?
Now that we understand how to identify exhaustion let’s explore some trading strategies to maximize this phenomenon.
- Reversal Trading: Once you’ve identified signs of exhaustion, consider trading in the opposite direction of the prevailing direction.
- For example, in a Bullish scenario where the Rally is losing steam, you may contemplate short-selling the currency pair. However, waiting for confirmation through additional technical indicators or patterns is crucial before entering such a trade. This confirmation helps minimize the risk of entering prematurely, as false signals can occur.
- Conversely, in the case of a Bearish scenario during a Selloff, you might look for opportunities to buy the currency pair. Again, patience and confirmation are essential, as timing your entry can significantly impact your trade’s success.
- Use Stop-Losses: Since reversals can be swift and unpredictable, having a predefined exit point helps protect your capital. Determine a stop-loss level that aligns with your risk tolerance and trading strategy. Placing your stop-loss just beyond when these signals are invalidated can help you limit potential losses.
- Combine Multiple Indicators: To increase the reliability of your signals, consider combining technical indicators and patterns.
- For instance, if you identify Bearish price exhaustion through an overextended RSI reading and a Shooting Star candlestick pattern in a Selloff, the confluence of these signals enhances your confidence in the trade.

Always strive for a well-rounded analysis incorporating various technical and fundamental aspects to corroborate your trading decisions.
- Practice Risk Management: Trading based on exhaustion should always accompany a sound risk management strategy. This includes setting a Risk-Reward Ratio.
- Determine the ratio between the potential profit and the acceptable loss for each trade. A commonly used ratio is 2:1, where you aim to make twice the amount you want to lose.
- Avoid Over-Leveraging: Over-leveraging can magnify gains and losses, harming your trading account. Ensure that your leverage is within manageable limits.
- Stay Informed: Exhaustion can be triggered by sudden news events or economic releases.
- Stay informed about upcoming events that could impact the Forex market. Economic calendars and news feeds can help you anticipate and react to unexpected developments. Always have a plan in place for handling high-impact news events.
- Continuous Learning and Adaptation: The Forex market is dynamic and ever-evolving. Successful traders continuously learn and adapt to changing market conditions.
- Keep a trading journal to document your trades and review your decisions. Analyze both winning and losing trades to identify areas for improvement. Be open to adjusting your strategy based on market behavior.

Trading based on exhaustion is valuable for anyone looking to capitalize on potential reversals.
However, it requires technical analysis, risk management, and continuous learning.
While there is no foolproof strategy, patient, disciplined, and well-informed traders can use these signals as a valuable tool in their trading.
Conclusion
Price exhaustion is a fundamental concept in Forex trading that can significantly influence your trading success.
By understanding when a Rally or Selloff is nearing its end and being prepared for potential reversals, you can make more informed trading decisions and better manage your risk.
Remember that no strategy is foolproof, and there will be occasions when these signals fail.
However, with practice, patience, and a solid risk management plan, you can leverage this technique to your advantage and improve your overall trading performance.
What’s the Next Step?
Select a chart and consider where price exhaustion occurs and how you can profit from it.
In addition, look for opportunities to incorporate multiple indicators in your analysis.
Once you’re ready to trade, choose a strategy and process you believe will work for you.
If you need help developing an analysis process, you can use our Six Basics of Chart Analysis. If you’re unfamiliar with the Six Basics, you can learn them here for free.
The “Six Basics” will give you a strong foundation in chart analysis, which you can incorporate with what you’ve learned about “price exhaustion”
In addition, when you get the “Six Basics,” you’ll also get Forex Forecast delivered to your inbox every Sunday.
Forex Forecast includes:
- Trade Ideas and Analysis
- I will show you the trade opportunities I’m watching using the Six Basics of Chart Analysis and Advanced Strategies.
- Case Studies from Around the Web
- Watch how applying the Six Basics worked on some of the best, most profitable trades.
- Trading Education Guides and Videos
- Want to learn most Six Basics techniques and advanced strategies?
- I produce Videos and Guides to help you learn and build a better trading practice.
- Links to New Articles
- I publish new articles on topics traders will want to know about every week, and you can find out when they post.
- Positionforex.com News
- Did something change at positionforex.com? Learn about it here first!
- Links to upcoming webinars
- Attend free webinars to improve your trading.
- And Much More
- Tools, Membership-only Videos, and more will be released in the Forex Forecast.
The best part – it’s completely free.

Frequently Asked Questions
What is Price Exhaustion in Forex Trading?
Forex trading refers to a situation where a prevailing direction in a currency pair has reached a state of depletion, indicating a potential reversal in the near future.
It occurs when market participants, driven by fear, greed, or news events, push prices to unsustainable levels, leading to a point where the trend may reverse.
How can I Identify it in the Forex Market?
Various methods can be used, including:
- Recognizing specific candlestick patterns such as Doji candles, Shooting Stars, or Engulfing patterns.
- Monitoring technical indicators like the Relative Strength Index (RSI) for Overbought or Oversold conditions.
- Observing deviations from moving averages, looking for potential overextended Rallies or Selloffs.
- Identifying significant Support and Resistance levels where price may stall or reverse.
- Staying informed about fundamental factors that can trigger exhaustion, such as economic data releases and news events.
- Analyzing trading volume for signs of weakening momentum.
What Trading Strategies Can I Use?
There are several trading strategies you can employ including:
- Reversal trading: Entering trades in the opposite direction of the prevailing trend after confirming signals.
- Implementing stop-losses to protect your capital.
- Combining multiple indicators and patterns for stronger confirmation.
- Practicing risk management by setting risk-reward ratios and avoiding over-leveraging.
- Staying informed about economic events and news releases.
Is It a Guaranteed Signal for a Reversal?
No, it isn’t a guaranteed signal for a reversal.
It’s a probabilistic indication based on various technical and fundamental factors.
You should exercise caution and use this signal with other confirmation methods. Risk management is essential to protect against false signals and unexpected market movements.
How can I Improve my Ability to Identify and Trade Based on These Signals?
Improving your ability to identify and trade requires continuous learning and practice. Here are some tips:
- Study and understand various technical indicators and candlestick patterns.
- Keep up-to-date with market news and economic events.
- Maintain a trading journal to review your trades and learn from your experiences.
- Backtest your strategies using historical data.
- Consider seeking guidance from experienced traders or mentors.
- Be patient and disciplined in your trading approach, and adapt to changing market conditions.

