

Overbought and oversold conditions are foundational concepts in Forex trading, helping traders identify when a market may be losing strength or preparing to reverse.
Momentum indicators reveal the speed and force behind price movements, giving you an early look at when a trend may be stretched too far.
By pairing these readings with reliable confirmation tools, you can transform basic signals into high-probability trading opportunities.
This guide explains exactly how overbought and oversold work, how the leading indicators behave, and how to confirm these conditions for better accuracy.
On their own, these alerts can be misleading, but when combined with Japanese Candlesticks, Chart Patterns, and Support/Resistance, they become powerful components of a complete trading strategy.
Quick Reference Table: Overbought, Oversold, and Major Indicators
| Indicator | Overbought Level | Oversold Level | Best Use Case |
| RSI | Above 70 | Below 30 | Trend exhaustion and momentum shifts |
| Stochastic Oscillator | Above 80 | Below 20 | Range-bound or sideways markets |
| CCI | Above +100 | Below -100 | Detecting price deviation from historical averages |
TL;DR – How to Use Overbought and Oversold the Right Way
To improve your trading using momentum indicators:
- Identify extreme levels with RSI, Stochastic, or CCI
- Never trade solely on overbought/oversold readings
- Confirm with Japanese Candlestick Patterns
- Strengthen confirmation using chart patterns
- Validate using support & resistance
This combined approach dramatically reduces false signals and enhances trade precision.
Table of Contents
- Quick Reference Table: Overbought, Oversold, and Major Indicators
- TL;DR – How to Use Overbought and Oversold the Right Way
- What Are Momentum Indicators For?
- What Do Overbought and Oversold Mean?
- How Important Are Momentum, Overbought, and Oversold Indicators?
- Indicator Breakdown: RSI, Stochastic, and CCI
- Three Tactics to Confirm Overbought and Oversold Conditions
- Tactic 1: Japanese Candlestick Patterns
- Tactic 2: Chart Patterns
- Tactic 3: Support and Resistance
- Is It Flawless? What’s the Downside?
- What Can You Take Away From This?
- What’s the Next Step?
- Frequently Asked Questions
- Forex Trading Disclosure Statement
What Are Momentum Indicators For?
Momentum indicators measure the speed, strength, and intensity behind price movements.
They show whether buyers or sellers are gaining or losing force and help you understand when a trend is accelerating or weakening.
Tools like RSI, CCI, and the Stochastic Oscillator offer a clearer read on market sentiment—helping you identify areas where price may reverse, pause, or continue.
When used appropriately, momentum indicators can help you time entries and exits more effectively.
What Do Overbought and Oversold Mean?
Overbought and Oversold describe conditions where the price may have moved too far in one direction.
- Overbought means the price has surged quickly and may soon decline.
- Oversold means the price has dropped sharply and may rebound.
These concepts can help you gauge if an asset is trading at a fair price or is due for a change in direction.
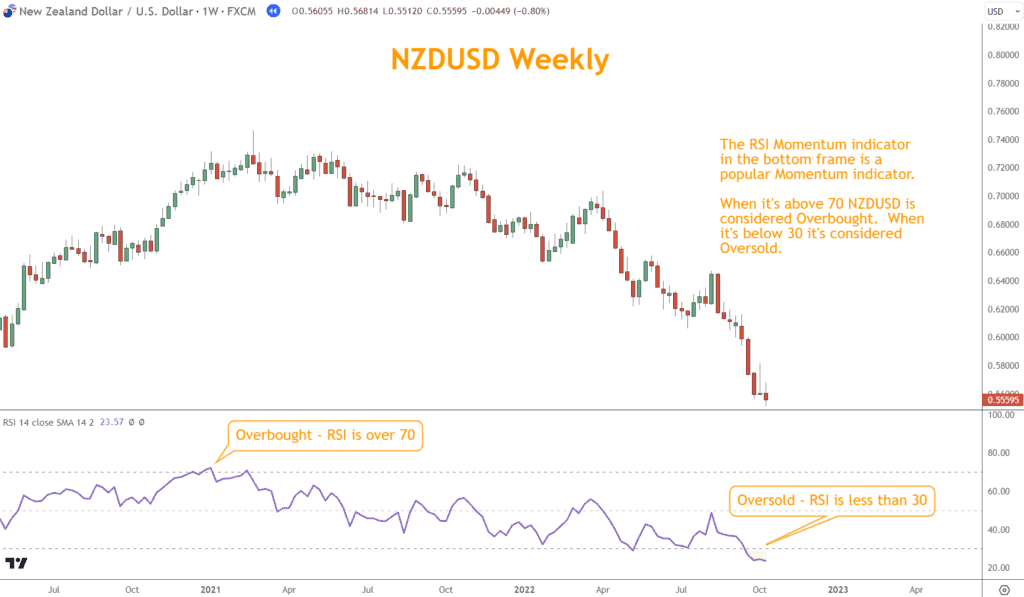
The NZD/USD chart below illustrates overbought and oversold status relative to price.
Think of these levels like a stretched rubber band: the more extreme the stretch, the stronger the potential snapback.
These extremes are not guarantees, but powerful signals that the current move may be losing momentum.
How Important Are Momentum, Overbought, and Oversold Indicators?
Momentum indicators help you understand both direction and force behind price.
If the price continues to rise while momentum slows, it suggests the move’s underlying strength is fading. If momentum rises in a falling market, it may hint at an impending reversal.
One of the most powerful momentum signals is divergence—when price and the indicator move in opposite directions. Divergence often signals a weakening trend and can act as an early warning before the market turns.
Indicator Breakdown: RSI, Stochastic, and CCI
Relative Strength Index (RSI)
RSI ranges from 0 to 100 and shows whether momentum is strong or weakening.
- RSI above 70: Possible Overbought zone
- RSI below 30: Possible Oversold zone
Look at the divergence example below.
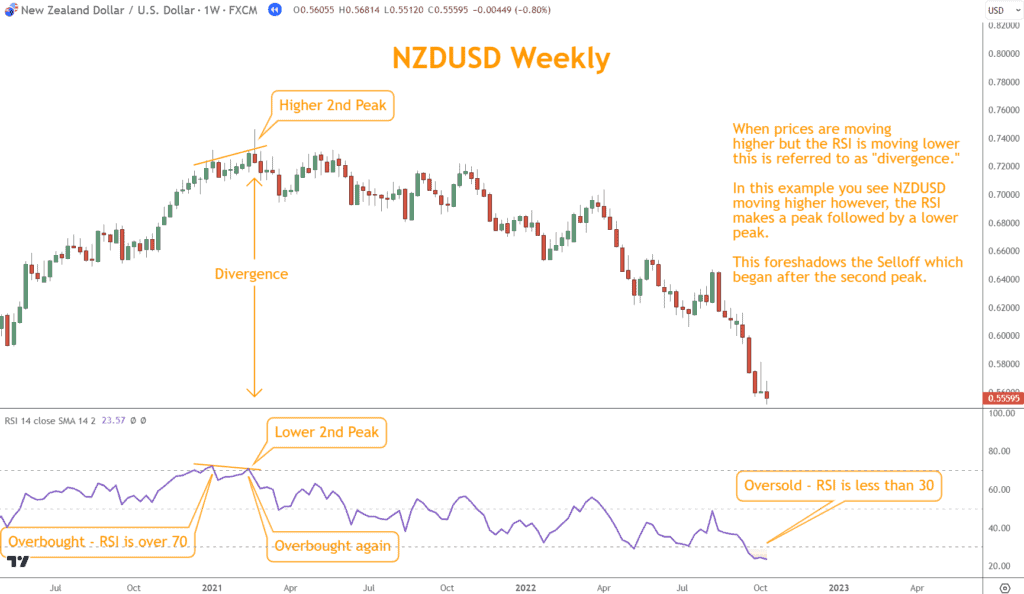
RSI offers a straightforward read on market strength, but extreme readings alone are not enough to justify an entry. Confirmation is essential.
Stochastic Oscillator
The Stochastic Oscillator compares the closing price to its recent price range.
- Readings above 80: Potential Overbought
- Readings below 20: Potential Oversold
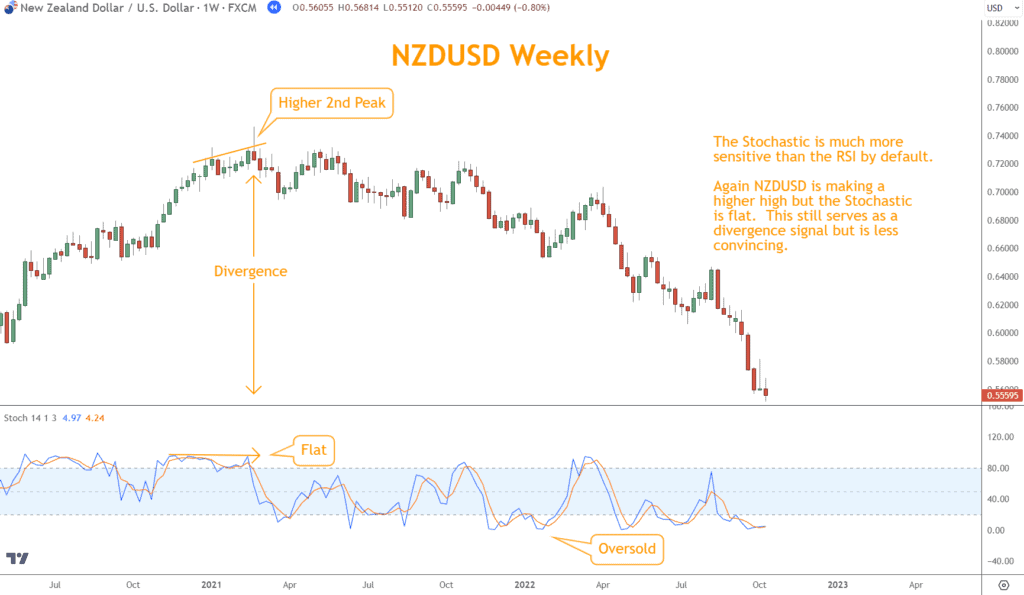
Stochastic performs exceptionally well during sideways markets where reversals tend to occur near extremes. Combined with patterns or key levels, it becomes a reliable reversal tool.
Looking for a Strategy?
Download the Six Basics of Chart Analysis and sign up for Forex Forecast to learn a bottom-up approach to analyzing Forex markets and weekly market updates.
Commodity Channel Index (CCI)
CCI measures how far the price has moved from its average.
- Above +100: Potential Overbought
- Below -100: Potential Oversold
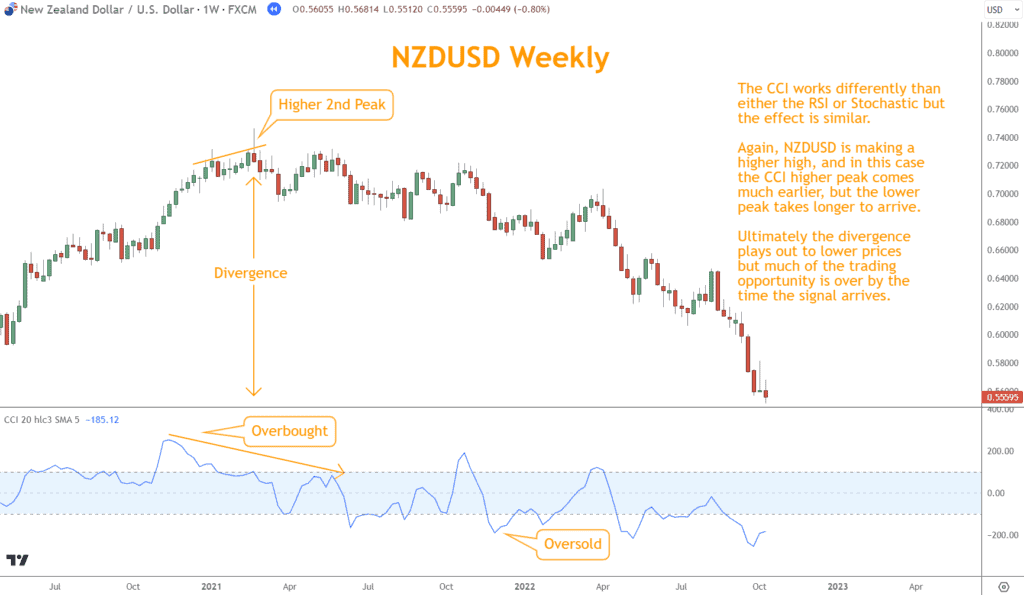
Because CCI is not limited to 0–100, it captures more subtle price deviations and can reveal early shifts in momentum. A divergence between price and CCI often signals a more pronounced trend change.
Three Tactics to Confirm Overbought and Oversold Conditions
Overbought and Oversold signals are valuable, but acting on them alone is risky. The following three confirmation tactics help validate momentum extremes before you trade.
Tactic 1: Japanese Candlestick Patterns
Momentum shows potential weakness, while candlestick patterns show actual shifts in buyer and seller behavior. When both agree, the reversal probability increases dramatically.
Examples:
- Overbought + Evening Star = Strong Bearish reversal potential
- Oversold + Morning Star = Strong Bullish reversal potential
For instance, if your momentum indicator suggests an overbought condition and you spot a bearish candlestick pattern such as a Shooting Star, it can reinforce the idea that a price reversal is imminent.
This combination allows you to gauge the market’s momentum and visualize the psychology behind price movements, offering a more holistic view of potential market turns as seen in the NZD/USD chart below.
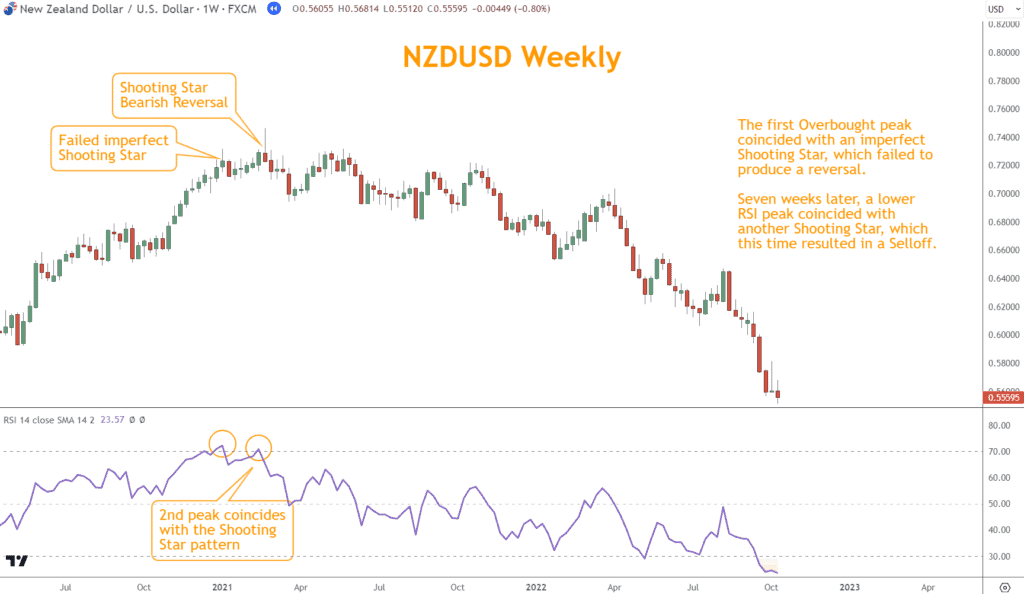
Candlestick confirmation helps ensure you’re not reacting to momentum extremes too early.
Tactic 2: Chart Patterns
Chart patterns reveal broader market structure and trend behavior. When they align with overbought or oversold conditions, the reversal case becomes much stronger.
Examples:
- Double Top forming in an overbought zone
- Double Bottom forming in an oversold zone
- Head and Shoulders near an overbought level
For example, suppose you identify a forming “Bearish Rising Wedge” pattern (which typically signals a Bearish reversal) in an Overbought zone.
In that case, it can strengthen your conviction that the price might drop soon.
By marrying these two tools, you can enhance their predictive accuracy, making more informed decisions based on the broader landscape and the immediate momentum.
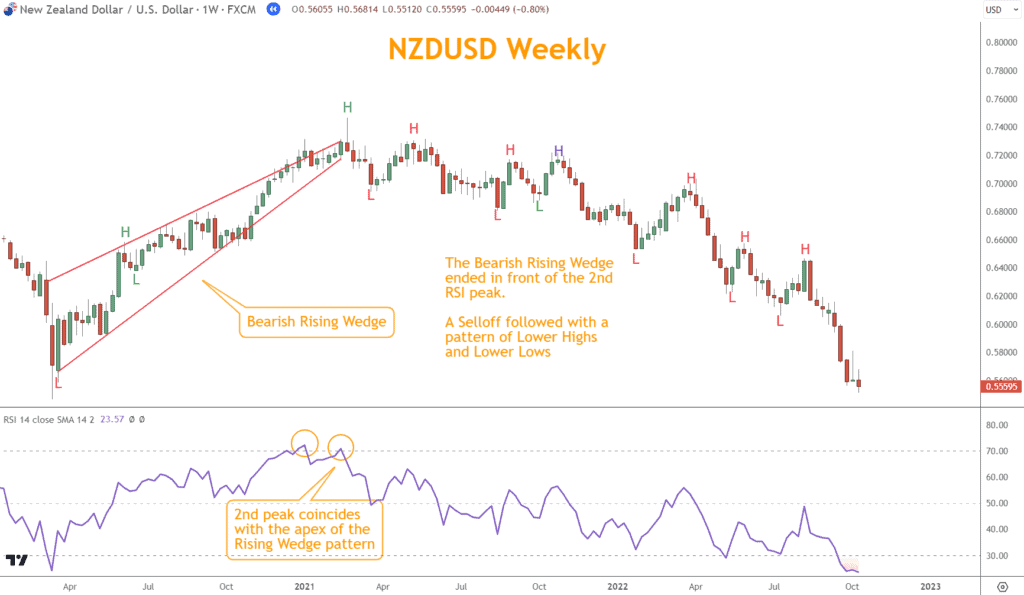
Momentum tells you “pressure is building,” while chart patterns show you where that pressure resolves.
Tactic 3: Support and Resistance
Support and resistance act as natural turning points in the market. When price reaches these key levels while momentum is overbought or oversold, a reversal is more likely.
Examples:
- Oversold at support: Higher chance of a bounce
- Overbought at resistance: Higher chance of rejection
In the NZD/USD example below, an overbought signal near a resistance level can be a warning bell, hinting at a potential price drop.
By integrating these tools, you can pinpoint high-probability entry and exit points, optimizing your trading strategies for better returns.
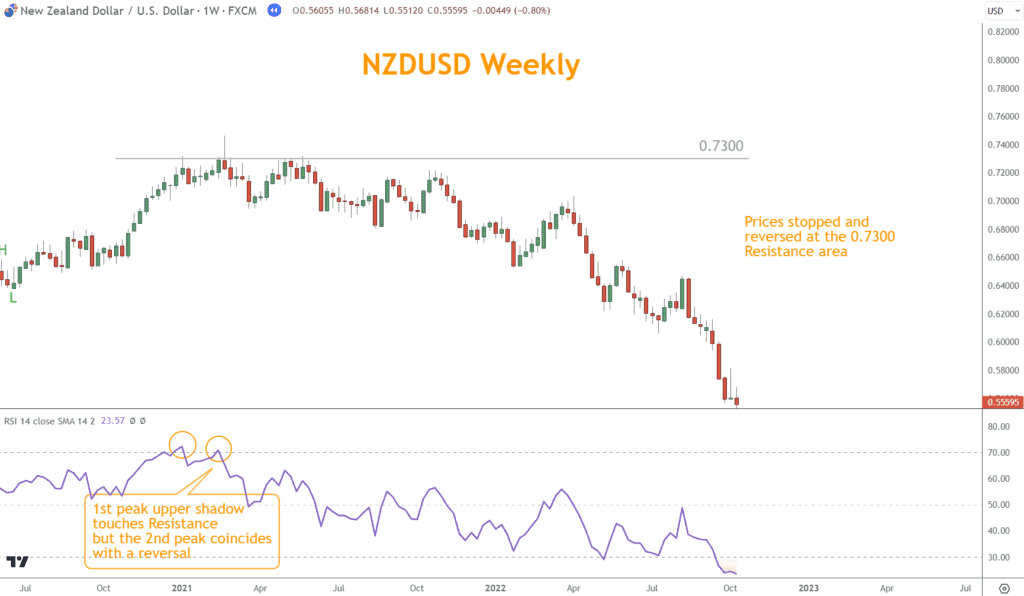
Support and resistance add structure and precision to momentum-based trades.
Is It Flawless? What’s the Downside?
Momentum indicators are beneficial, but no signal is perfect.
Markets can remain overbought or oversold for extended periods, especially during strong trends or primary news cycles.
This means relying solely on momentum can lead to premature trades. Using confirmation tools helps avoid false entries and aligns your trades with the broader market context.
What Can You Take Away From This?
Overbought and oversold indicators provide valuable insight into trend exhaustion and potential reversals. But they should always be used as part of a broader strategy.
When combined with Japanese Candlesticks, chart patterns, and support/resistance, these indicators form a reliable framework for evaluating opportunities with far greater accuracy.
What’s the Next Step?
Open a candlestick chart and apply your preferred momentum indicator—RSI, Stochastic, or CCI.
Identify Overbought and Oversold zones, then validate them using candlestick patterns, Chart Patterns, and key Support and Resistance levels.
If you want a structured, repeatable method for analyzing charts, you can learn the Six Basics of Chart Analysis for free.
When you download it, you’ll also receive Forex Forecast every Sunday with:
- Trade ideas and analysis
- Case studies
- Educational guides
- New article links
- PositionForex updates
- Webinar invitations
- And more

Everything is free and designed to support long-term growth in trading.
Frequently Asked Questions
Can an asset remain overbought or oversold for an extended period?
Yes. Strong trends can keep prices in extreme zones far longer than expected.
Are overbought and oversold indicators foolproof?
No. They work best when combined with other confirmation tools.
Why does price keep rising even when indicators show overbought conditions?
Market sentiment, news events, and fundamentals can override technical signals.
Forex Trading Disclosure Statement
Risk Warning:
Forex trading involves significant risk and may not be suitable for all investors. The leveraged nature of Forex trading can work both for and against you, leading to substantial gains or losses. Before trading Forex, you should carefully consider your financial objectives, experience level, and risk tolerance. It is possible to lose more than your initial investment, and you should only trade with money you can afford to lose.
Market Risks and Volatility:
Forex markets are influenced by global economic, political, and social events, which can result in unpredictable price movements. High market volatility can lead to sudden and substantial changes in currency values, potentially causing losses that exceed your initial deposit.
Leverage Risks:
Leverage amplifies both potential gains and potential losses. While leverage can increase profitability, it also increases the risk of significant losses, including the loss of your entire trading capital.
Trading Tools and Technology Risks:
Forex trading platforms, including those offered by brokers, are subject to technology risks such as system failures, latency issues, and potential errors in price feeds. Traders should be aware that these risks can impact the execution of trades and trading outcomes.
No Guarantee of Profitability:
Past performance in Forex trading is not indicative of future results. There is no guarantee that you will achieve profits or avoid losses when trading Forex. Market conditions and individual trading strategies vary, and no trading system can eliminate the inherent risks of Forex trading.
Educational Purposes Only:
Any information provided about Forex trading, including strategies, analysis, or market commentary, is for educational purposes only and should not be considered financial advice. Consult a qualified financial advisor or tax professional before making any trading decisions.
Regulatory Compliance:
Forex trading is regulated differently in various jurisdictions. Ensure that you are trading with a licensed and compliant broker in your country of residence.
Responsibility:
You are solely responsible for your trading decisions and the associated risks. It is your duty to understand the terms and conditions of Forex trading, including margin requirements, stop-losses, and other risk management tools.
Acknowledgment:
By engaging in Forex trading, you acknowledge that you have read, understood, and accepted this disclosure statement. You accept full responsibility for the outcomes of your trading decisions and agree to trade at your own risk.
This disclosure provides an overview of the risks associated with Forex trading and is not exhaustive. For additional information, consult your broker and other reliable financial resources.