
Japanese candlestick patterns, such as the One White Soldier and One Black Crow, offer traders early clues about potential market reversals.
These two-candle formations reveal the ongoing battle between buyers and sellers and often precede major turning points.
When validated by other indicators—such as momentum oscillators or support and resistance—they can provide strong confirmation signals for trade decisions.
Quick Reference Table: Comparing the Two Patterns
| Pattern | Market Context | Candle Sequence | Signal Type | Confirmation Tools |
| One White Soldier | After a Selloff | Green candle followed by a long Red candle | Bullish Reversal | TSI Bullish crossover, Support levels |
| One Black Crow | After a Rally | Green candle followed by long Red candle | Bearish Reversal | TSI Bearish crossover, Resistance levels |
TL;DR – Recognize These Two-Candle Reversal Signals
- One White Soldier: Suggests a bullish shift after a downtrend.
- One Black Crow: Suggests a bearish shift after a rally.
- Confirmation: Use the True Strength Index (TSI), Chart Patterns, and Support/Resistance for validation.
- Avoid trading either pattern in isolation—context and confirmation are essential.
Table of Contents
- TL;DR – Recognize These Two-Candle Reversal Signals
- What Is the One White Soldier?
- How the One Black Crow Differs
- Using Complementary Indicators for Confirmation
- Conclusion
- What Are Your Next Steps?
- Quiz: Understanding the One White Soldier and One Black Crow Patterns
- What’s the Next Step?
- Forex Trading Disclosure Statement
What Is the One White Soldier?
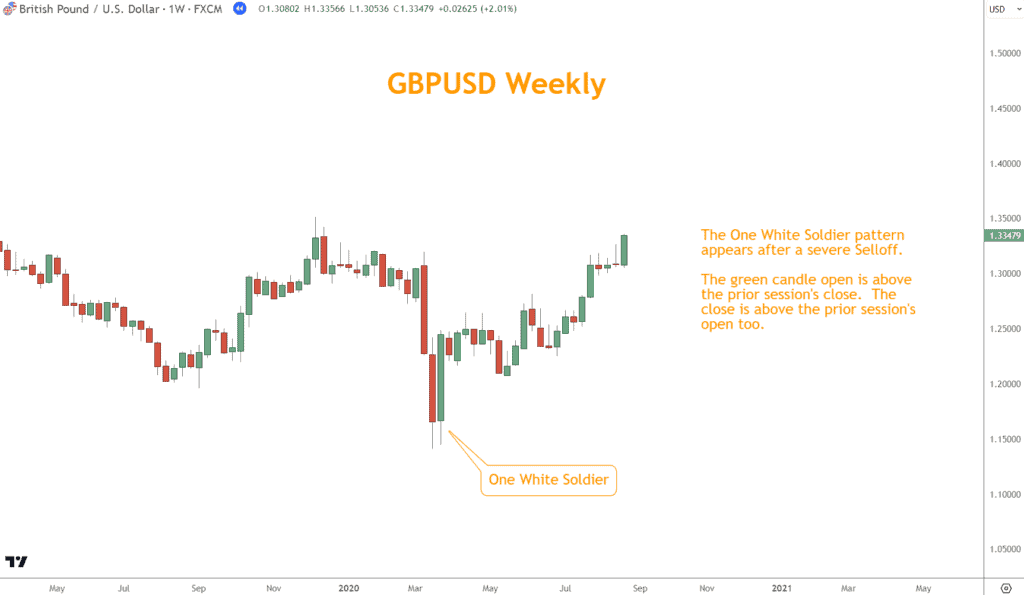
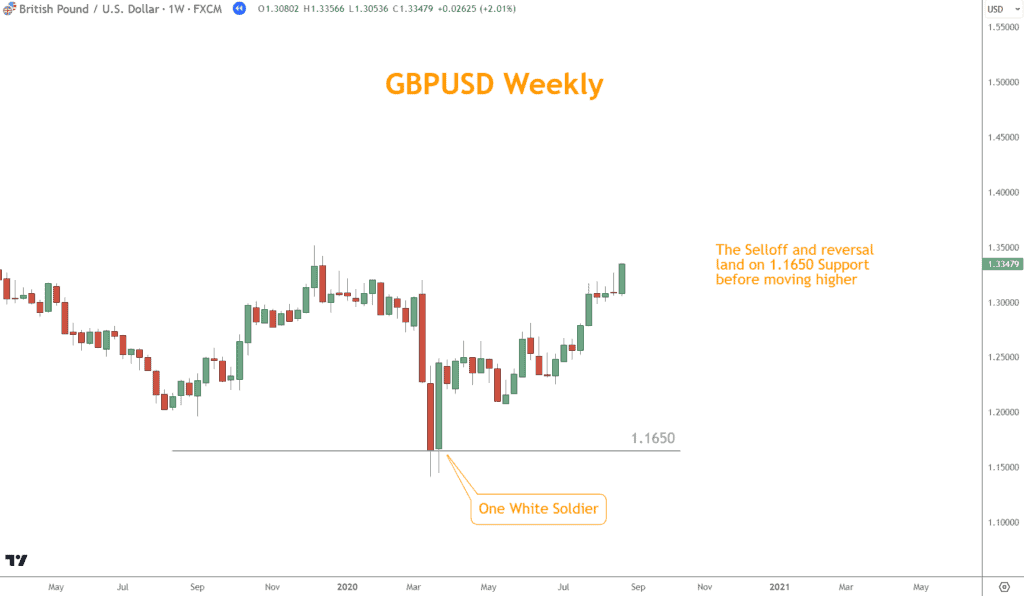
The One White Soldier appears after a sustained downtrend and represents a potential bullish turnaround.
It consists of two candles:
- A long red candle, reflecting bearish control.
- A long green candle that opens below the previous close but closes higher—signaling a surge in buying strength.
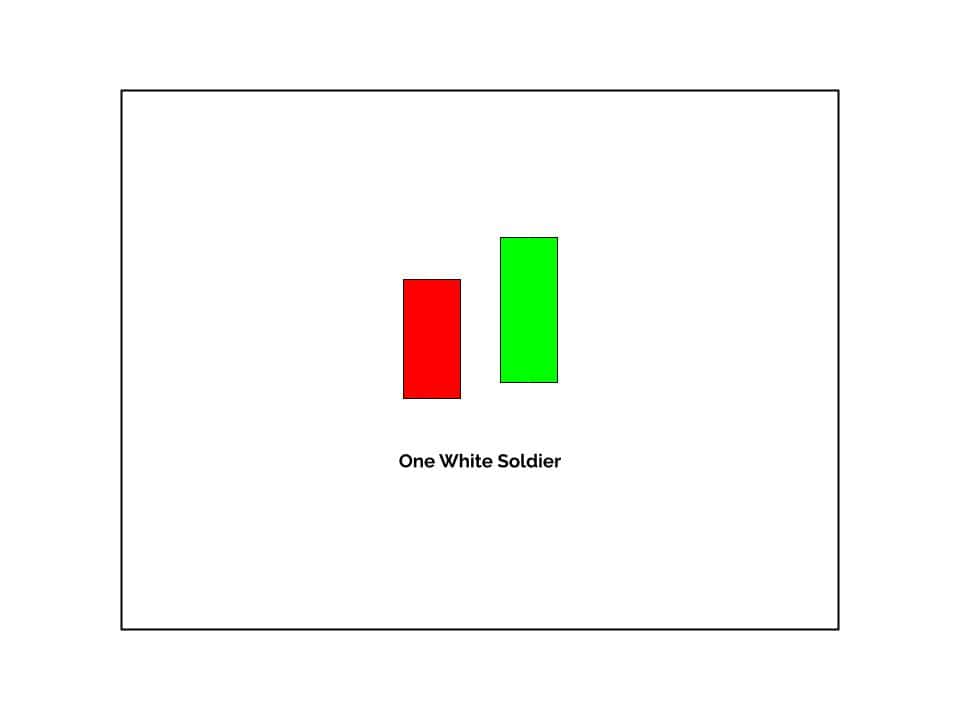
This formation marks a possible end to selling pressure as buyers regain control.
To strengthen confidence in the signal, look for supporting evidence such as a TSI bullish crossover or a reaction from horizontal support.
How the One Black Crow Differs
In contrast, the One Black Crow develops during a rally and warns of potential bearish sentiment emerging.
The structure also includes two candles:
- A long green candle, showing bullish momentum.
- A long red candle, which opens above the previous close but ends the session lower—signaling selling strength.
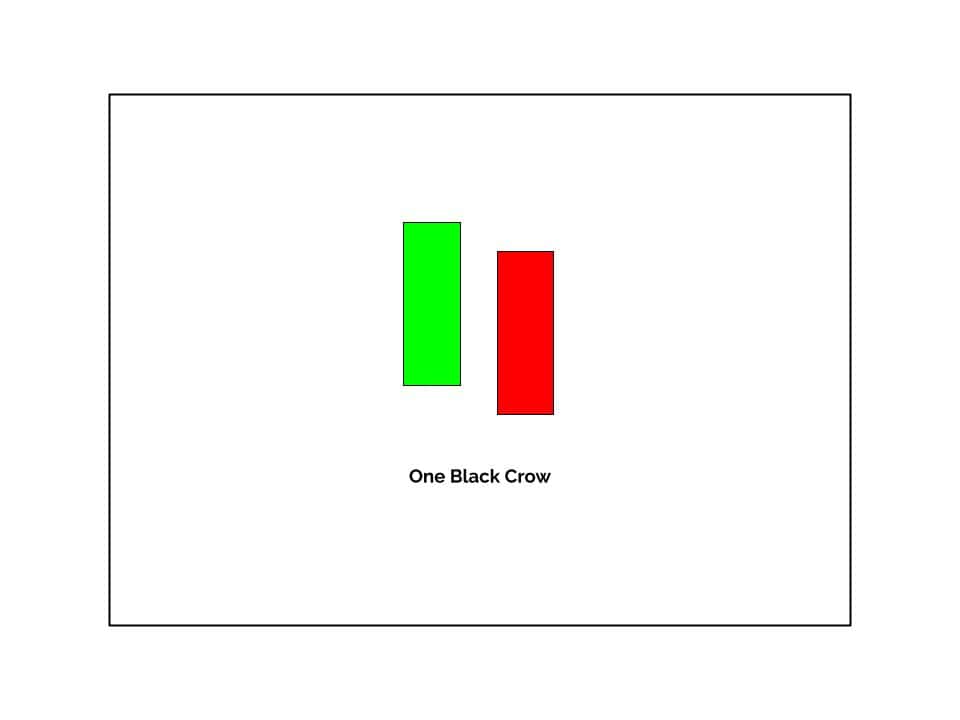
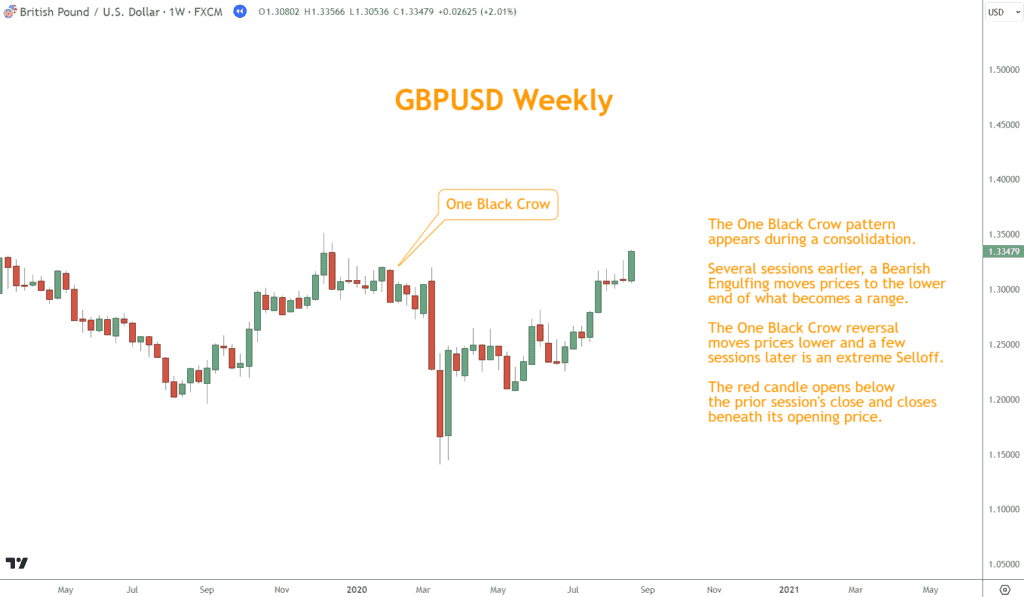
This pattern implies that buyers are losing control and sellers may soon dominate.
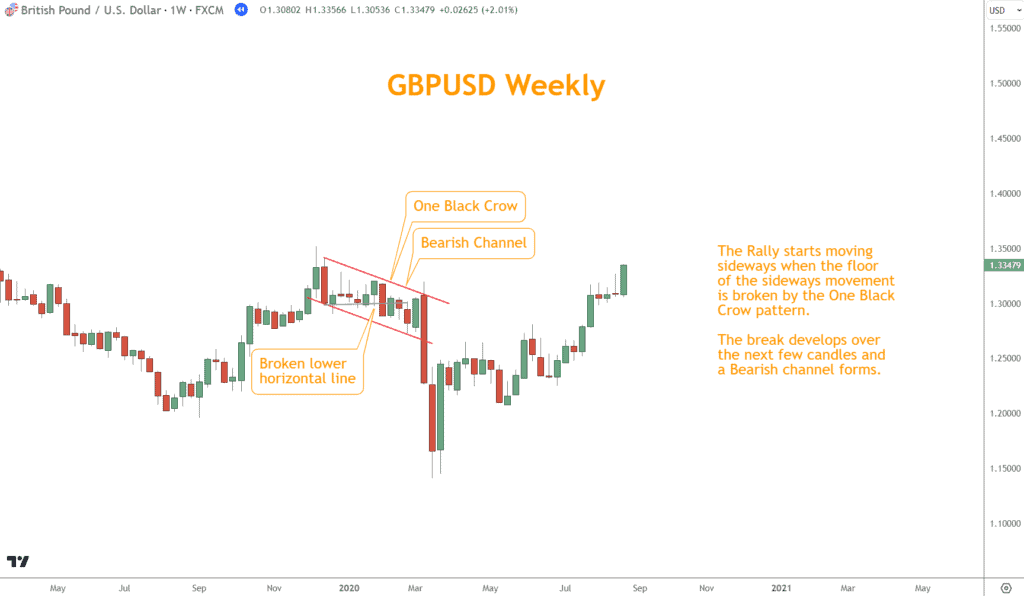
To confirm the reversal, pair the One Black Crow with indicators like a bearish TSI crossover, chart resistance, or downward-sloping channels.
Looking for a Strategy?
Download the Six Basics of Chart Analysis and sign up for Forex Forecast to learn a bottom-up approach to analyzing Forex markets and weekly market updates.
Using Complementary Indicators for Confirmation
Candlestick patterns become more powerful when analyzed alongside momentum oscillators and chart structures.
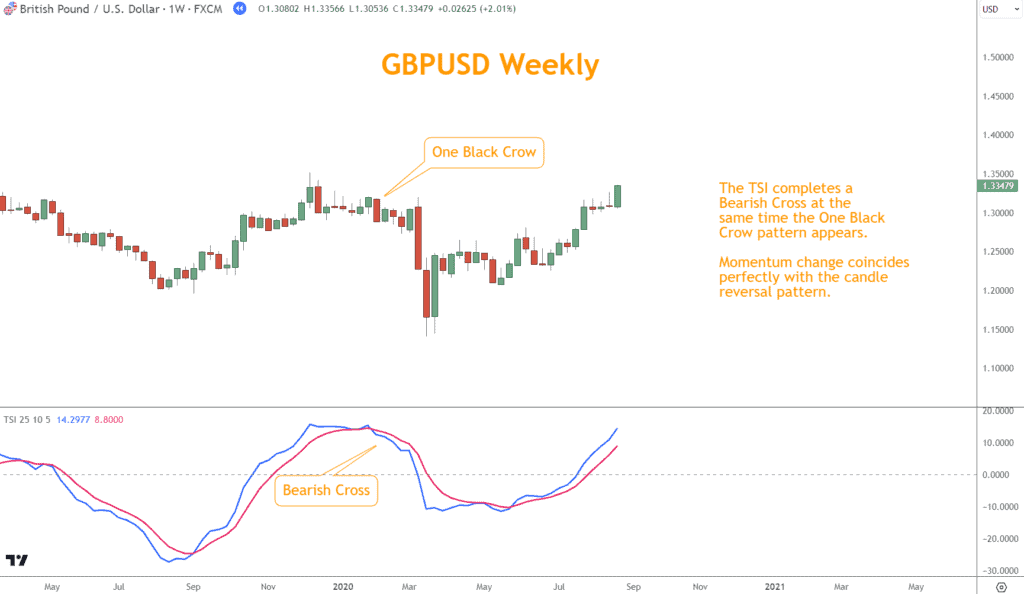
The True Strength Index (TSI), in particular, helps gauge the underlying energy of a currency pair.
- Bullish Confirmation: A TSI bullish crossover that aligns with a One White Soldier strengthens the reversal signal.
- Bearish Confirmation: A TSI bearish crossover forming with a One Black Crow reinforces a bearish shift.
Additionally, chart patterns like Channels, Triangles, and Flags offer context for where the market sits within its broader structure.
A One White Soldier forming near support may validate a bullish reversal, while a One Black Crow emerging near resistance can confirm a bearish setup.
By integrating these tools, traders gain a holistic view of market sentiment rather than relying on isolated signals.
Conclusion
The One White Soldier and One Black Crow patterns help identify potential market reversals through clear visual cues of changing sentiment.
When combined with momentum analysis, chart patterns, and support/resistance, they enhance your ability to interpret price action accurately.
Always confirm your analysis, manage risk diligently, and continue refining your technical trading discipline.
What Are Your Next Steps?
Now that you understand the One White Soldier and One Black Crow candlestick patterns, it’s time to apply them in real-market conditions.
These two-candle formations reveal vital shifts in sentiment, but their true power lies in their confirmation by momentum and structure.
Use the following checklist to start integrating them into your technical analysis routine:
- Review your charts on the weekly timeframe
- Mark support and resistance zones where reversals often occur
- Use the True Strength Index (TSI) to confirm momentum shifts
- Identify and label any One White Soldier or One Black Crow formations
- Cross-check with chart patterns or candlestick confirmations for additional validation
Want to trade with more clarity?
Download the free Six Basics of Chart Analysis and subscribe to the weekly Forex Forecast newsletter to get setups like these delivered every Sunday.
Each issue includes:
- Trade ideas using the Six Basics
- Case studies from live market conditions
- Educational videos, guides, and webinars
Quiz: Understanding the One White Soldier and One Black Crow Patterns
1. What does the One White Soldier pattern typically indicate?
a) A bearish continuation
b) A bullish reversal
c) A neutral consolidation
d) A false breakout
2. How many candles form each of these patterns?
a) One
b) Two
c) Three
d) Four
3. Which indicator best complements these patterns for confirmation?
a) Moving Average
b) Bollinger Bands
c) True Strength Index (TSI)
d) Fibonacci Retracement
4. Where does the One Black Crow usually appear?
a) After a strong rally
b) At the bottom of a downtrend
c) During sideways markets
d) Only on weekly charts
5. What is the safest way to trade these patterns?
a) Trade them in isolation
b) Confirm with TSI, chart patterns, and support/resistance
c) Use only historical volatility
d) Ignore reversal signals
Answer Key
- b) A bullish reversal
- b) Two
- c) True Strength Index (TSI)
- a) After a strong rally
- b) Confirm with TSI, chart patterns, and support/resistance
What’s the Next Step?
Put this article into action:
- Open a Forex chart and identify possible One White Soldier and One Black Crow formations.
- Confirm them using Momentum indicators, Chart Patterns, and Support/Resistance.
- Apply these insights to refine your trading strategy and timing.
For structured learning, download The Six Basics of Chart Analysis—it’s free.
You’ll also receive Forex Forecast, delivered every Sunday, featuring:
- Trade ideas using the Six Basics
- Case studies of successful setups
- Educational videos and guides
- PositionForex news and webinars
Develop the skills and confidence to read charts like a professional trader.
Forex Trading Disclosure Statement
Risk Warning:
Forex trading involves significant risk and may not be suitable for all investors. The leveraged nature of Forex trading can work both for and against you, leading to substantial gains or losses. Before trading Forex, you should carefully consider your financial objectives, experience level, and risk tolerance. It is possible to lose more than your initial investment, and you should only trade with money you can afford to lose.
Market Risks and Volatility:
Forex markets are influenced by global economic, political, and social events, which can result in unpredictable price movements. High market volatility can lead to sudden and substantial changes in currency values, potentially causing losses that exceed your initial deposit.
Leverage Risks:
Leverage amplifies both potential gains and potential losses. While leverage can increase profitability, it also increases the risk of significant losses, including the loss of your entire trading capital.
Trading Tools and Technology Risks:
Forex trading platforms, including those offered by brokers, are subject to technology risks, such as system failures, latency issues, and potential errors in price feeds. Traders should be aware that these risks can impact the execution of trades and trading outcomes.
No Guarantee of Profitability:
Past performance in Forex trading is not indicative of future results. There is no guarantee that you will achieve profits or avoid losses when trading Forex. Market conditions and individual trading strategies vary, and no trading system can eliminate the inherent risks of Forex trading.
Educational Purposes Only:
Any information provided about Forex trading, including strategies, analysis, or market commentary, is for educational purposes only and should not be considered financial advice. Consult a qualified financial advisor or tax professional before making any trading decisions.
Regulatory Compliance:
Forex trading is regulated differently in various jurisdictions. Ensure that you are trading with a licensed and compliant broker in your country of residence.
Responsibility:
You are solely responsible for your trading decisions and the associated risks. It is your duty to understand the terms and conditions of Forex trading, including margin requirements, stop-losses, and other risk management tools.
Acknowledgment:
By engaging in Forex trading, you acknowledge that you have read, understood, and accepted this disclosure statement. You accept full responsibility for the outcomes of your trading decisions and agree to trade at your own risk.
This disclosure is intended to provide an overview of the risks associated with Forex trading and is not exhaustive. For additional information, consult your broker and other reliable financial resources.