
One-candle Japanese candlestick patterns are powerful tools for identifying potential reversals in the Forex market.
Formed from a single candlestick’s open, high, low, and close, these patterns provide traders with quick insights into price action and market psychology.
While no candlestick should be traded in isolation, learning these patterns—and combining them with other forms of analysis—can significantly improve your decision-making.
In this guide, I’ll share the five most crucial one-candle candlestick patterns, their strengths and limitations, and how I’ve used them in my own trading since 2007.
Summary
In Forex trading, one-candle candlestick patterns reveal shifts in sentiment using just a single bar of price action.
This article explains the five most critical single-candle patterns, their meaning, and how to use them alongside other tools.
Quick Reference: One-Candle Candlestick Patterns
| Pattern | Typical Location | Direction | Key Signal |
| Hammer | Bottom of a selloff | Bullish | Buyers are rejecting lower prices |
| Hanging Man | Top of a rally | Bearish | Fragile bullish momentum, reversal risk |
| Inverted Hammer | Bottom of a selloff | Bullish | Weakness in selling pressure |
| Shooting Star | Top of a rally | Bearish | Failed push by bulls, sellers take control |
| Doji / Spinning Top | Either top or bottom | Indecision | Potential reversal or consolidation |
TL;DR – Master These 5 One-Candle Patterns
- Hammer & Hanging Man: Although they look similar, but signal opposite reversals.
- Inverted Hammer & Shooting Star: Opposite signals depending on location.
- Doji / Spinning Top: Reflects indecision and often foreshadows reversals.
Use these patterns with other tools like support/resistance, chart patterns, and momentum indicators (TSI) for higher accuracy.
Table of Contents
- Summary
- TL;DR – Master These 5 One-Candle Patterns
- Advantages of One-Candle Patterns
- Limitations of One-Candle Patterns
- Components of a Candlestick
- The Marubozu: The Only Continuation Candle
- The 5 Must-Know One-Candle Reversal Patterns
- Combining One-Candle Patterns with Technical Tools
- Quiz: One-Candle Japanese Candlestick Patterns
Advantages of One-Candle Patterns
One-candle candlesticks are widely used because they’re simple yet revealing.
They provide a quick read of price action across all timeframes, reflecting the tug-of-war between buyers and sellers.
Key benefits include:
- Available on every timeframe
- Compact yet information-rich
- Capture market psychology instantly
- Can combine into larger multi-candle patterns
- Work well alongside technical analysis tools
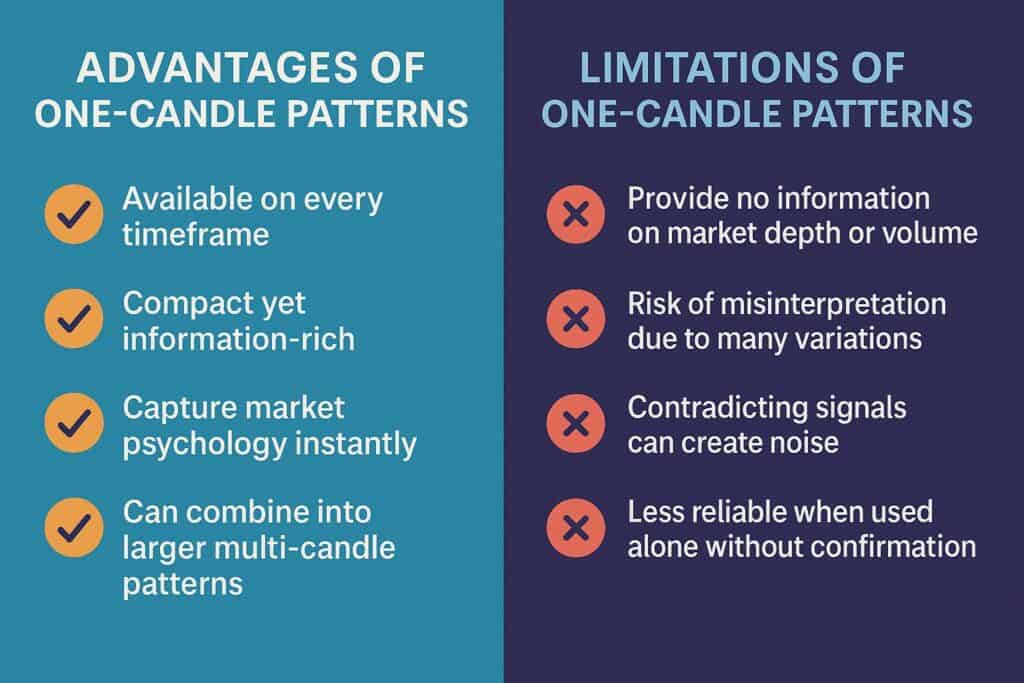
Limitations of One-Candle Patterns
Candlesticks are valuable, but they’re not foolproof.
They must be read in context, and inexperienced traders often misinterpret them.
Limitations include:
- Provide no information on market depth or volume
- Risk of misinterpretation due to many variations
- Contradicting signals can create noise
- Less reliable when used alone without confirmation
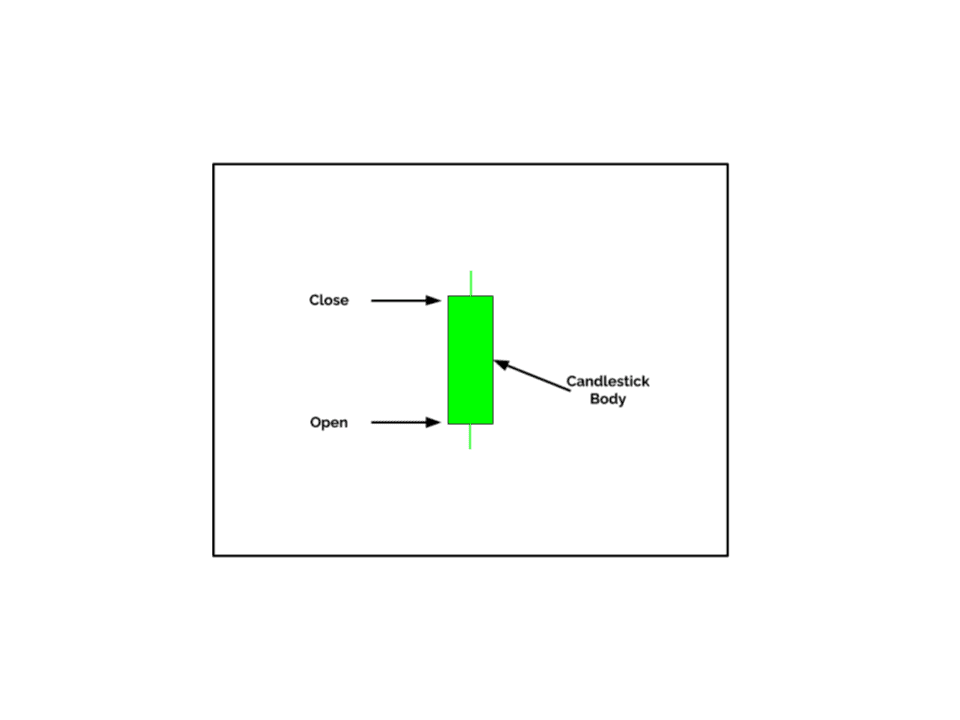
Components of a Candlestick
To master candlestick patterns, you must first understand their structure. Each candle consists of three main elements:
- The Body
The space between the open and close. Long bodies (e.g., Marubozu) show intense pressure, while short bodies (e.g., Doji, Spinning Top) show indecision. - The Shadows (Wicks)
Represent the extremes of price movement. Long wicks indicate volatility (e.g., Hammer), while short wicks suggest calmer trading. - The Color
Indicates bullish (green/white) or bearish (red/black) sentiment. This helps define whether a candle confirms upward or downward bias.
The Marubozu: The Only Continuation Candle
While most one-candle patterns are reversals, the Marubozu is an exception. It has a long body with no shadows, signaling a firm one-sided conviction.
- Bullish Marubozu = intense buying pressure, trend continuation higher
- Bearish Marubozu = intense selling pressure, trend continuation lower
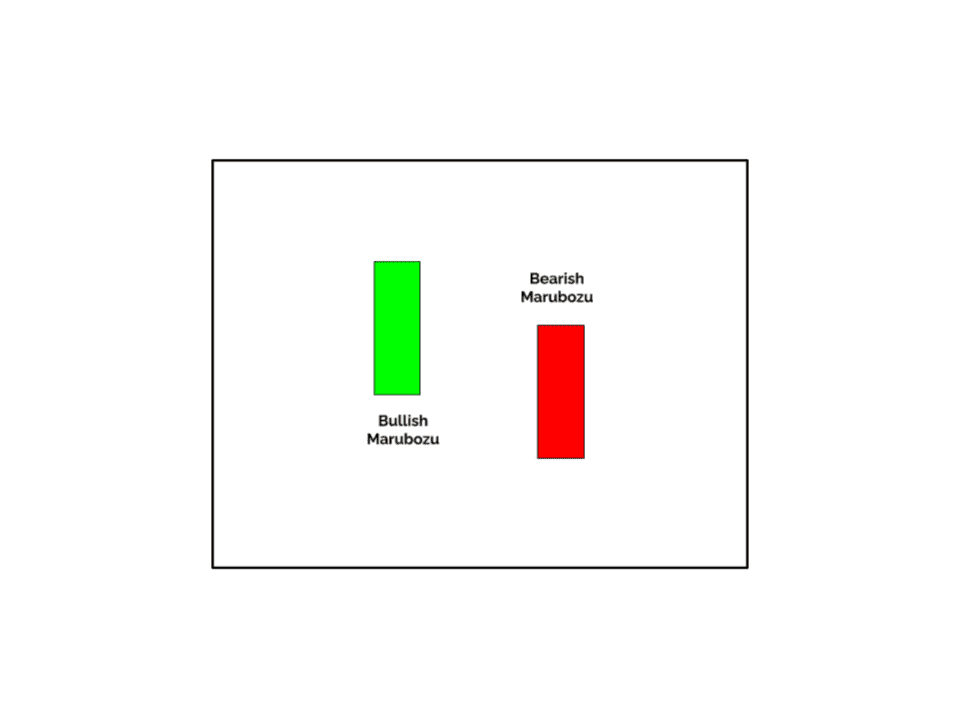
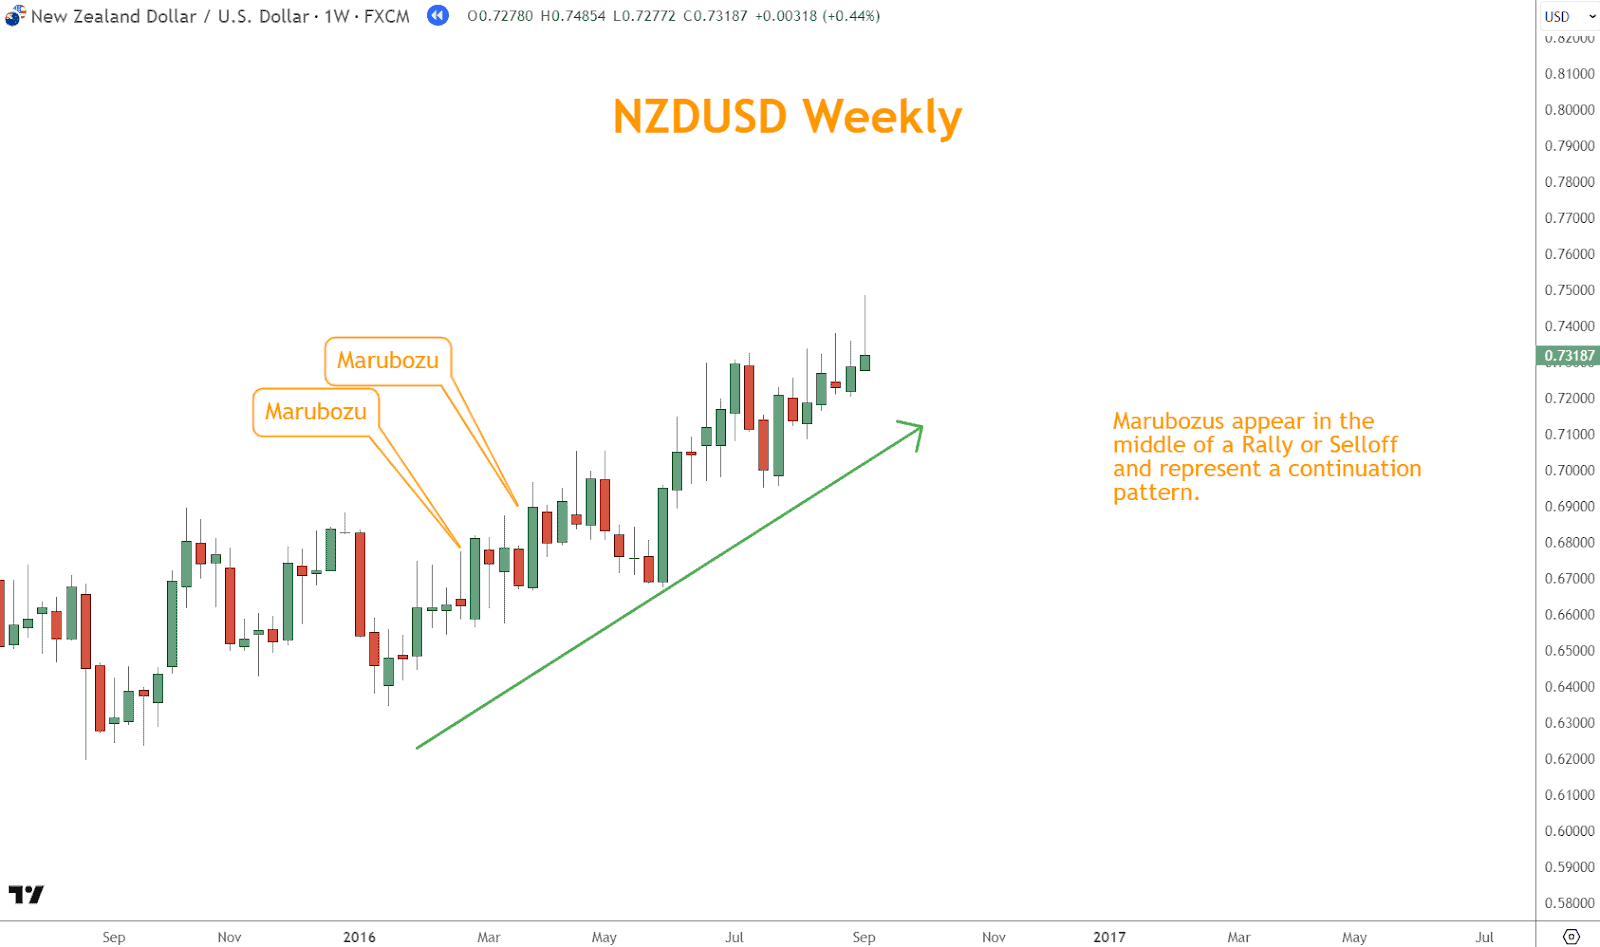
These candles often confirm rallies or selloffs but can also appear as part of multi-candle reversal patterns (e.g., Harami, Engulfing).
Looking for a Strategy?
Download the Six Basics of Chart Analysis and sign up for Forex Forecast to learn a bottom-up approach to analyzing Forex markets and weekly market updates.
The 5 Must-Know One-Candle Reversal Patterns
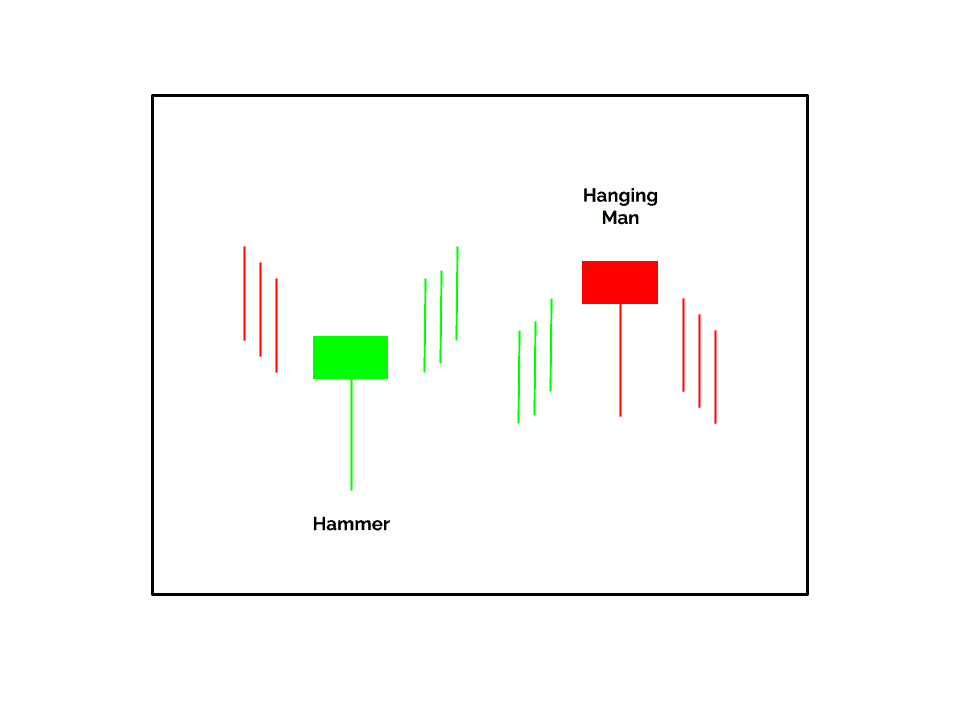
1. Hammer and Hanging Man
These look identical but differ in context:
- Hammer: Found at the bottom of selloffs, signals bullish reversal.
- Hanging Man: Found at the top of rallies, signals bearish reversal.
Psychology:
- Hammer: Bears push lower, but bulls reverse momentum and close near the high.
- Hanging Man: Bulls struggle to continue rally, bears test lower levels.
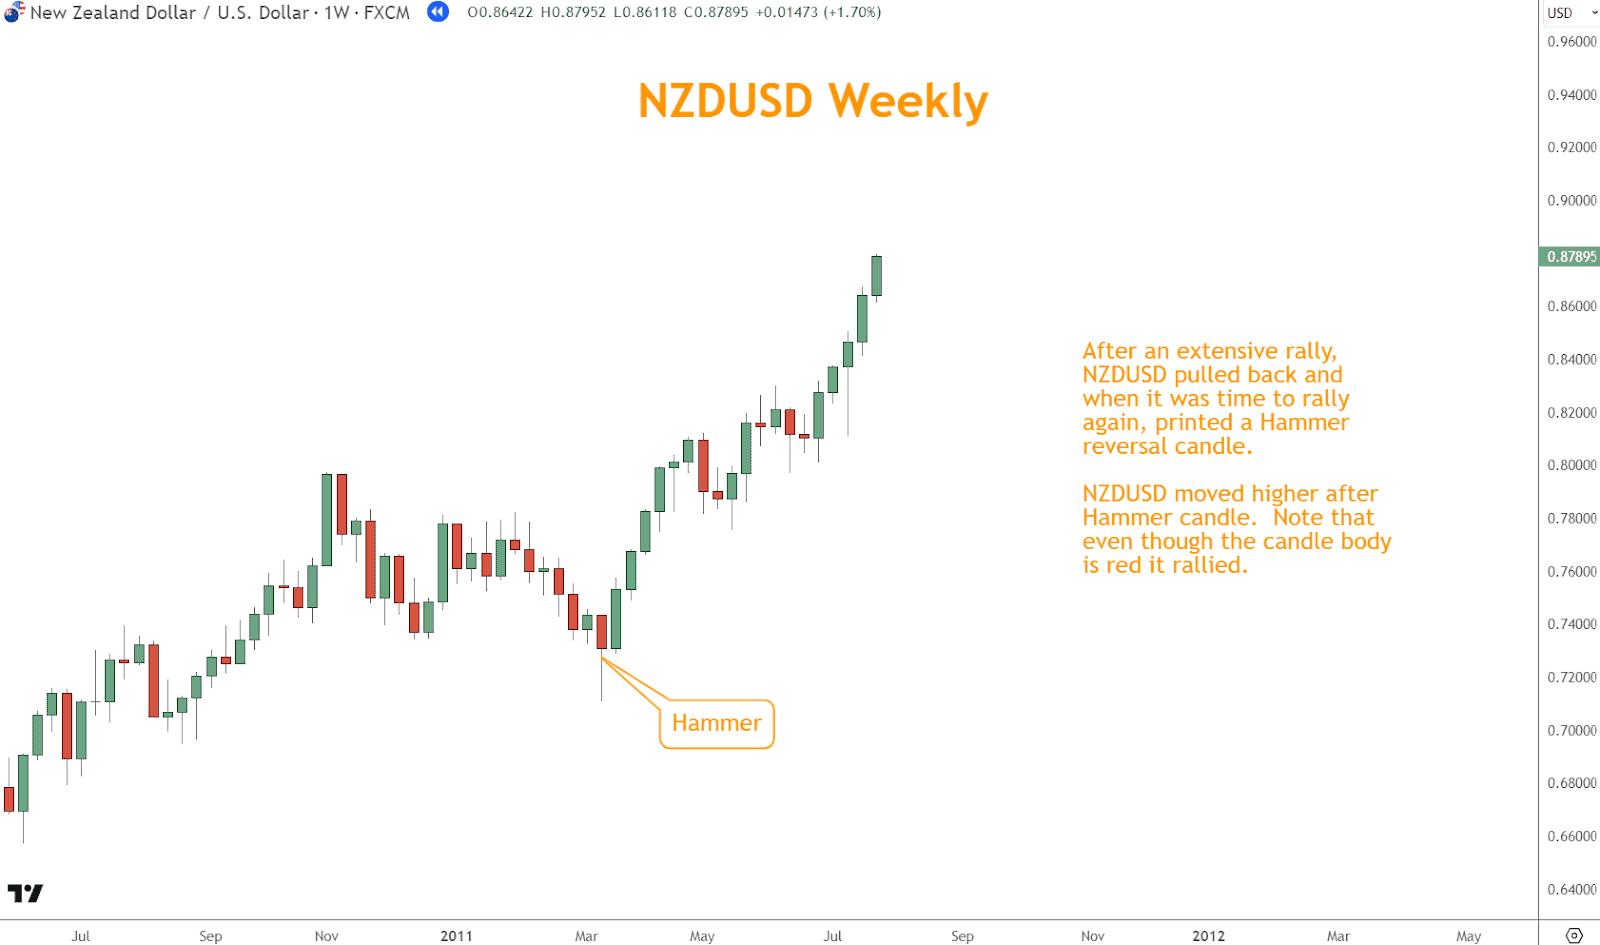
In the example below, you can see NZDUSD pulling back from its rally, printing a hammer candle, and then moving higher.
Conversely, a Hanging Man pattern at the end of a rally indicates a bearish reversal.
In the example below, the rally ends with the Hanging Man’s arrival, and a Selloff ensues.
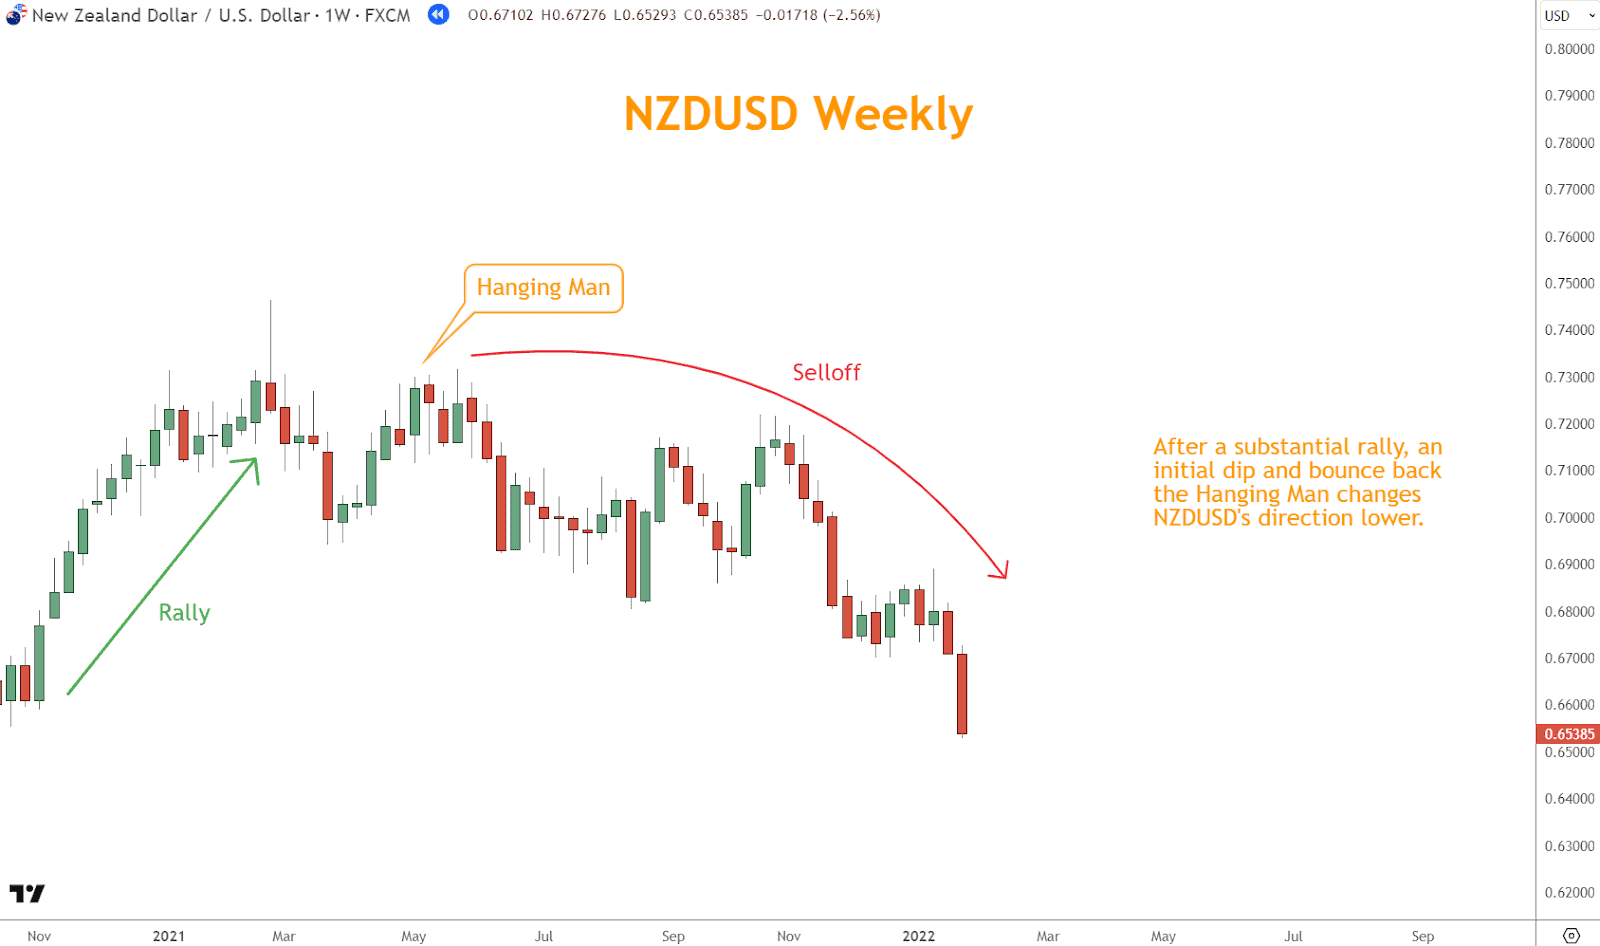
Confirmation Required: The candle after a Hammer or Hanging Man should move in the new direction.
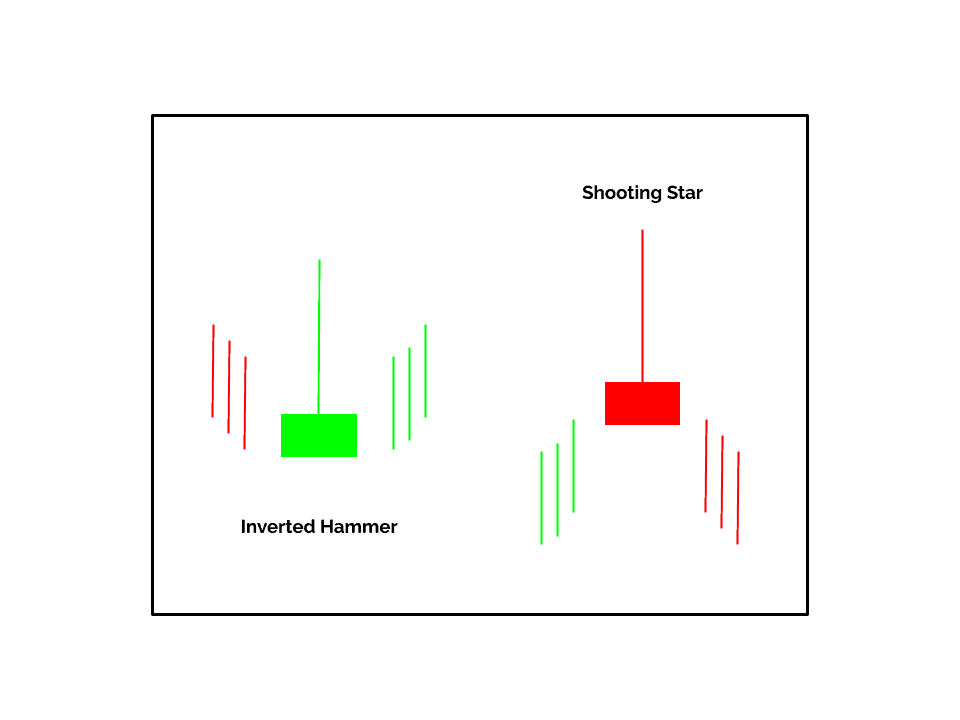
2. Inverted Hammer and Shooting Star
Both have long upper shadows and small bodies, but again, context matters:
- Inverted Hammer: Appears after a selloff, suggests bullish reversal.
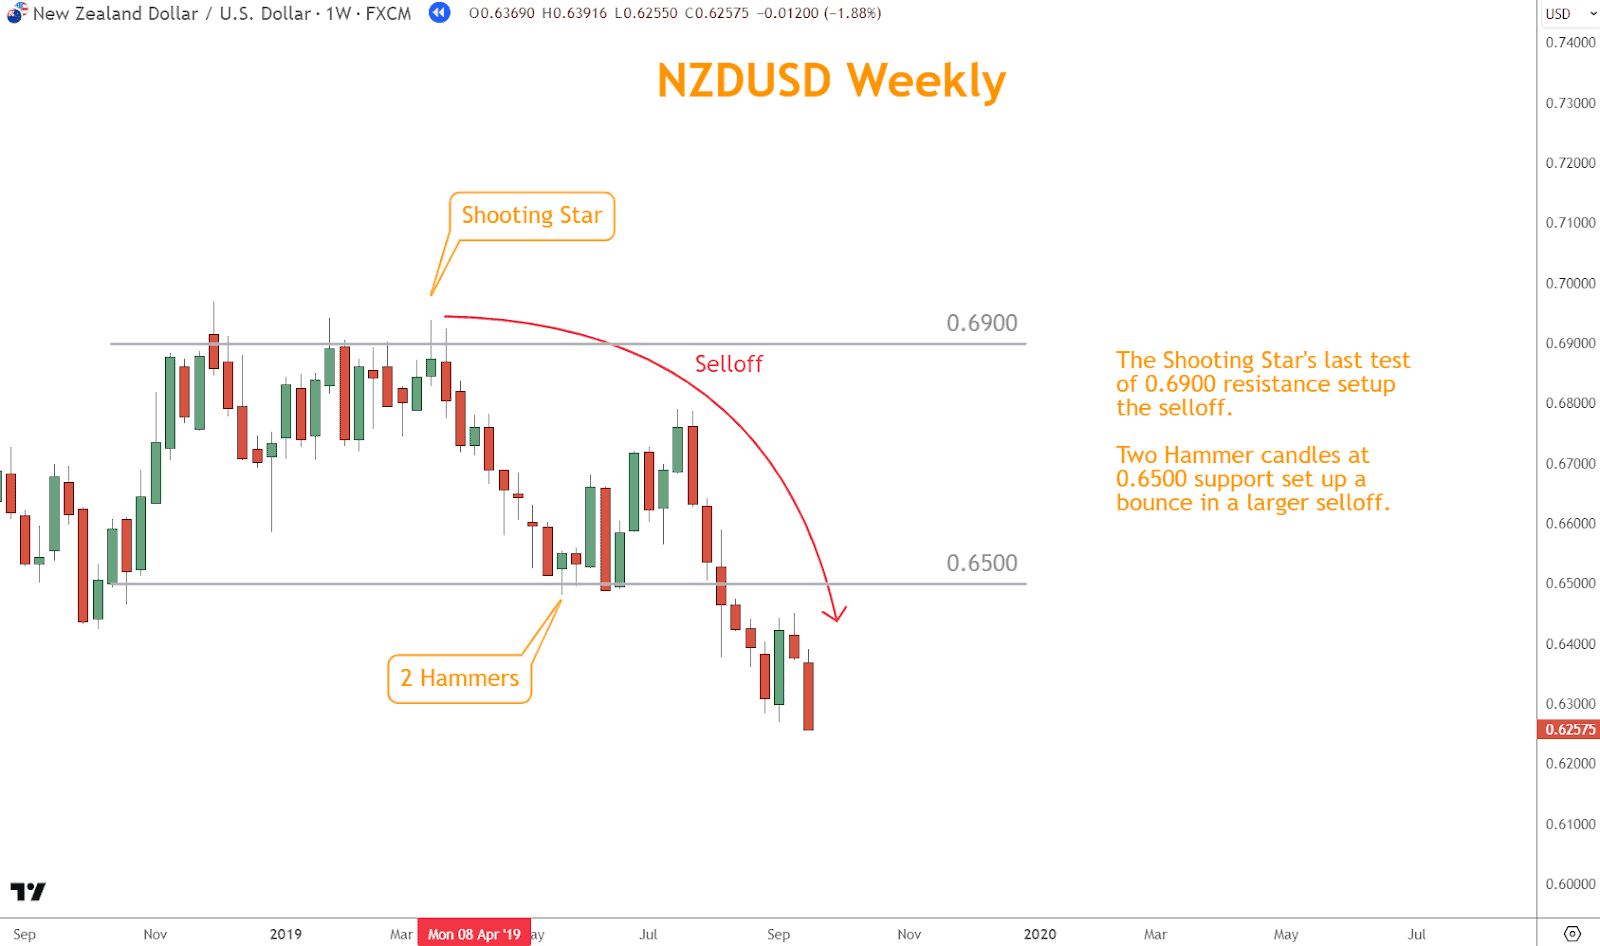
- Shooting Star: Appears after a rally, signals bearish reversal.
Psychology:
- Inverted Hammer: Bears lose control as bulls push back.
- Shooting Star: Bulls fail to hold highs, bears regain control.
In the example below, the selloff ends after the Inverted Hammer candle. Prices immediately reverse higher.
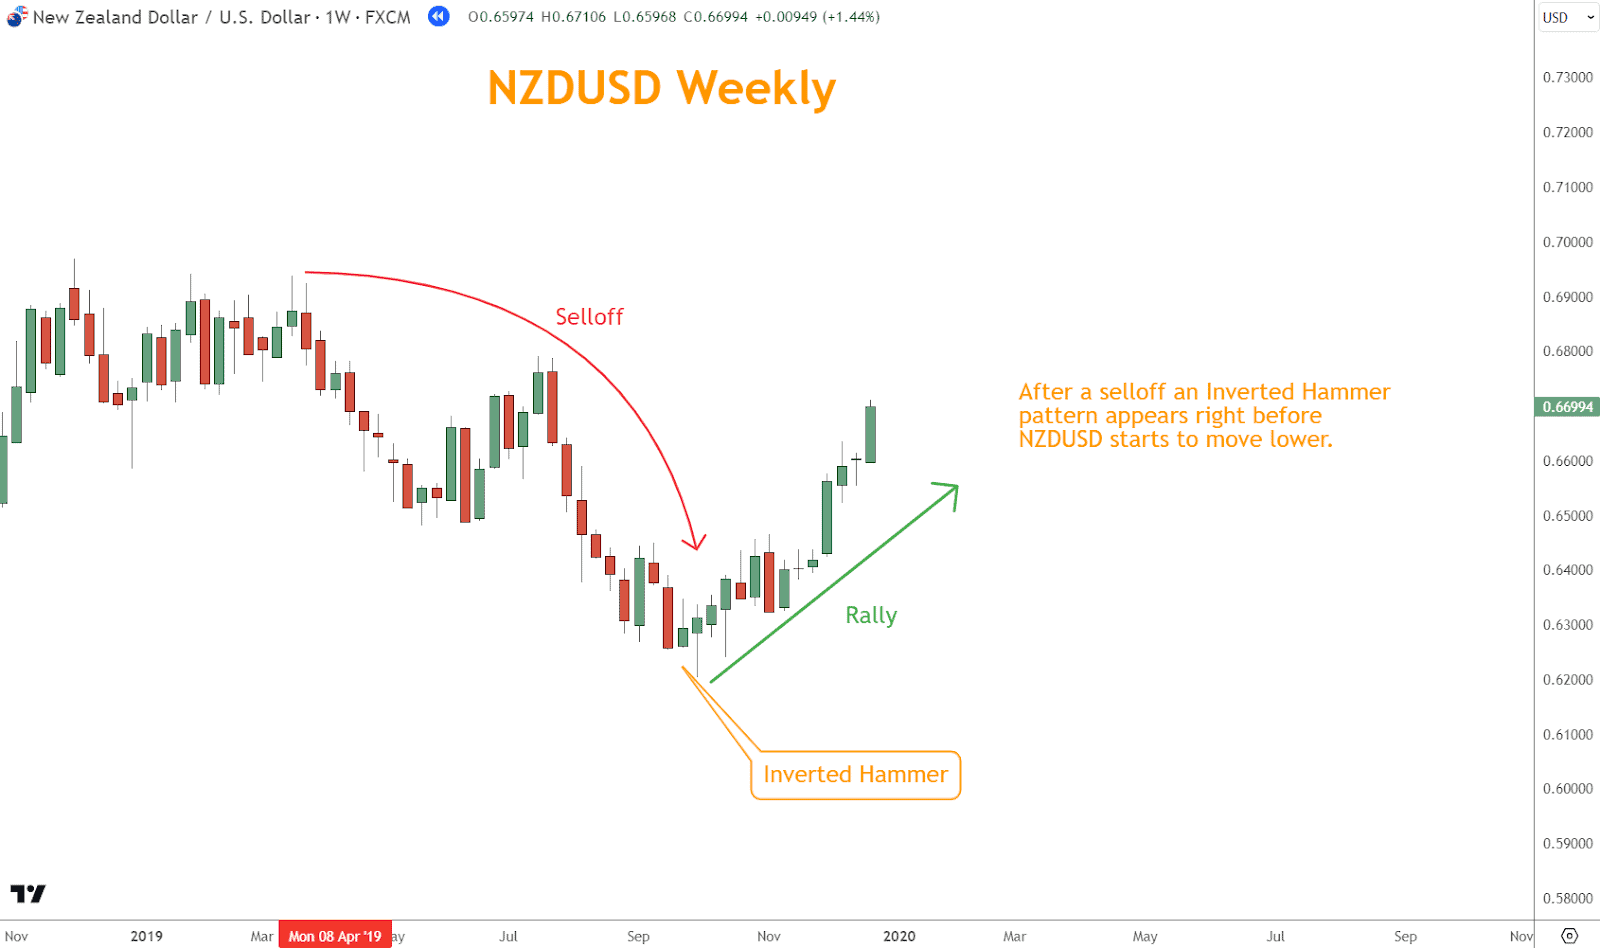
Confirmation should come from the next candle moving in the reversal direction.
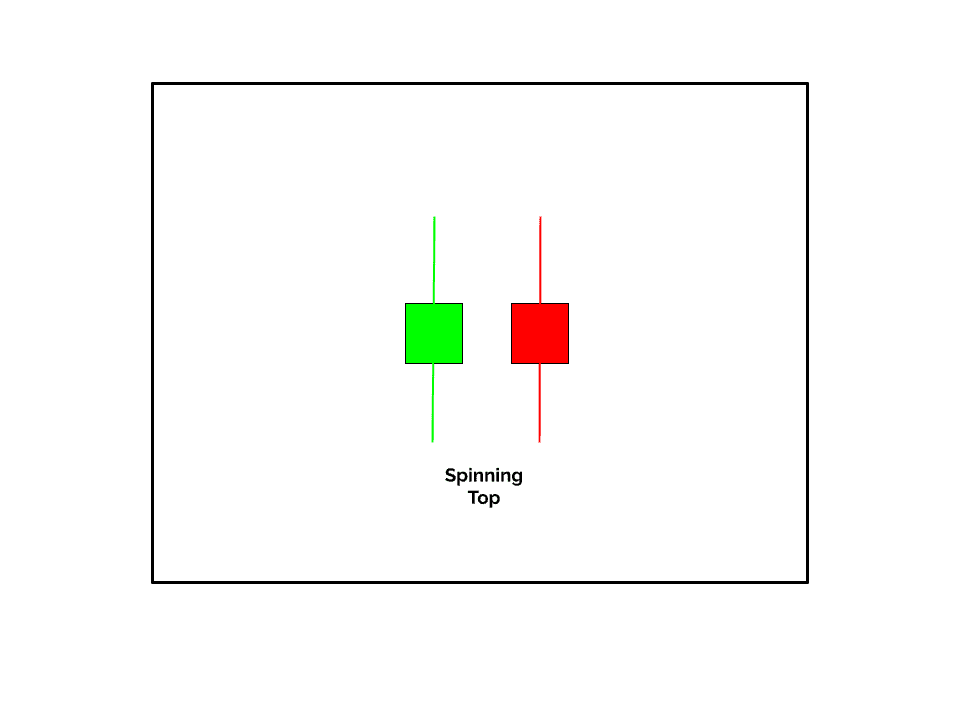
3. Spinning Top
A candlestick with a small body and long shadows on both ends.
It represents indecision, which often leads to a reversal or pause.
- At the bottom of a selloff → Bullish reversal
- At the top of a rally → Bearish reversal
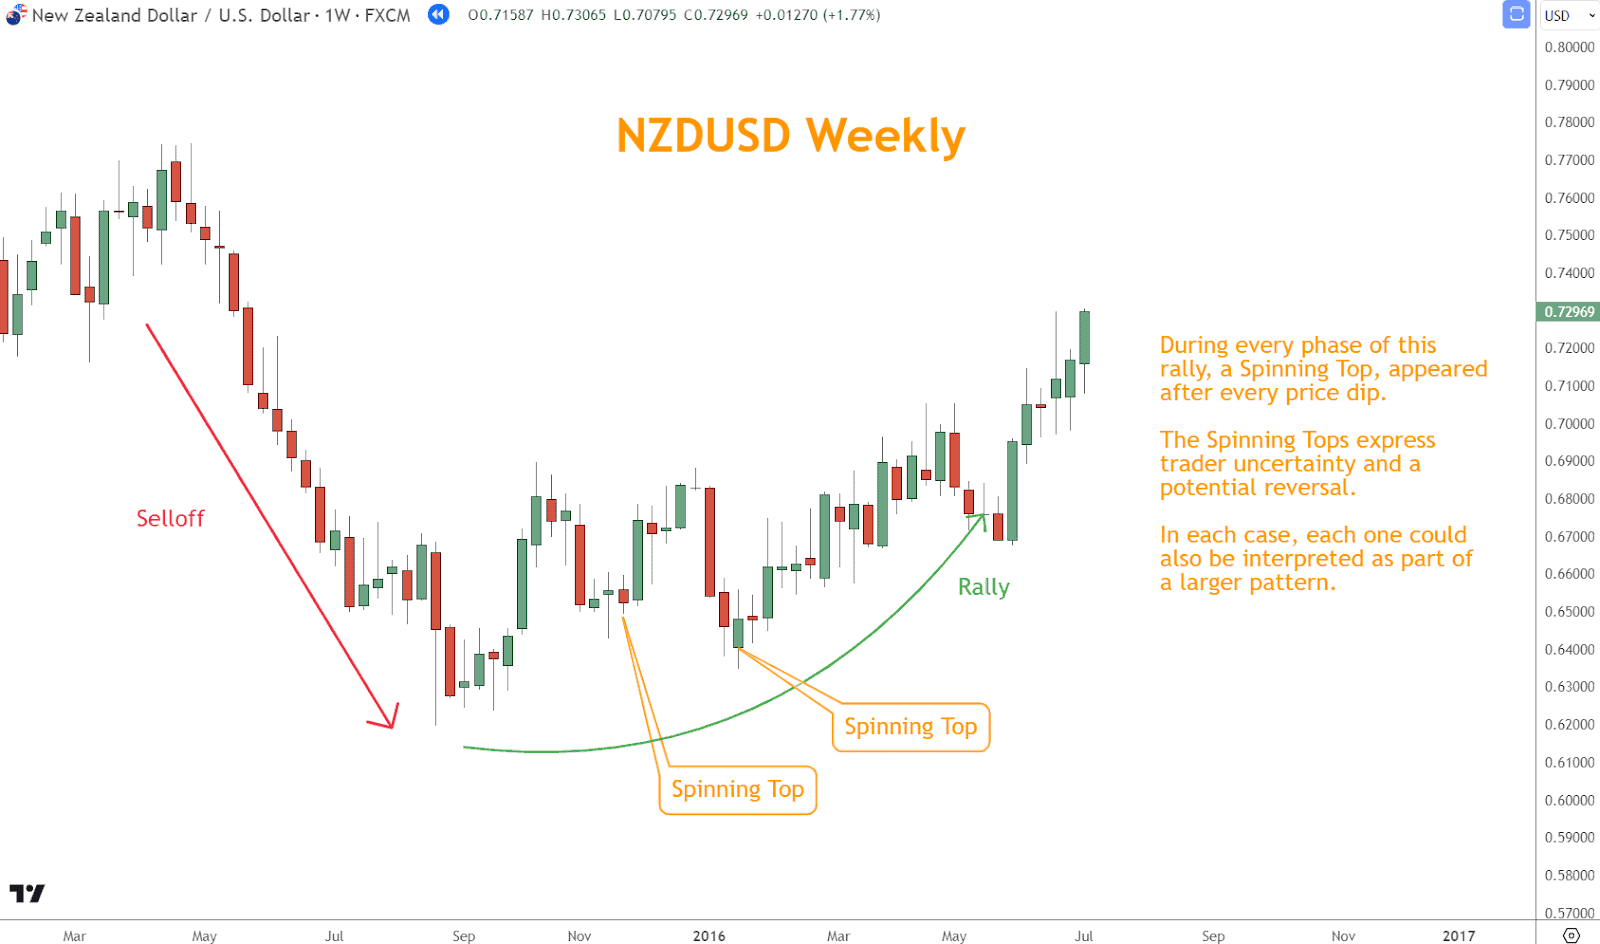
In the example below, a Spinning Top appears at the bottom of a selloff and marks a Bullish reversal as part of a larger, more complex pattern.
Within each pullback of the rally, a Spinning Top appeared, and prices reversed higher.
Takeaway: A Spinning Top means the trend is “tired” and losing momentum.
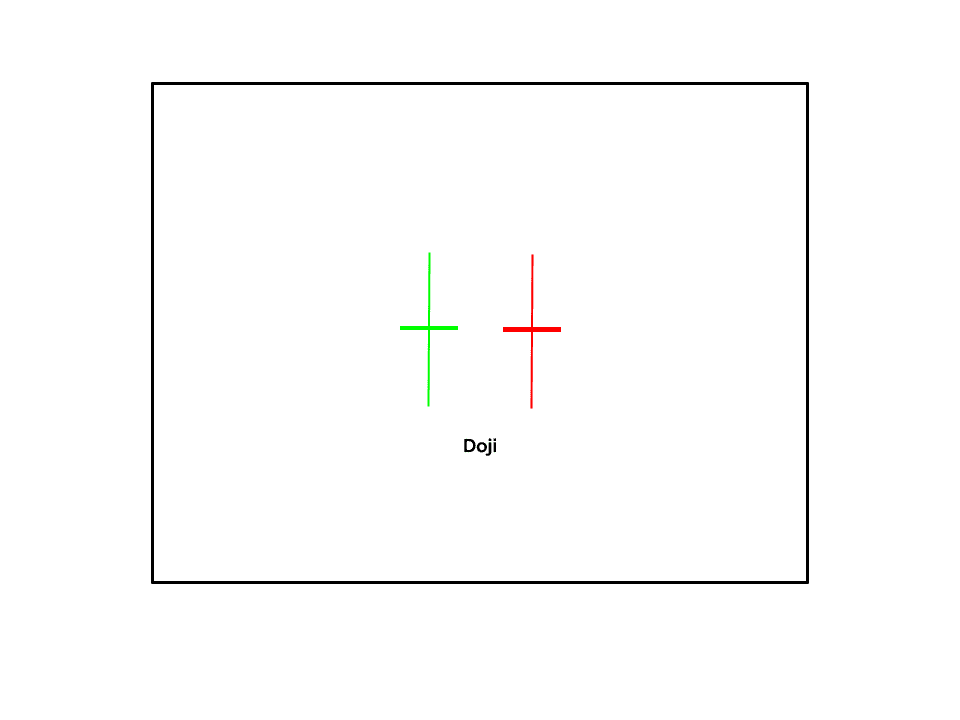
4. Doji
A Doji occurs when the open and close are nearly identical.
It’s an extreme signal of indecision, often foreshadowing a reversal.
- At the bottom of a selloff → Bullish reversal potential
- At the top of a rally → Bearish reversal potential
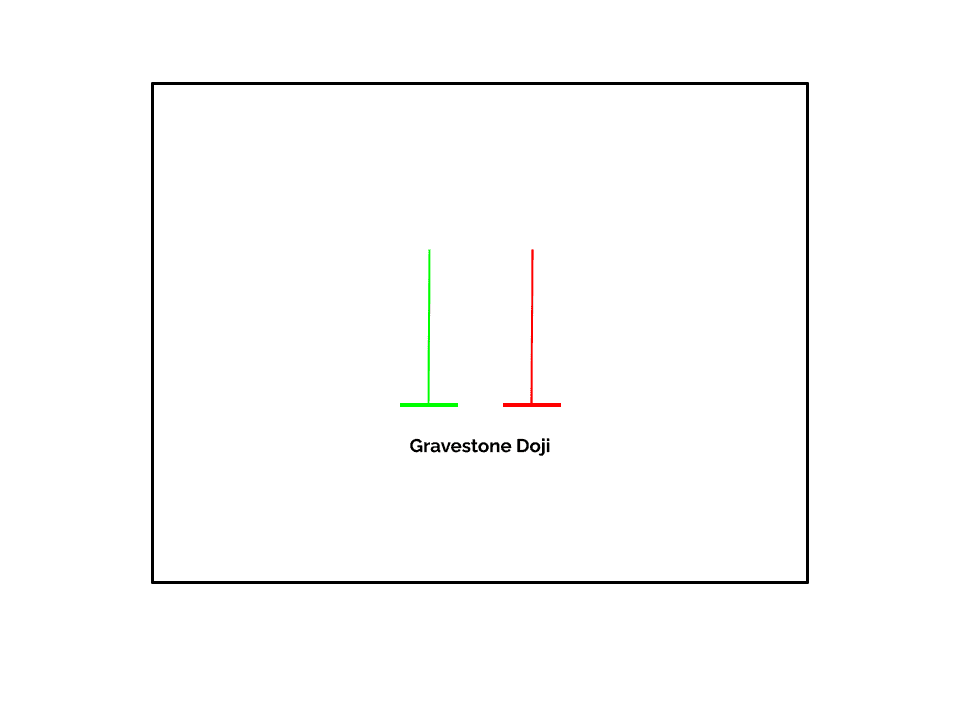
Variations include:
- Gravestone Doji (like a Shooting Star, bearish)
- Dragonfly Doji (like a Hammer, bullish)
A Gravestone Doji is a one-candlestick pattern resembling a Shooting Star appearing at the top of a Rally.
There are a few interesting variations to the Doji, but traders reconsider the market when the close is in the candle’s center with large shadows above and below.
In the example below, NZDUSD printed a Doji at the end of the selloff and every pullback in the subsequent rally.
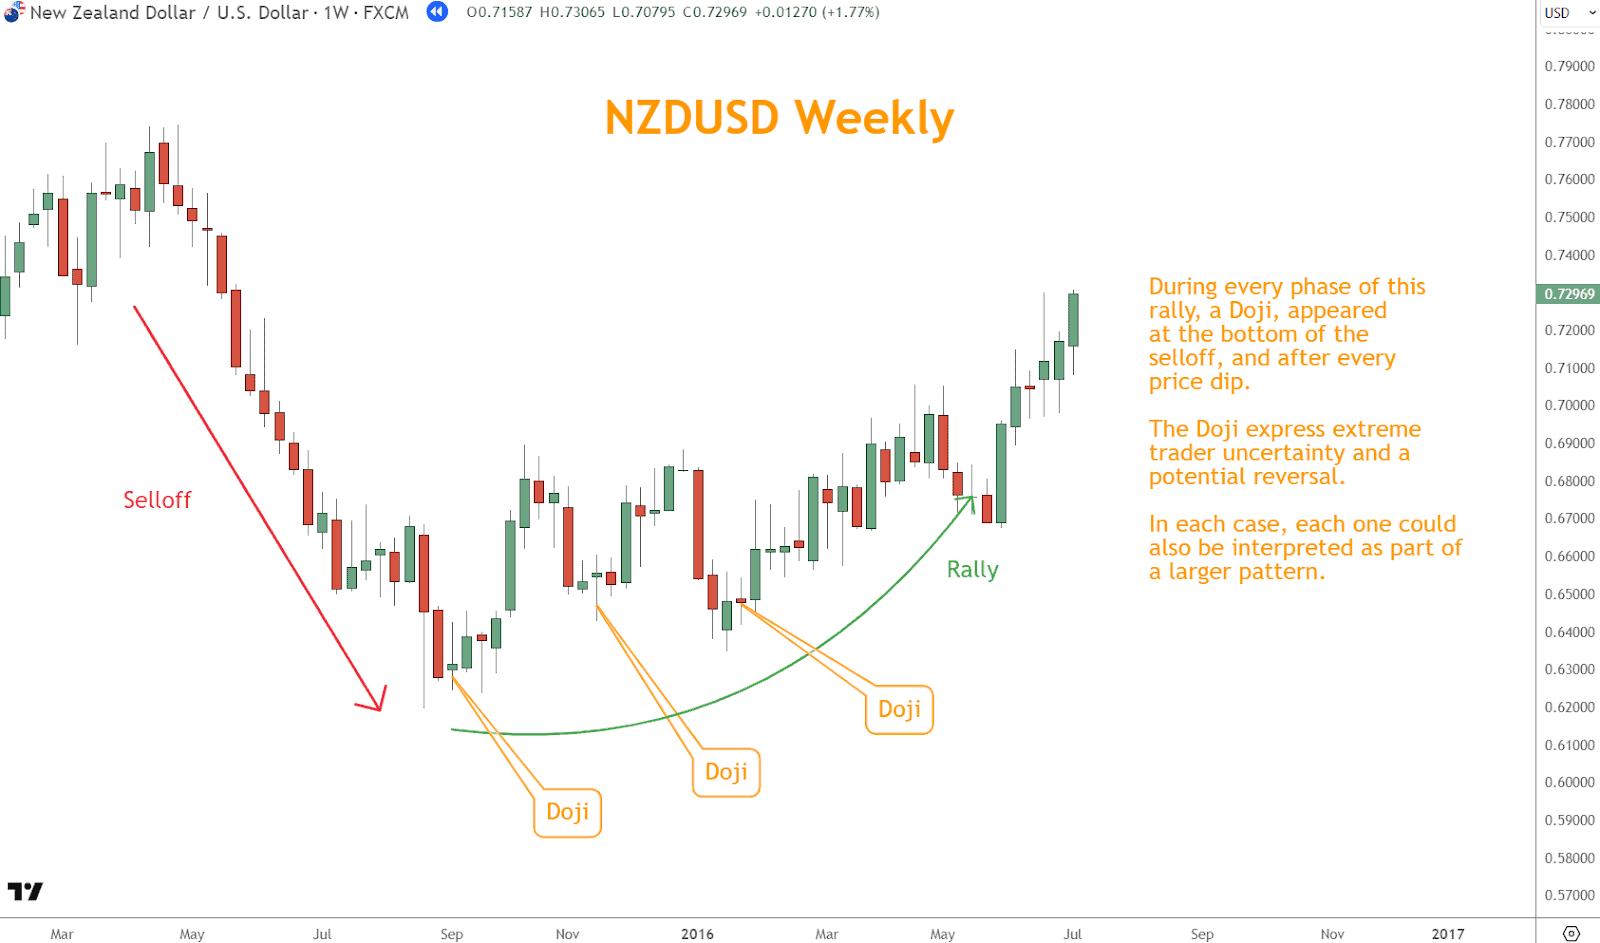
Doji candles are also part of multi-candle patterns like the Morning Star and Evening Star.
Combining One-Candle Patterns with Technical Tools
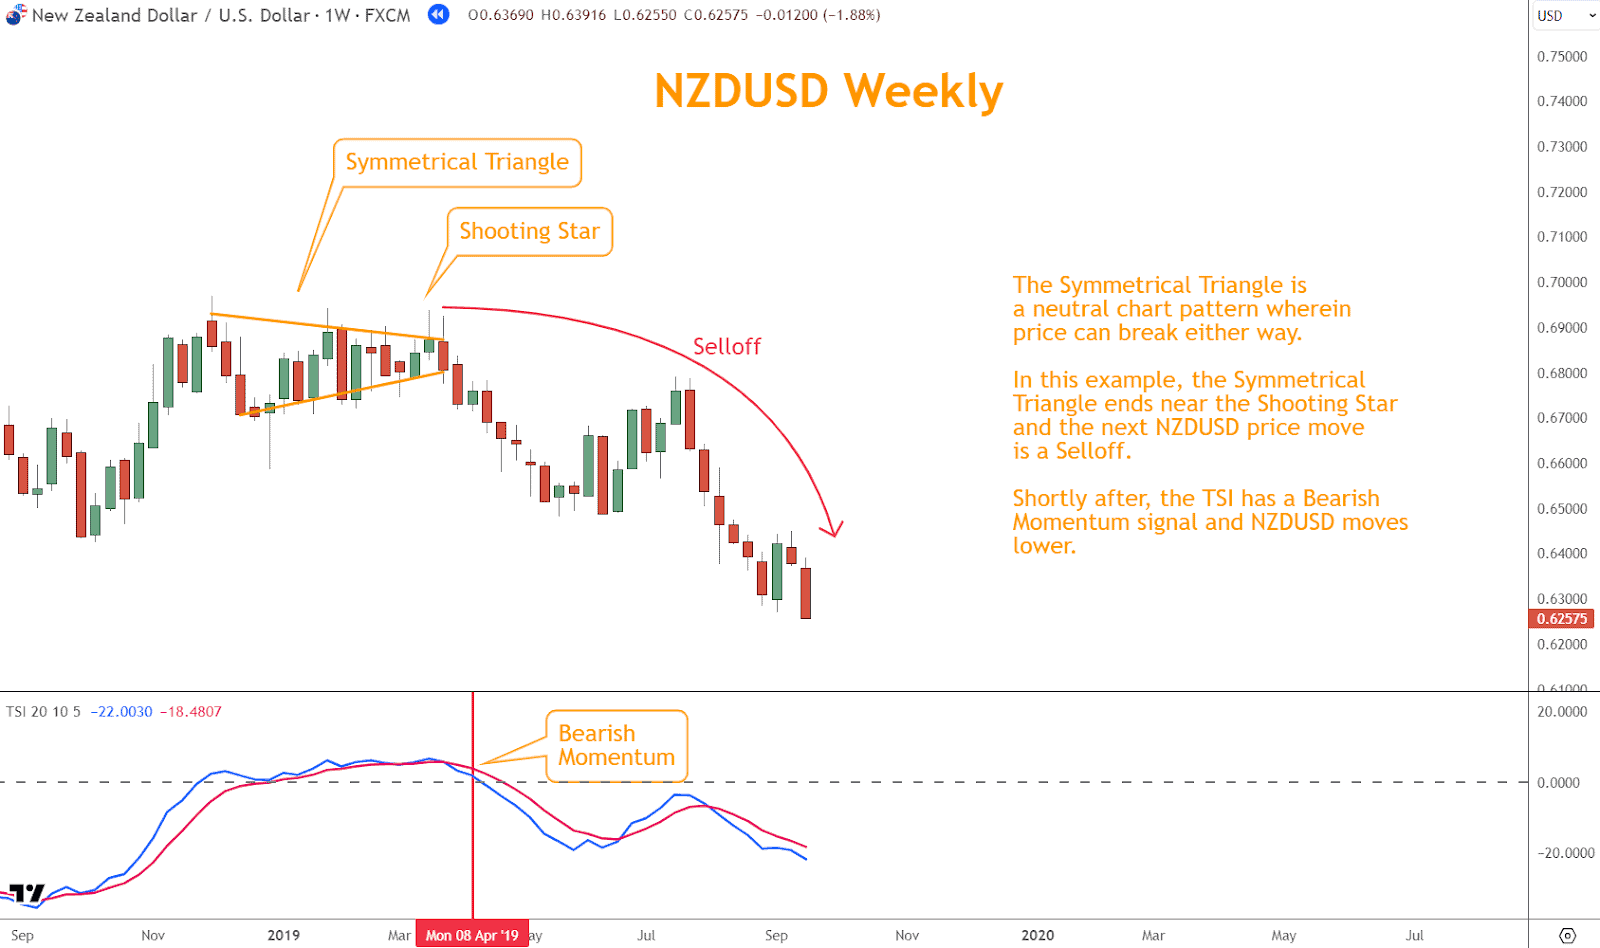
Combining one-candle Japanese candlestick patterns with the True Strength Index (TSI), chart patterns, and support/resistance levels improves trading decisions.
Candlesticks reveal sentiment and reversals within a session, while the TSI measures momentum strength and direction. Together, they confirm or challenge trade setups—for example, a bullish candlestick supported by a bullish TSI cross signals a stronger case for reversal.
- Momentum (TSI): Confirms whether price movement aligns with momentum.
- Chart Patterns: Validates triangles, head-and-shoulders, flags, etc.
- Support & Resistance: Key levels often strengthen candlestick signals.
Example: A Shooting Star at resistance, with bearish TSI divergence, offers a strong short setup.
Furthermore, integrating Japanese candlestick patterns with support and resistance levels enhances the accuracy of trade entries and exits.
Support and resistance levels represent price levels where buying or selling pressure is historically significant, often leading to reversals or continuations in price trends.
By identifying candlestick patterns forming near crucial support or resistance levels, you can anticipate potential price reactions and adjust your trading strategies accordingly.
Quiz: One-Candle Japanese Candlestick Patterns
- Which statement correctly distinguishes a Hammer from a Hanging Man?
a) Hammer appears at rally tops; Hanging Man at selloff bottoms
b) Hammer appears at selloff bottoms; Hanging Man at rally tops
c) Both appear only in sideways markets
d) Both require no confirmation - Which one-candle pattern is primarily a continuation signal (context allowing), unlike the others, which are typically reversals?
a) Doji
b) Spinning Top
c) Marubozu
d) Shooting Star - What is the core trading implication of a Shooting Star at the end of a rally?
a) Bulls have regained control, and continuation up is likely
b) Bears failed to push price lower, and a bounce is likely
c) Bulls failed to hold highs; bearish reversal risk has increased
d) Market indecision; no directional bias - Why is confirmation recommended after a Hammer or Hanging Man?
a) To meet broker requirements for order execution
b) To reduce false signals by ensuring the next candle starts the reversal
c) To calculate ATR correctly
d) Because one-candle patterns cannot form without it - Which pairing correctly matches the Doji variation with its typical directional bias when it appears in the proper context?
a) Gravestone Doji – bullish; Dragonfly Doji – bearish
b) Gravestone Doji – bearish; Dragonfly Doji – bullish
c) Both Gravestone and Dragonfly Doji – always continuation
d) Both Gravestone and Dragonfly Doji – neutral only
Answer Key
- b
- c
- c
- b
- b
Next Steps for Traders
Now that you know the five essential one-candle patterns:
- Open a chart and look for these patterns in real market conditions.
- Confirm with momentum, chart patterns, and support/resistance.
- Practice spotting them in both reversal and continuation contexts.
If you don’t yet have a structured trading strategy, start with our Six Basics of Chart Analysis—a free resource that builds the foundation for practical technical analysis.
By signing up, you’ll also receive Forex Forecast, a free weekly newsletter that includes:
- Trade ideas and setups using the Six Basics
- Case studies from real-world trades
- Educational guides and videos
- Updates on new articles and webinars

Frequently Asked Questions
What Are One-Candle Japanese Candlestick Patterns?
They are single-candle formations that reflect shifts in sentiment and potential reversals.
How Do I Identify Them?
By studying candlestick shape, shadows, body, and placement within a trend.
What Is Their Significance?
They help traders anticipate reversals, pauses, or continuations by reflecting psychology.
How Can I Use Them in My Trading?
Combine them with chart patterns, momentum indicators, and support/resistance for confirmation before entering trades.
Forex Trading Disclosure Statement
Risk Warning:
Forex trading involves significant risk and may not be suitable for all investors. The leveraged nature of Forex trading can work both for and against you, leading to substantial gains or losses. Before trading Forex, you should carefully consider your financial objectives, experience level, and risk tolerance. It is possible to lose more than your initial investment, and you should only trade with money you can afford to lose.
Market Risks and Volatility:
Forex markets are influenced by global economic, political, and social events, which can result in unpredictable price movements. High market volatility can lead to sudden and substantial changes in currency values, potentially causing losses that exceed your initial deposit.
Leverage Risks:
Leverage amplifies both potential gains and potential losses. While leverage can increase profitability, it also increases the risk of significant losses, including the loss of your entire trading capital.
Trading Tools and Technology Risks:
Forex trading platforms, including those offered by brokers, are subject to technology risks, such as system failures, latency issues, and potential errors in price feeds. Traders should be aware that these risks can impact the execution of trades and trading outcomes.
No Guarantee of Profitability:
Past performance in Forex trading is not indicative of future results. There is no guarantee that you will achieve profits or avoid losses when trading Forex. Market conditions and individual trading strategies vary, and no trading system can eliminate the inherent risks of Forex trading.
Educational Purposes Only:
Any information provided about Forex trading, including strategies, analysis, or market commentary, is for educational purposes only and should not be considered financial advice. Consult a qualified financial advisor or tax professional before making any trading decisions.
Regulatory Compliance:
Forex trading is regulated differently in various jurisdictions. Ensure that you are trading with a licensed and compliant broker in your country of residence.
Responsibility:
You are solely responsible for your trading decisions and the associated risks. It is your duty to understand the terms and conditions of Forex trading, including margin requirements, stop-losses, and other risk management tools.
Acknowledgment:
By engaging in Forex trading, you acknowledge that you have read, understood, and accepted this disclosure statement. You accept full responsibility for the outcomes of your trading decisions and agree to trade at your own risk.