
Momentum trading focuses on capturing the “energy” behind a price move—buying strength and selling weakness.
Instead of predicting reversals, momentum trading helps you participate in strong, active moves already underway.
In this guide, you’ll learn how momentum works, how to use popular indicators like RSI, Stochastic, CCI, and TSI, and how to combine them with trend, support/resistance, and candlestick analysis for better entries.
TL;DR
- Momentum = measuring short-term price energy to find entries within broader Trends.
- Use indicators such as RSI, Stochastic, CCI, TSI to spot overbought/oversold conditions.
- Best entries occur when momentum turns at support or resistance within an existing trend.
- Momentum alone is unreliable—combine with trend, candlesticks, chart patterns, and news context.
Table of Contents
- TL;DR
- What Is Momentum Trading?
- Trend vs. Momentum: Key Distinctions
- Does Momentum Trading Work?
- Volatility: The Opportunity and the Danger
- Using Momentum for Entry and Exit Timing
- Advantages and Disadvantages of Momentum Trading
- Popular Momentum Indicators (with Quick Table)
- RSI (Relative Strength Index)
- Stochastic Oscillator
- Commodity Channel Index (CCI)
- True Strength Index (TSI)
- Best Practices: Combining Momentum With Other Tools
- What’s Next?
- Frequently Asked Questions
- Conclusion
- Quiz (Multiple Choice)
- Answer Key
What Is Momentum Trading?
Momentum trading focuses on shorter-term price movements rather than long-term fundamentals. The aim is simple:
Buy instruments gaining strength; sell instruments losing strength.
Momentum typically shows up during:
- Recoveries out of pullbacks
- Breakouts from consolidations
- Acceleration phases within Trends
It is not the same as trend trading. Trend measures direction. Momentum measures speed and energy.
You can use momentum to time entries within a trend.
Trend vs. Momentum: Key Distinctions
| Concept | What It Measures | Purpose | Example |
| Trend | Overall direction (HH/HL or LH/LL) | Defines Bullish, Bearish, Neutral market | EUR/USD making higher lows for weeks |
| Momentum | Speed + strength behind short-term moves | Identifies Overbought/Oversold conditions and entry timing | RSI turning upward after a pullback |
Momentum entries work best when they align with the prevailing Trend.
Does Momentum Trading Work?
Momentum trading works because price often continues in the direction of strong energy. Short-term mispricing—expressed by Overbought or Oversold conditions—creates entry opportunities.
Momentum helps you:
- Time entries with greater precision
- Identify accelerating moves early
- Avoid false signals from Trend-only tools
- Capture profit before energy fades
But momentum is reactive—not predictive—so it must be paired with other tools.
Volatility: The Opportunity and the Danger
Momentum thrives in volatile markets:
- High volatility = frequent momentum shifts = more entry points.
- Low volatility = fewer opportunities but cleaner signals.
Key Principles
- Rapid moves = smaller position sizes (higher risk)
- Pullbacks in trends = high-quality entries
- Breakouts with momentum = powerful continuation signals
Be prepared to adjust risk when volatility is elevated.
Using Momentum for Entry and Exit Timing
Perfect timing is rare, but momentum provides structure.
A common pattern:
- A strong uptrend pulls back
- Momentum becomes neutral or bearish
- You wait for momentum to turn upward again
- You buy the continuation (“buy the dip”)
This works the opposite way in a selloff (“sell the rip”).
The best entries align:
- Trend
- Momentum reversal
- Candlestick reversal
- Support or resistance
Ideal timing depends on combining momentum with trend and other technical analyses such as chart patterns, Japanese Candlesticks, and support and resistance.
If an instrument is already in an established bullish trend but has recently experienced a short-term pullback, this will be reflected in a momentum indicator.
In all likelihood, this indicator has turned neutral or even bearish.
With patience, you can wait to see if the instrument’s price starts moving higher, taking the indicator higher.
This is an opportunity to enter a long position believing the trend and momentum will move higher after a brief “dip.”
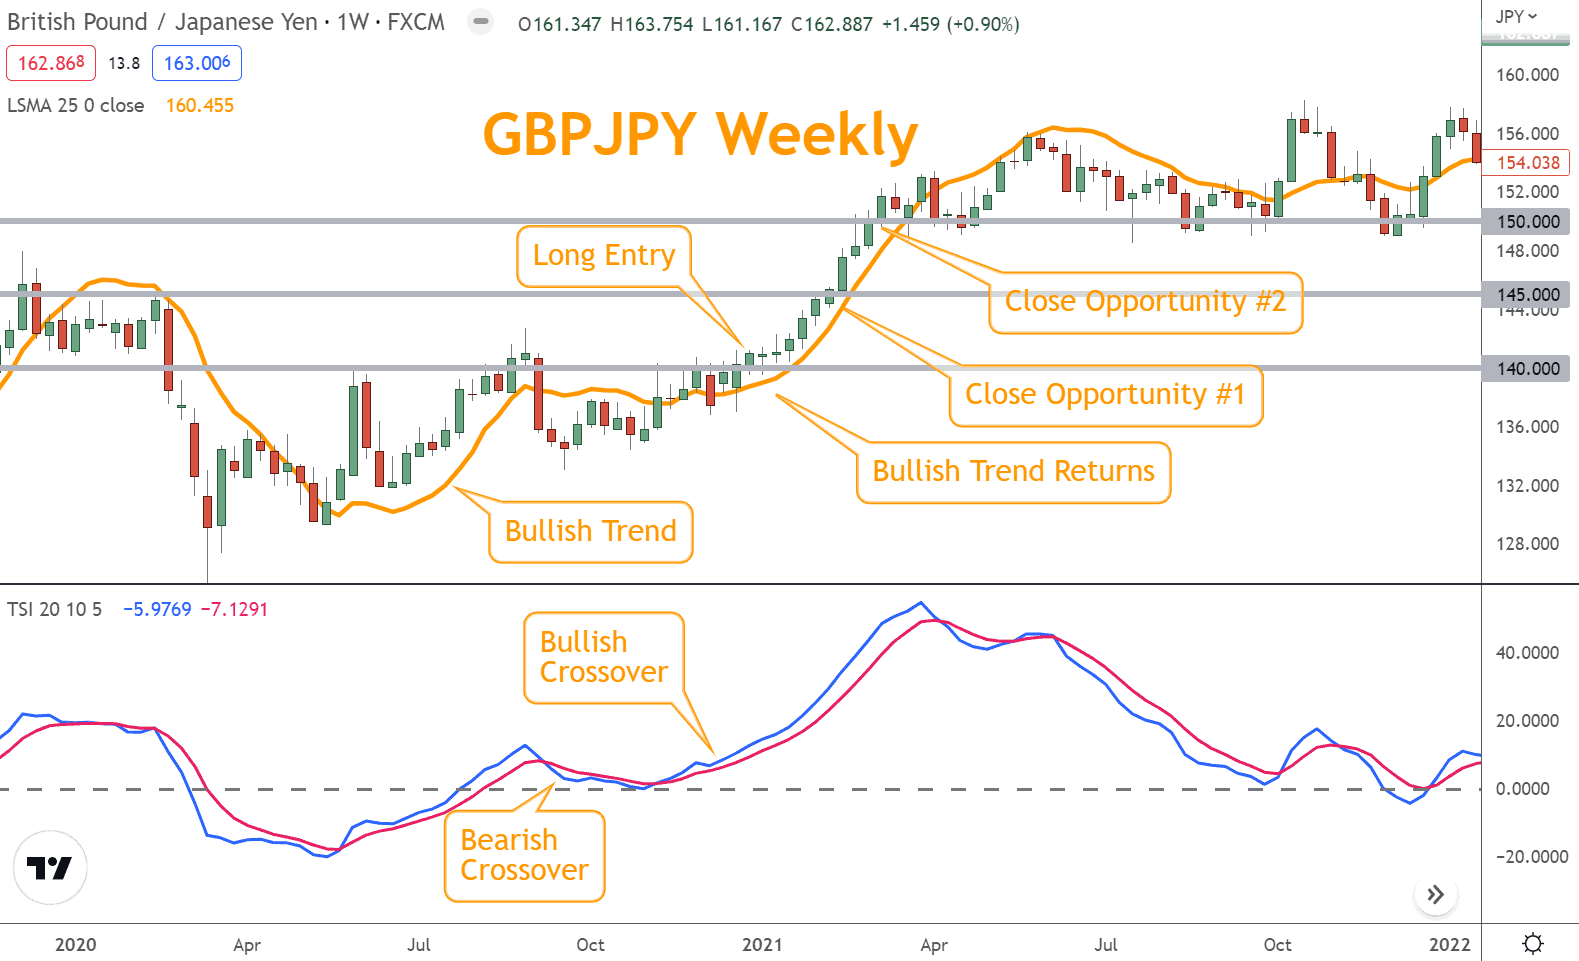
In the GBP/JPY example, the bullish trend moved to neutral in October of 2020, returning in 2021. This price action turned the TSI momentum indicator bearish.
Once the bullish trend returned and the TSI confirmed it, a long entry appeared.
Multiple exits are available as GBP/JPY rose through support/resistance levels.
No single indicator should act alone.
Looking for a Strategy?
Download the Six Basics of Chart Analysis and sign up for Forex Forecast to learn a bottom-up approach to analyzing Forex markets and weekly market updates.
Advantages and Disadvantages of Momentum Trading
Advantages
| Advantage | Why It Matters |
| Capitalizes on volatility | More opportunities to enter and exit |
| Keeps more profit during open trades | You exit when Momentum fades, not at Trend exhaustion |
| Multiple entries in long Trends | Reenter after pullbacks |
| Filters false Trend signals | Helps confirm strength |
Disadvantages
| Disadvantage | Why It’s a Problem |
| Fast markets can prevent entries | Price can run without you |
| Early exits caused by Overbought/Oversold | Momentum can mislead without context |
| Conflicts with other tools | Requires disciplined interpretation |
| Sentiment-driven moves | Momentum can spike from news, causing confusion |
Popular Momentum Indicators (with Quick Table)
| Indicator | Best Use | Overbought/Oversold Regions | Notes |
| RSI | Measure trend energy + reversals | Above 70 / Below 30 | Divergence exists, but it is unreliable |
| Stochastic | Fast signals; good for ranges | Above 80 / Below 20 | Works similarly to RSI but with different math |
| CCI | Detect extreme deviations | Above +100 / Below –100 | Useful in wide-swing markets |
| TSI | Smoother Momentum changes | Above/below zero line | Includes trend component |
RSI (Relative Strength Index)
- Measures the average rate of change
- 14-period standard
- Buy when RSI recovers from below 30
- Sell when RSI weakens from above 70
Buy signals are generated when the RSI crosses back above its centerline after dipping below it during a selloff; conversely, sell signals occur when the RSI falls below its centerline after a rally.
You can also use the RSI to identify periods of divergence where a forex pair is making new price highs, but the RSI is making lower price highs.
This divergence can indicate lower prices ahead (the converse is also true). However, while this is a popular idea, divergence strategies are unreliable.
An example of a successful divergence correction is in the GBP/JPY chart below.
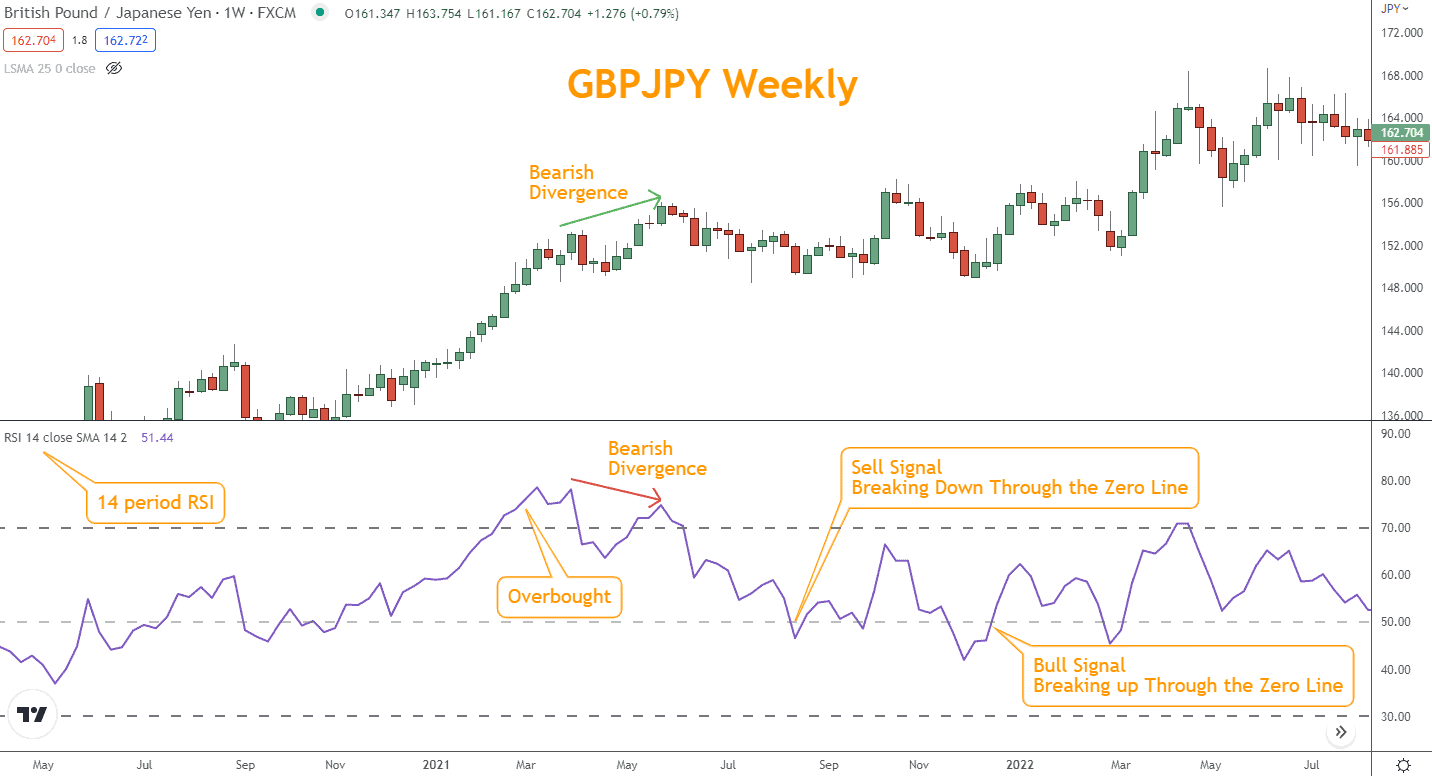
Divergence is possible, but unreliable without context.
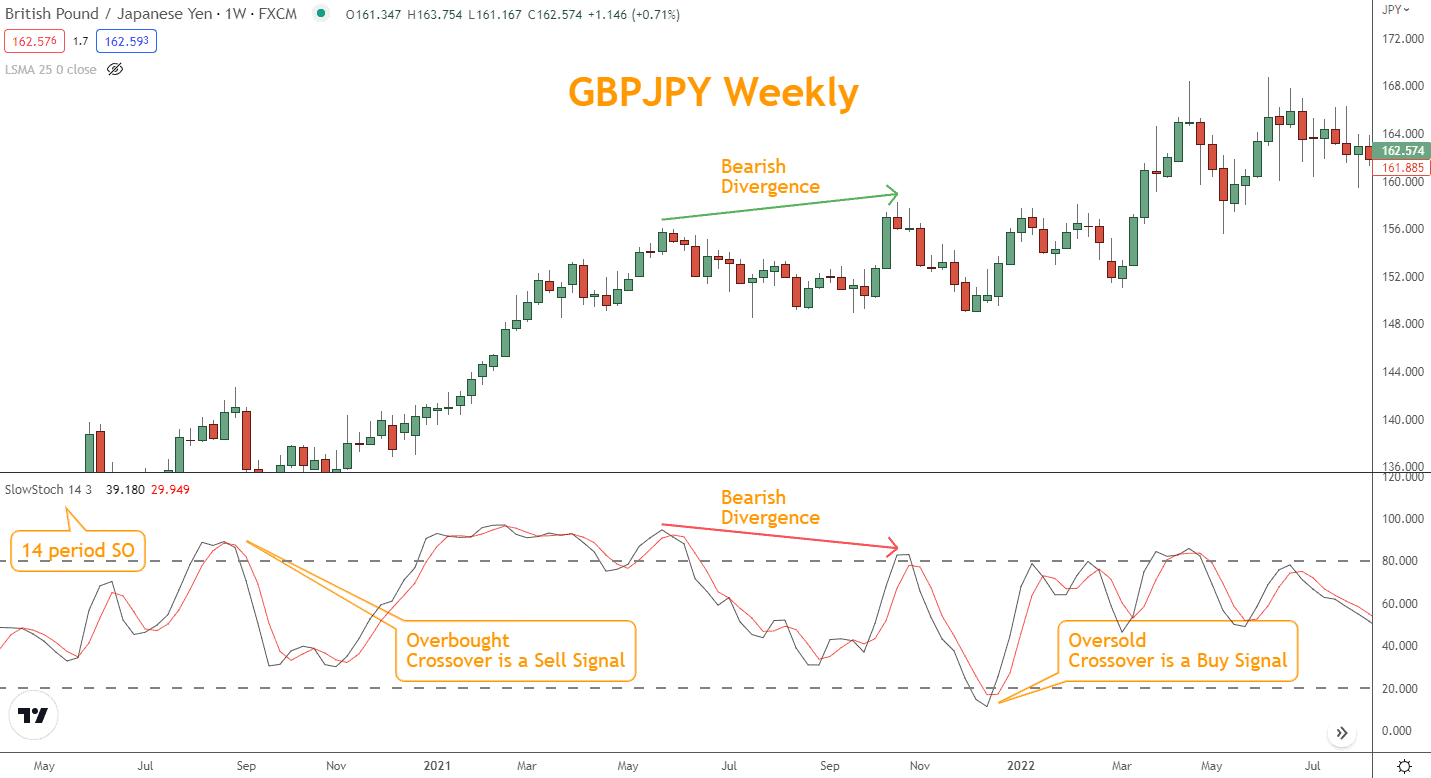
Stochastic Oscillator
- Measures close relative to the recent range
- Signals when the indicator and the signal line cross
- Best for identifying exhaustion in ranges or pullbacks
The indicator consists of an indicator line that oscillates between 0 and 100 and a signal line that shows the day’s close relative to a 14-day average.
The market is overbought or oversold when the Stochastic Oscillator exceeds 80 or falls below 20.
When the indicators and signal lines cross in the overbought or oversold regions, traders can take this as a direct signal to buy or sell.
This indicator has a “fast” version and a “slow” version.
The slow version featured here smooths out the jittery nature of the fast variant.
The primary difference between the RSI and the Stochastic Oscillator lies in their calculation methods.
The Stochastic Oscillator is calculated using price highs and lows, whereas the RSI focuses on price differences over time.
Although their calculation methods differ, the results on the chart are similar. The same divergence seen on the GBP/JPY chart using the RSI is also evident in the Stochastic below.
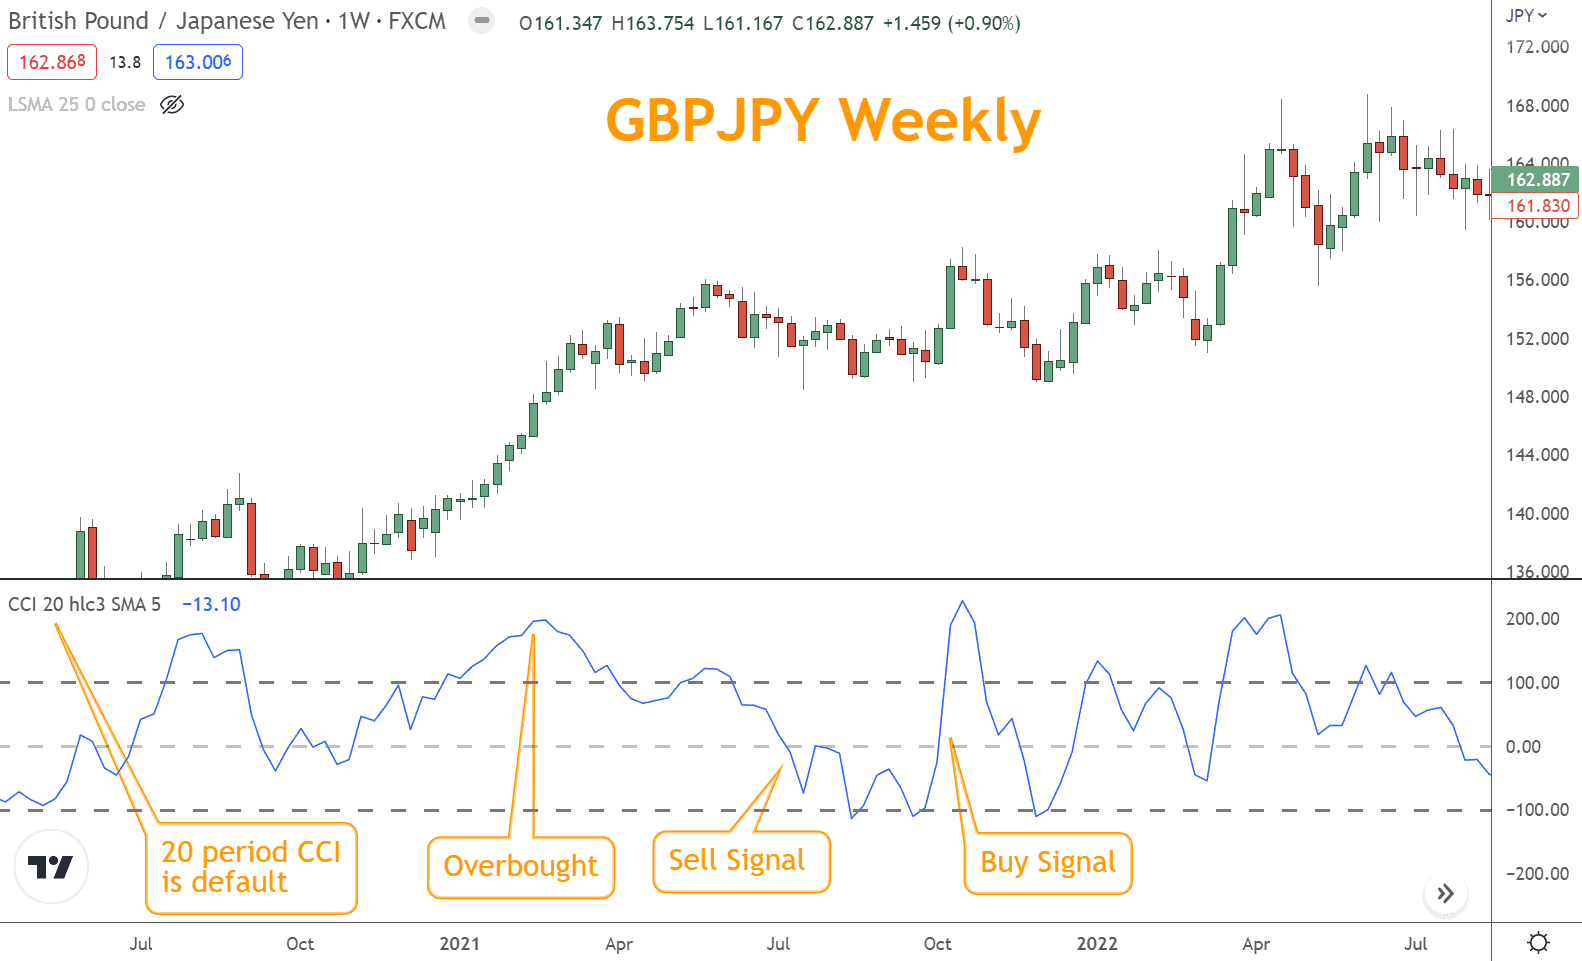
Commodity Channel Index (CCI)
- Measures deviation from a moving average
- Excellent at identifying extremes
- Works well with channel structures
The CCI measures the current price level relative to its average over a specific period.
The indicator consists of an oscillator that moves between positive and negative territory; readings above +100 indicate overbought conditions, while readings below -100 represent oversold territory.
Buy signals and sell signals occur when the CCI crosses above or below its centerline.
The GBP/JPY chart below illustrates that the CCI indicator is similar to its peers.
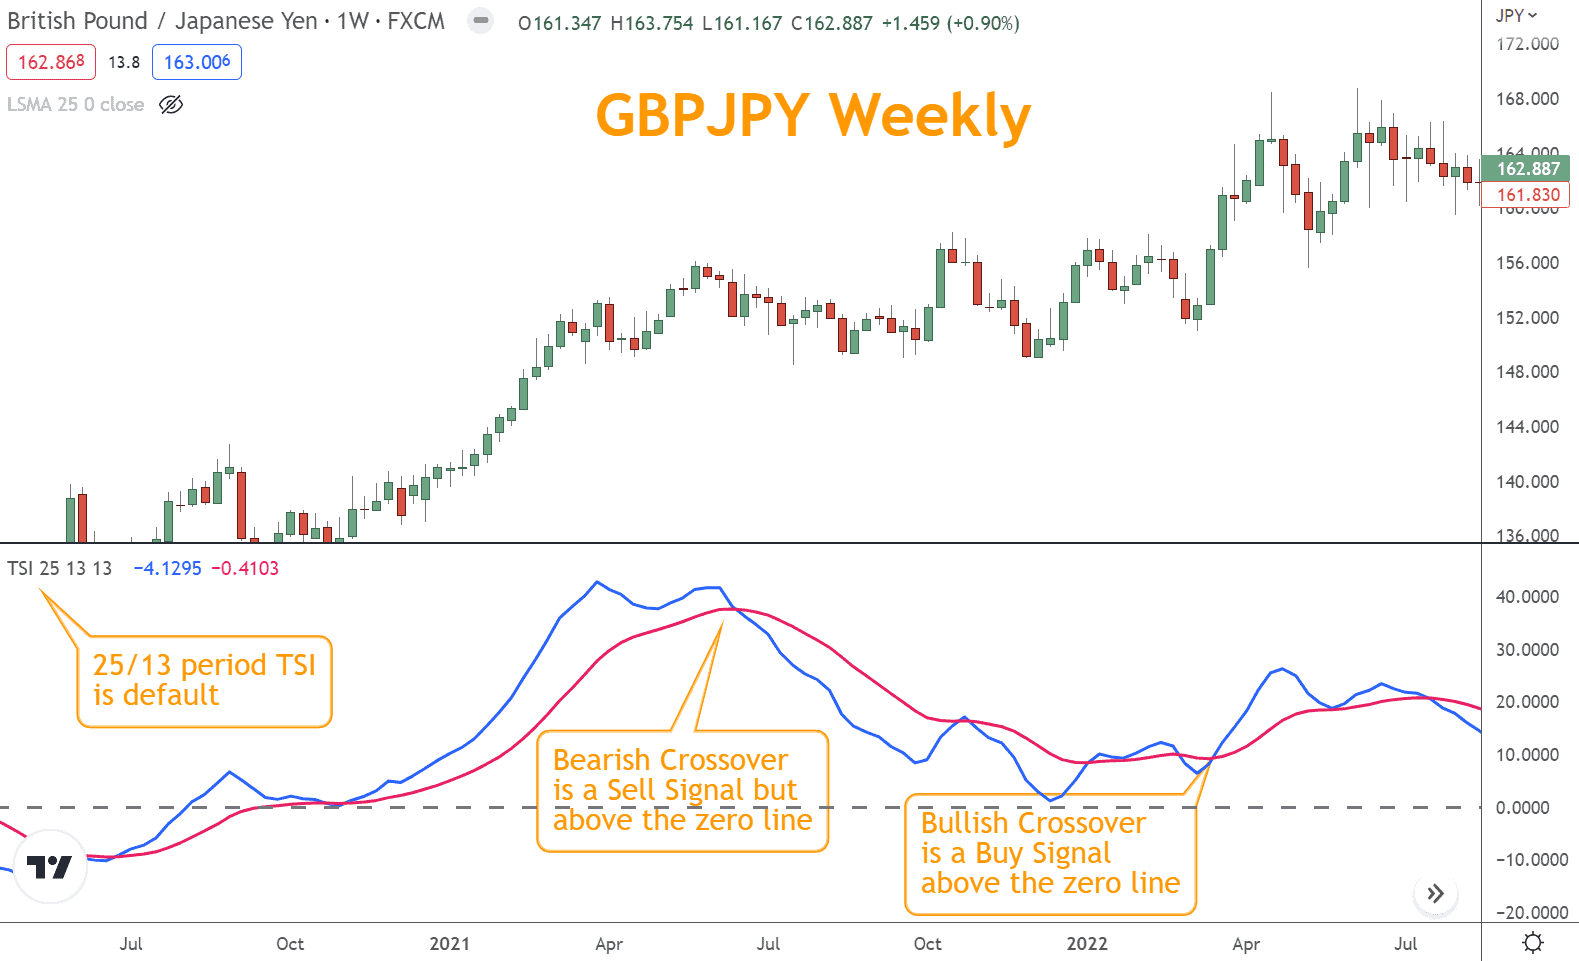
True Strength Index (TSI)
- Two moving averages = cleaner signals
- Zero-line = bias
- Crossovers = entries
When the fast-moving average crosses above or below the slow-moving average, it generates buy or sell signals.
The center or zero line also symbolizes a bullish or bearish bias, depending on where the TSI lines are and where they are going relative to price.
Therefore, you can take long trades when the TSI is above the zero line and short ones below the “0” line.
The True Strength Index can also be used to identify divergence.
When price action makes a new high or low, but the indicator fails to do so, this may signal an imminent reversal.
Like other indicators, however, divergence is an unreliable method.
The most noticeable difference the TSI has compared to its momentum indicator peers is the smoothness of its lines.
The TSI is less “noisy” than its contemporaries.
Best Practices: Combining Momentum With Other Tools
Momentum is never enough on its own. Pair it with:
- Trend (to know direction)
- Candlesticks (to confirm reversals)
- Chart Patterns (flags, triangles, wedges)
- Support & Resistance (to confirm turning points)
- News & events (to understand volatility spikes)
Momentum is the “trigger,” not the “reason.”
What’s Next?
Choose a few currency pairs and:
- Add a momentum indicator
- Identify overbought/oversold conditions
- Compare momentum with trend, candlesticks, and S/R
- Practice timing entries within trends
Want a structured approach? Download the Six Basics of Chart Analysis for free. You’ll also receive the Forex Forecast every Sunday, including:
- Trade ideas based on the Six Basics
- Case studies showing successful applications
- Educational guides and strategy videos
- Updates from positionforex.com and upcoming webinars
This combination will strengthen your technical foundation and help you use the momentum indicators more effectively in real-world trading.

Frequently Asked Questions
Is There a Difference Between Short-Term and Long-Term Momentum Trading?
Yes—short-term signals are less reliable due to lower participation. Longer-term signals (weeks/months) reflect institutional behavior and are more trustworthy.
What Are the Best Momentum Trading Strategies?
- Buy the dip / sell the rip
- Breakouts confirmed by Momentum
- Momentum shifts at key S/R levels
- Combining Momentum with Chart Patterns
Which Indicator Is Best for Momentum Trading?
No single indicator is “best.” It depends on your platform, timeframe, and how well you interpret signals in context.
How Do I Become a Momentum Trader?
By integrating Momentum with Trend, Support/Resistance, Candlesticks, and risk management—not by trading Momentum alone.
Conclusion
Momentum trading gives you a powerful way to time entries and exits within larger trends.
By pairing Momentum with structure such as trend, candlesticks, chart patterns, and support/resistance, you gain a clearer picture of where high-probability trades exist.
Practice, repetition, and disciplined risk management are the keys to making momentum one of the most reliable components in your trading arsenal.
Quiz (Multiple Choice)
1. What does Momentum measure?
A. Long-term direction
B. Energy behind short-term price movement
C. Fundamental value
D. Lot size
2. Which indicator uses +100 and –100 as thresholds?
A. RSI
B. TSI
C. CCI
D. MACD
3. Momentum works best when combined with:
A. Only Trend
B. Trend, Candlesticks, Support/Resistance
C. Pip value calculations
D. Margin requirements
4. Overbought on RSI typically begins at:
A. 20
B. 30
C. 70
D. 100
5. A common Momentum strategy within an uptrend is:
A. Selling every rally
B. Ignoring pullbacks
C. Buy-the-dip when Momentum turns upward
D. Entering only during consolidations
Answer Key
- B
- C
- B
- C
- C
Forex Trading Disclosure Statement
Risk Warning
Forex trading involves significant risk and may not be suitable for all investors. The leveraged nature of Forex trading can work both for and against you, leading to substantial gains or losses. Before trading Forex, you should carefully consider your financial objectives, experience level, and risk tolerance. It is possible to lose more than your initial investment, and you should only trade with money you can afford to lose.
Market Risks and Volatility
Forex markets are influenced by global economic, political, and social events, which can result in unpredictable price movements. High market volatility can lead to sudden and substantial changes in currency values, potentially causing losses that exceed your initial deposit.
Leverage Risks
Leverage amplifies both potential gains and potential losses. While leverage can increase profitability, it also increases the risk of significant losses, including the loss of your entire trading capital.
Trading Tools and Technology Risks
Forex trading platforms, including those offered by brokers, are subject to technology risks, such as system failures, latency issues, and potential errors in price feeds. Traders should be aware that these risks can impact the execution of trades and trading outcomes.
No Guarantee of Profitability
Past performance in Forex trading is not indicative of future results. There is no guarantee that you will achieve profits or avoid losses when trading Forex. Market conditions and individual trading strategies vary, and no trading system can eliminate the inherent risks of Forex trading.
Educational Purposes Only
Any information provided about Forex trading, including strategies, analysis, or market commentary, is for educational purposes only and should not be considered financial advice. Consult a qualified financial advisor or tax professional before making any trading decisions.
Regulatory Compliance
Forex trading is regulated differently in various jurisdictions. Ensure that you are trading with a licensed and compliant broker in your country of residence.
Responsibility
You are solely responsible for your trading decisions and the associated risks. It is your duty to understand the terms and conditions of Forex trading, including margin requirements, stop-losses, and other risk management tools.
Acknowledgment
By engaging in Forex trading, you acknowledge that you have read, understood, and accepted this disclosure statement. You accept full responsibility for the outcomes of your trading decisions and agree to trade at your own risk.
This disclosure is intended to provide an overview of the risks associated with Forex trading and is not exhaustive. For additional information, consult your broker and other reliable financial resources.