
Momentum indicators are mathematical tools that evaluate the velocity and magnitude of price changes within a specified timeframe.
By examining the rate of change and oscillation around a centerline (often zero), they reveal the strength of the trend, potential reversals, and overbought/oversold extremes.
Used with risk management and complementary analysis, they help you time entries, exits, and confirmations.
TL;DR – Master These 5 Momentum Best Practices
This article teaches five best practices for using momentum in Forex:
- Understand how momentum indicators measure rate-of-change and oscillate around a centerline,
- Use divergence and hidden divergence to spot reversals or continuations,
- Confirm other signals (e.g., moving averages) with momentum,
- Time entries on pullbacks and exits near exhaustion/overbought-oversold, and
- Integrate risk management and fundamentals to improve decision quality.
Quick Reference: Momentum Best Practices
| Best Practice | What It Means | How to Apply | Why It Helps |
| Understand Rate-of-Change & Centerline | Momentum compares current vs. past prices and oscillates around zero/centerline | Read values above the centerline as bullish bias, below as bearish; gauge strength by the distance from the centerline | Frames trend strength and context quickly |
| Spot Divergence & Hidden Divergence | Price and indicator move out of sync (reversal) or in sync with the indicator leading (continuation) | Bullish/bearish divergence to flag reversals; hidden divergence to flag trend continuation | Anticipates turning points or trend resumes |
| Confirm Trade Setups | Use momentum to validate signals from other tools | Pair RSI/TSI with moving averages, channels, or S/R | Reduces false positives and improves conviction |
| Time Entries & Exits | Enter on pullbacks or breakouts with building momentum; exit on waning momentum | Buy pullbacks in uptrends when momentum rebuilds; take profits as momentum fades or at extremes | Improves reward-to-risk and discipline |
| Manage Risk & Add Fundamentals | Adjust stops/size with momentum context; overlay macro drivers | Tighten/loosen stops with momentum; align with data, policy, and events | Balances technicals with market realities |
Quick Reference: RSI vs. TSI
| Indicator | Core Idea | Signal Types | Common Uses | Notes |
| RSI (Relative Strength Index) | Measures speed/change of price moves, 0–100 scale | Overbought >70, Oversold <30; Divergence; Centerline behavior | Identify exhaustion, time pullbacks, and confirm breakouts | Typically, a 14-period; watch divergences vs. price |
| TSI (True Strength Index) | Uses two smoothed MAs of price changes, oscillates around zero | Centerline crossovers; Signal-line crossovers; Overbought/Oversold context | Gauge underlying trend, momentum, and shifts | Bullish when above the centerline or signal; bearish below |
Table of Contents
- TL;DR – Master These 5 Momentum Best Practices
- Quick Reference: Momentum Best Practices
- Quick Reference: RSI vs. TSI
- What Are Momentum Indicators?
- How Do Momentum Indicators Work?
- Types of Momentum Indicators
- How to Use Momentum in Forex Trading
- Tips for Effective Use of Momentum Indicators
- Conclusion
- What’s the Next Step?
- Frequently Asked Questions
- What is the significance of these indicators in Forex trading?
- How does momentum work in trading?
- What are some common types of momentum indicators used in Forex trading?
- How can traders effectively utilize momentum in their trading strategy?
- What are some tips for successfully applying momentum in Forex trading?
- Forex Trading Disclosure Statement
What Are Momentum Indicators?
Momentum indicators are mathematical tools that evaluate the velocity and magnitude of price changes within a specified timeframe.
By tracking the rate of price change over a given period, they reveal the strength or weakness behind a move and help you anticipate potential shifts in market sentiment. As prices gain momentum in one direction, the probability of that move persisting often increases.
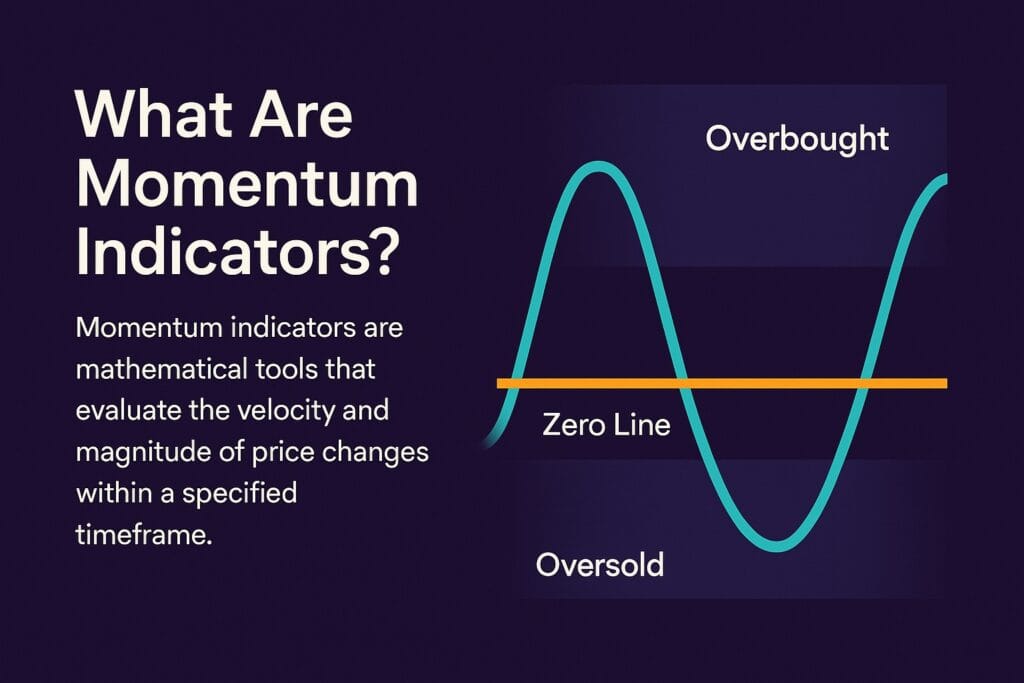
These indicators typically manifest as oscillators that fluctuate around a central reference point, such as the zero line.
This oscillatory behavior helps you gauge intensity, identify overbought/oversold conditions, and make more informed timing decisions to mitigate risk and maximize potential profits.
Momentum indicators play a pivotal role by contextualizing the strength and direction of market trends.
How Do Momentum Indicators Work?
Momentum indicators analyze the rate of price change over a specified period to assess the strength and direction of trends.
They operate on the principle that as prices gather momentum in a particular direction, the likelihood of continuation increases—until momentum fades or reverses.
They commonly compare current prices to historical prices over a defined period, using formulas to assess the speed and magnitude of moves.
Most momentum indicators oscillate around a centerline or zero line: values above often indicate bullish momentum, while values below suggest bearish momentum; distance from the centerline reflects strength.
They also identify overbought/oversold extremes and highlight divergences between price and indicator that can foreshadow sentiment shifts.
Because momentum tools are dynamic, they recalculate with new data and are well-suited to confirming trend strength and adapting tactics in real time.
Types of Momentum Indicators
Momentum indicators are essential tools in every Forex trader’s arsenal. They provide quantitative, time-sensitive context for rate of change, helping you identify opportunity and manage risk.
Below are two widely used indicators—RSI and TSI—each offering unique perspectives on trend strength and potential reversals.
Relative Strength Index (RSI)
The Relative Strength Index measures the speed and change of price movements on a 0–100 scale, typically over 14 periods.
A reading above 70 suggests overbought conditions that may precede a pullback or reversal, while a reading below 30 suggests oversold conditions that may precede a rebound. Divergences between RSI and price can flag weakening or strengthening momentum before price turns.
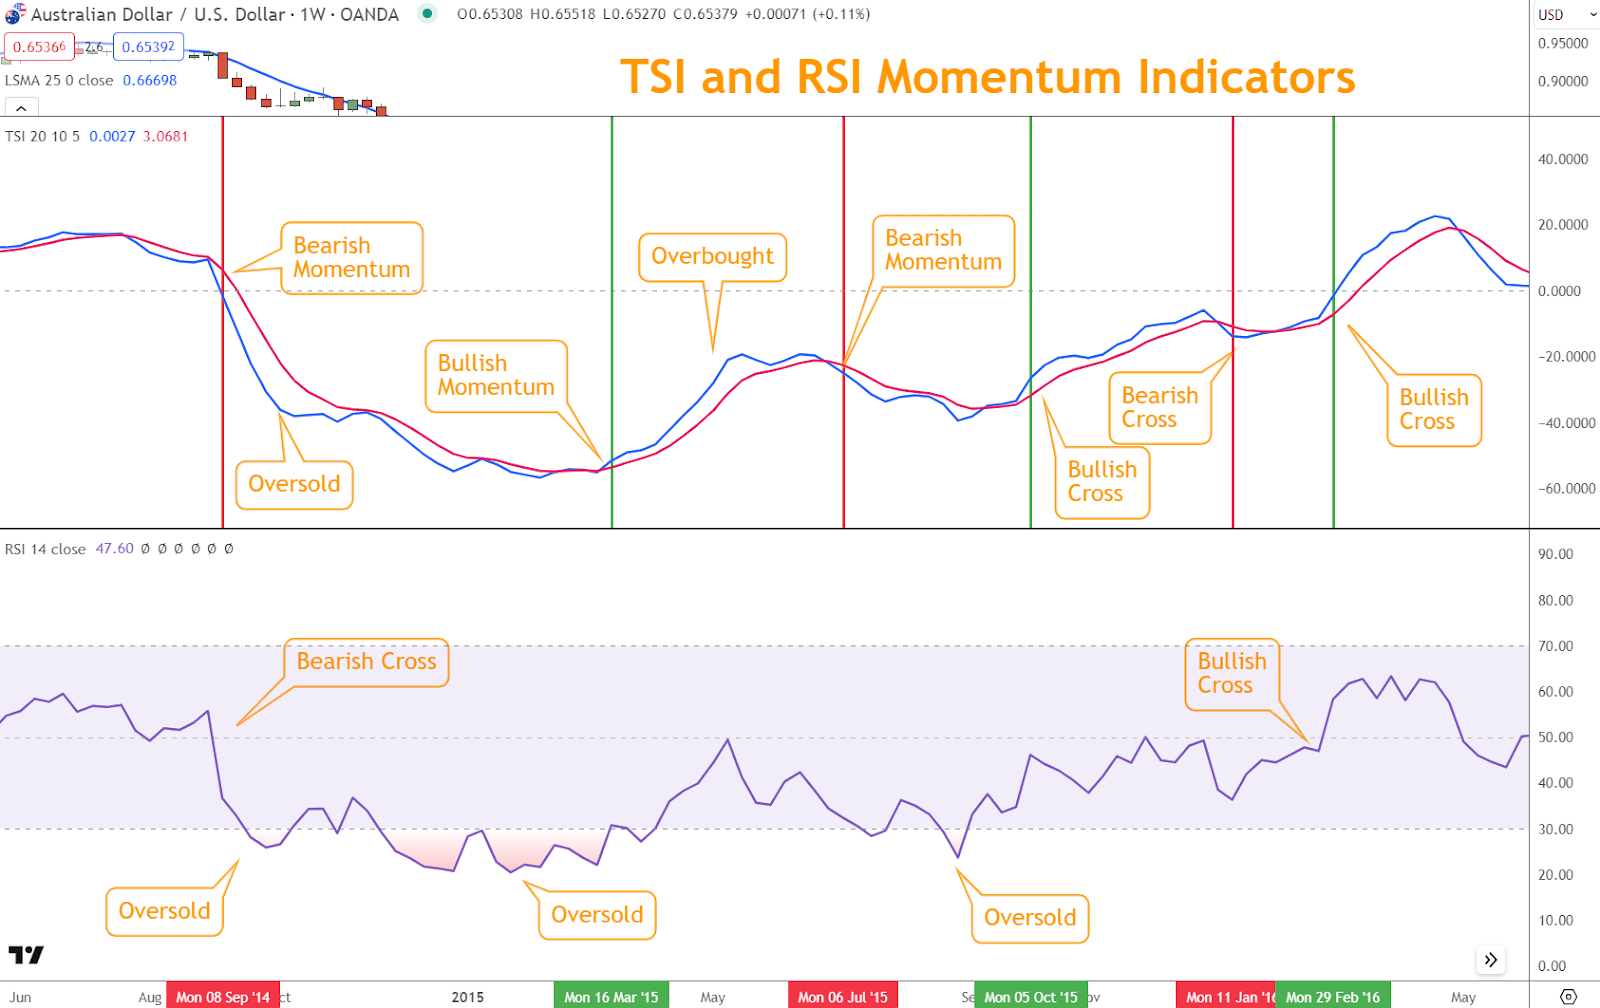
True Strength Index (TSI)
The True Strength Index is a momentum oscillator derived from two smoothed moving averages of price changes.
By comparing the differences and absolute values of these averages, TSI produces an oscillator around a centerline, indicating overbought/oversold conditions and momentum shifts.
Bullish signals often occur when TSI crosses above the centerline or its signal line; bearish signals can occur on crosses below those lines.
These two momentum indicators provide valuable insight into trend strength and reversal risk.
Understanding how each works—and where each is most informative—improves timing and confidence in your trading decisions.
Looking for a Strategy?
Download the Six Basics of Chart Analysis and sign up for Forex Forecast to learn a bottom-up approach to analyzing Forex markets and weekly market updates.
How to Use Momentum in Forex Trading
Momentum indicators are versatile. They help you spot reversals, confirm setups from other tools, refine timing, and manage risk throughout a trade’s life cycle.
The techniques below show you how to translate signals into practical actions.
Spotting Reversals: Divergence and Hidden Divergence
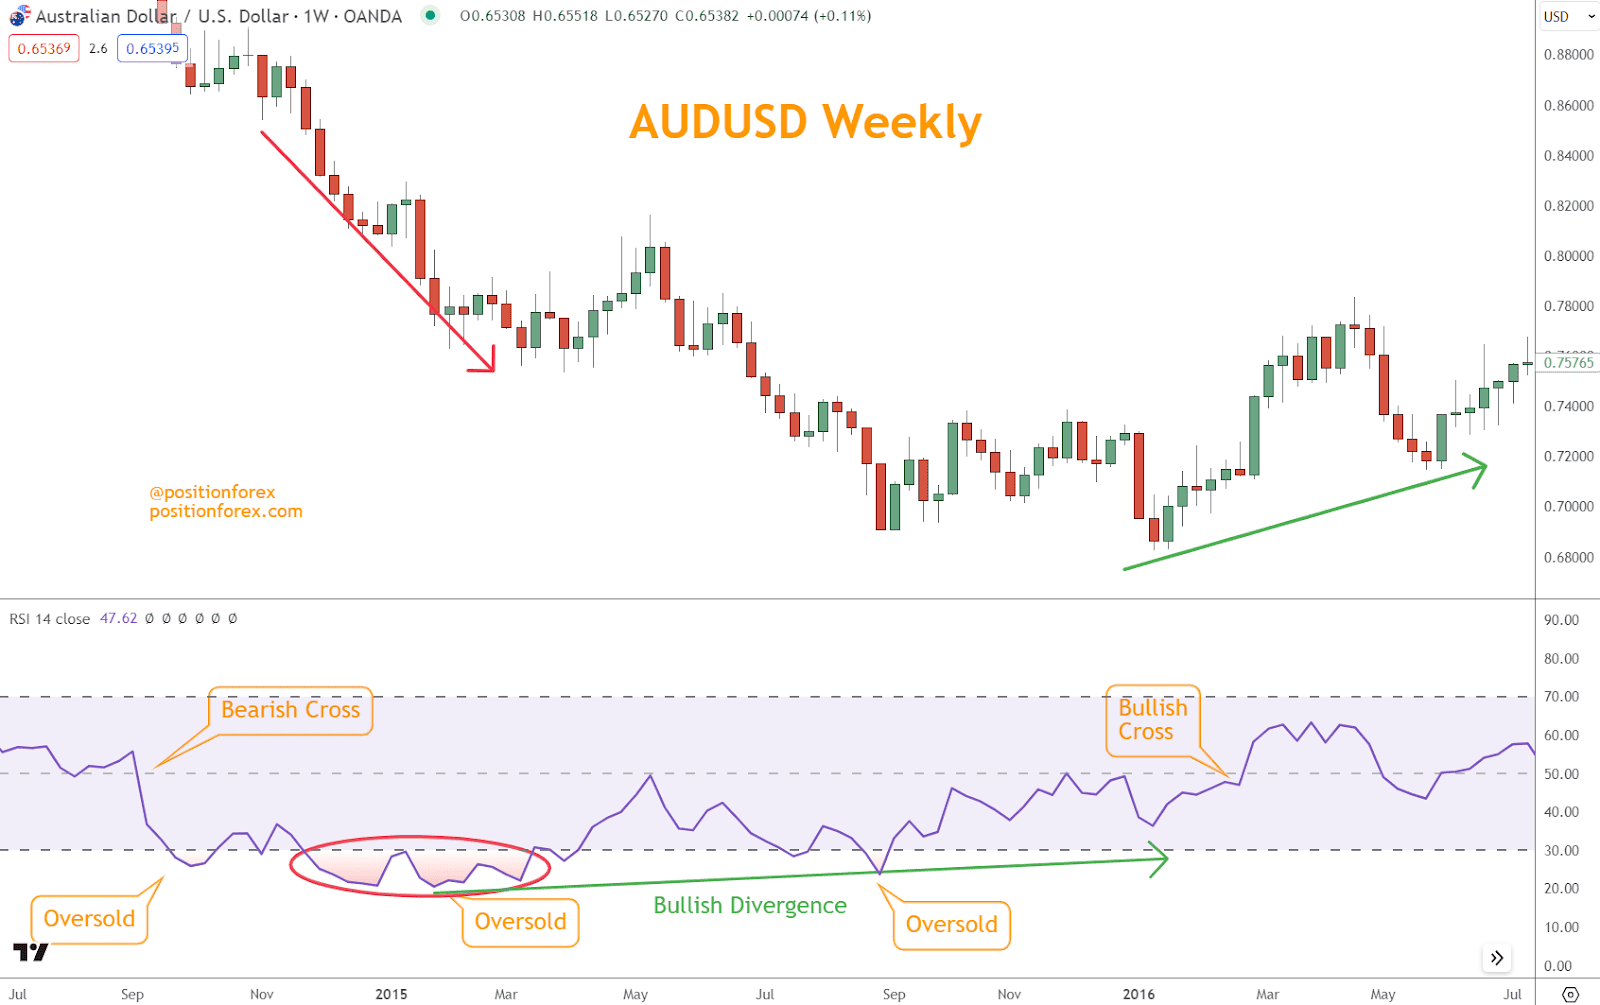
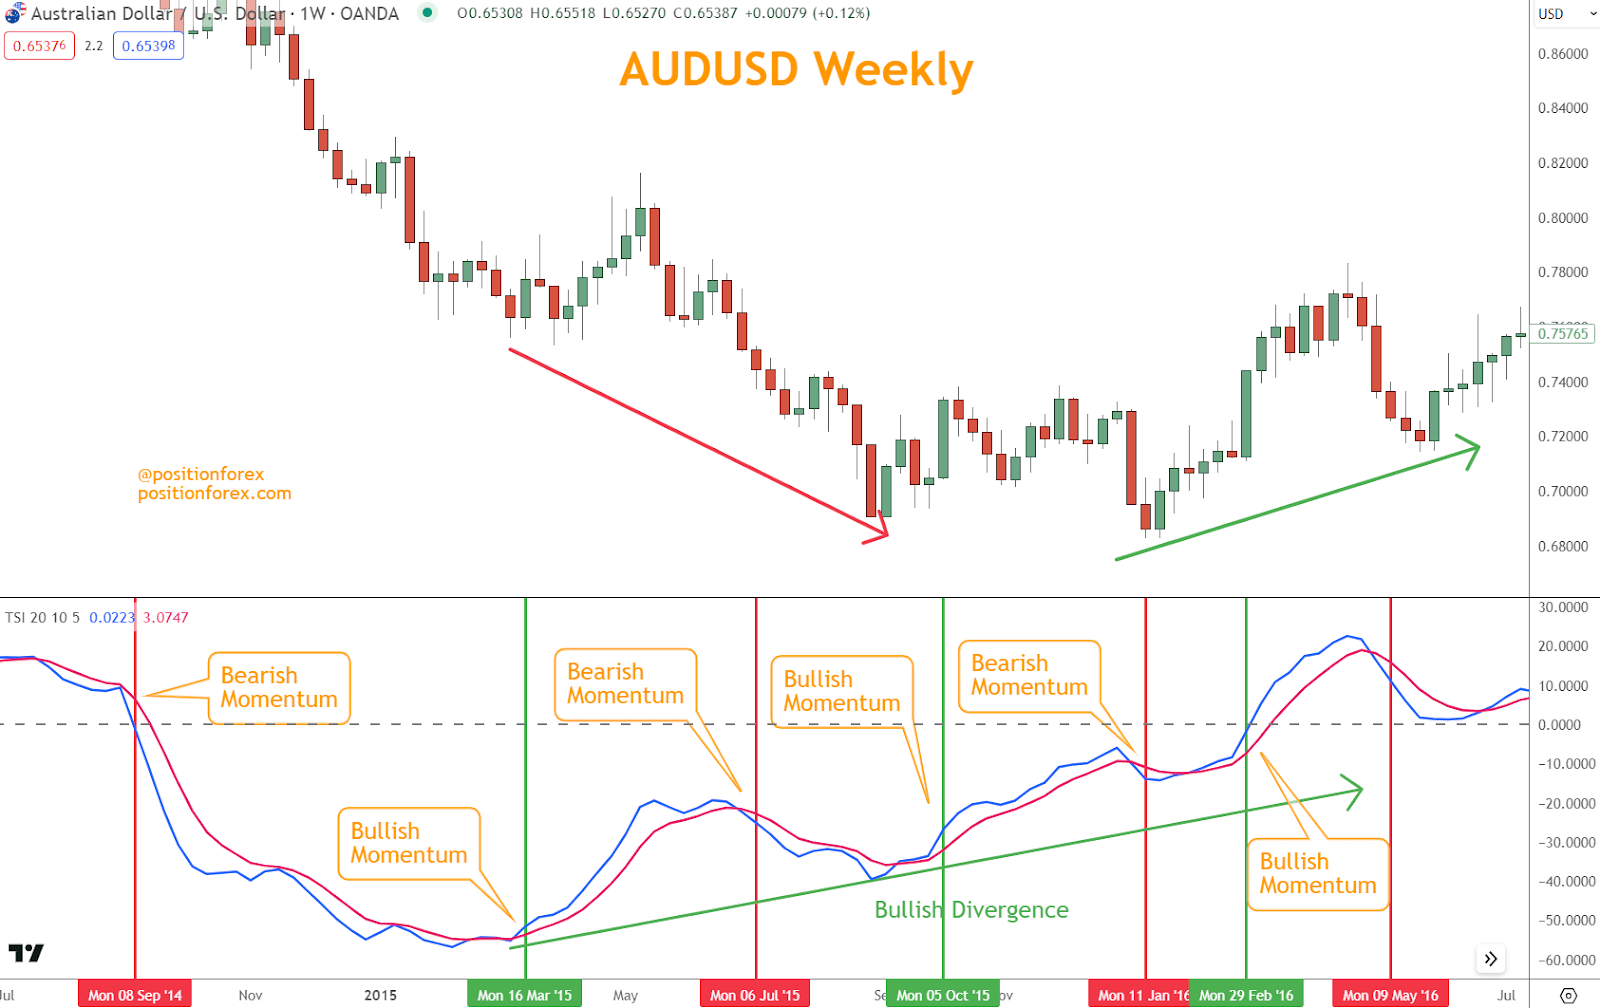
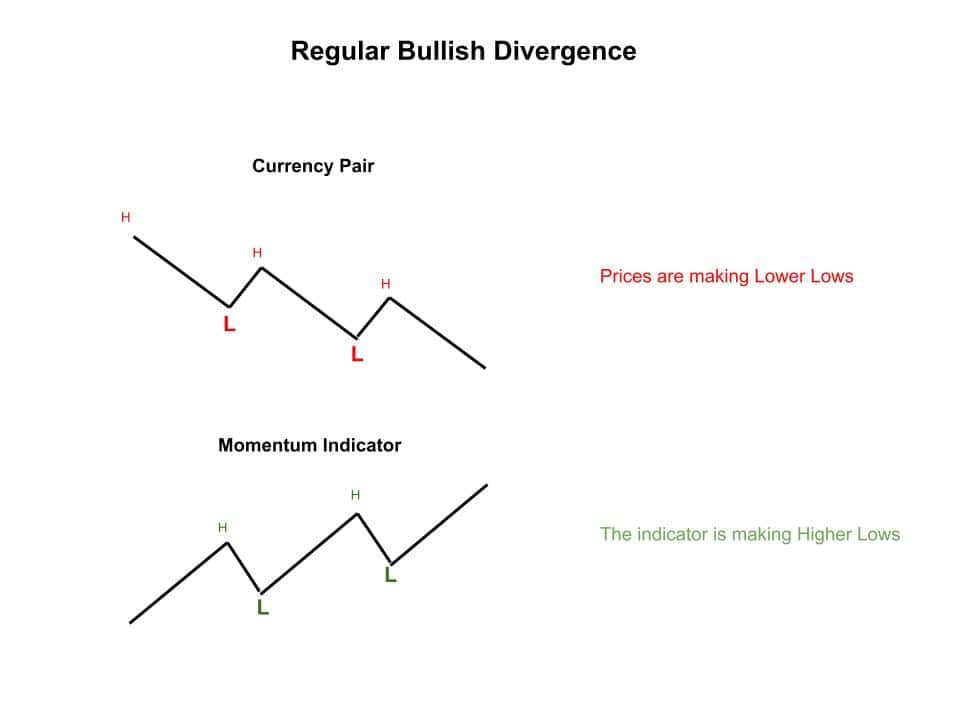
Divergence occurs when the price and momentum indicator move in opposite directions, indicating a weakening trend and potential reversal.
Bullish divergence occurs when the price makes a lower low while the indicator makes a higher low, often preceding a turn upward.
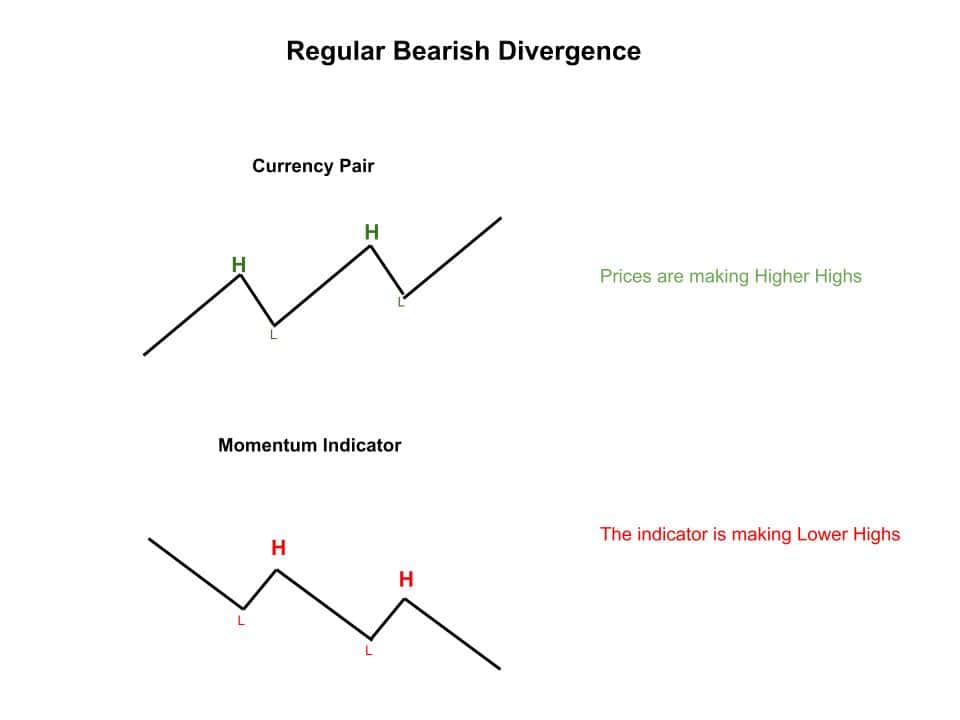
Bearish divergence forms when price makes a higher high while the indicator makes a lower high, often preceding a downturn.
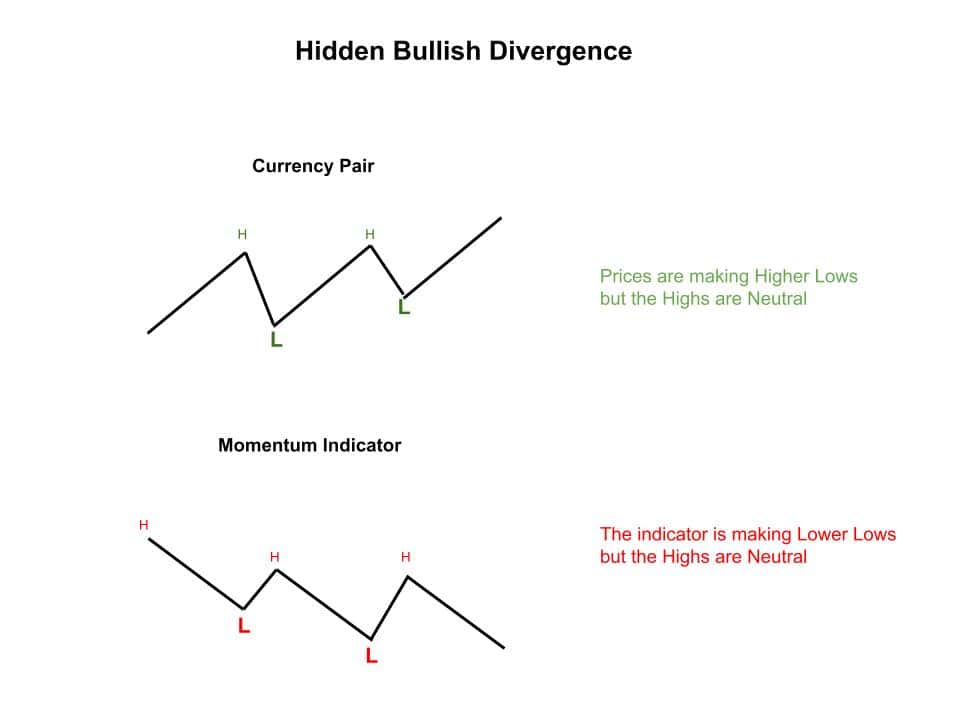
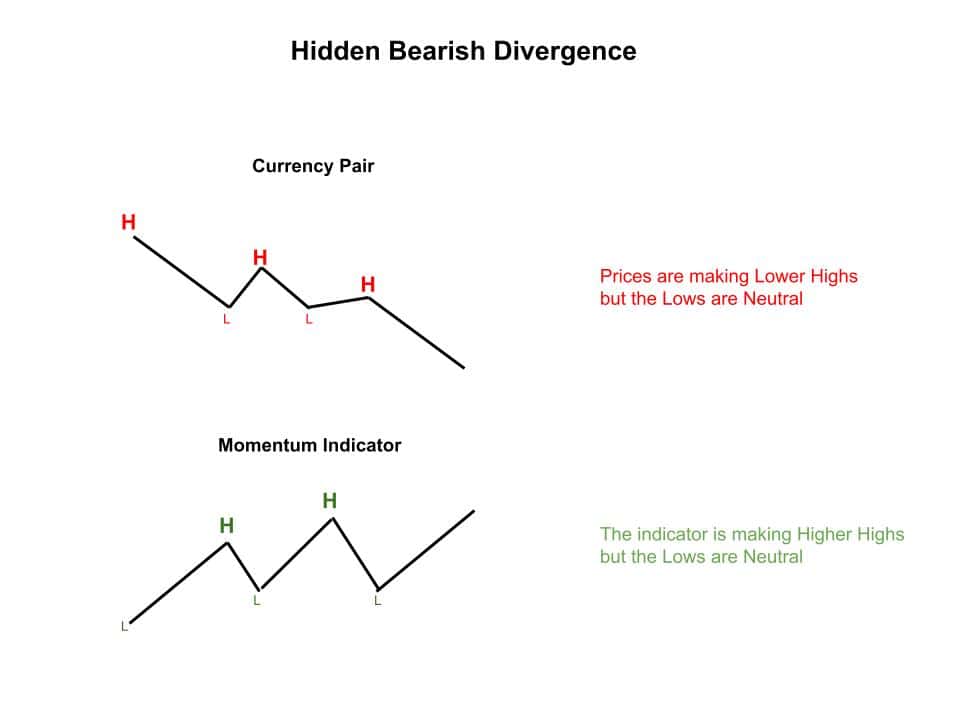
Hidden divergence typically signals continuation rather than reversal.
Hidden Bullish divergence appears when price makes a higher low while the indicator makes a lower low, supporting an ongoing uptrend.
Hidden Bearish divergence appears when price makes a lower high while the indicator makes a higher high, supporting a continuing downtrend.
Accurately identifying these patterns sharpens your ability to anticipate turns or trend resumptions.
Confirming Trade Signals
Momentum indicators complement other technical tools by validating entries. If a moving-average strategy produces a bullish signal, confirming with an RSI or TSI reading aligned with that direction adds weight to the setup.
If momentum fails to confirm, consider waiting, reducing size, or seeking further evidence before committing.
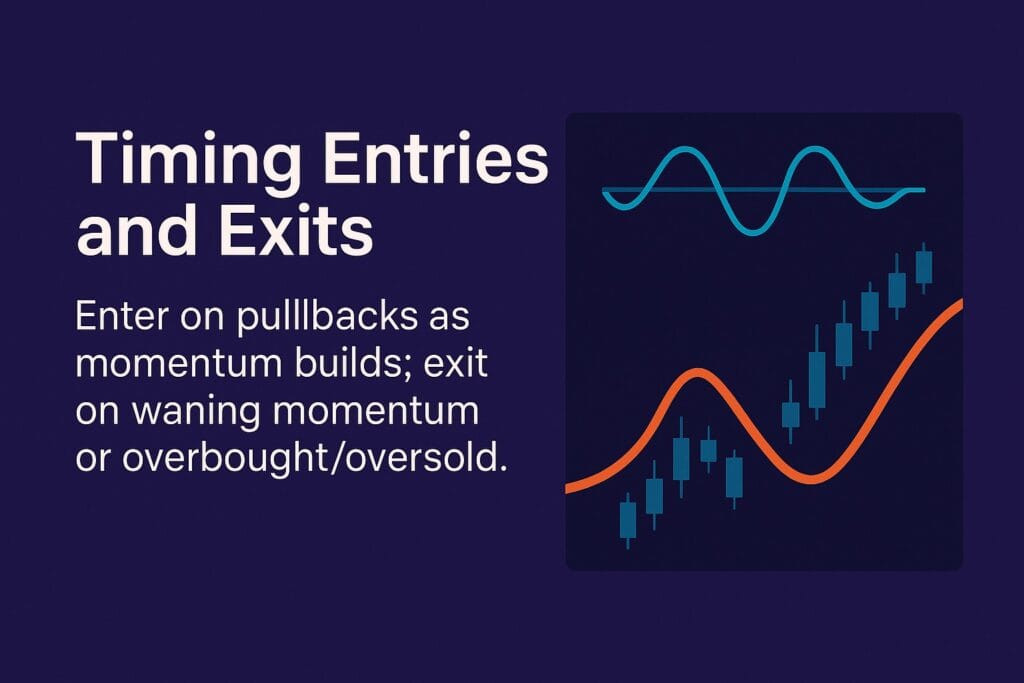
Timing Entries and Exits
Momentum helps you fine-tune execution. In trends, look to enter on pullbacks when momentum begins rebuilding—or as momentum expands into a breakout.
For exits, watch for waning momentum, divergences, or overbought/oversold readings that suggest a pause, consolidation, or reversal may be near.
Managing Risk
Effective risk management is crucial, and momentum can inform stop placement and position sizing.
As momentum strengthens in your favor, you can trail stops more confidently; when momentum fades, you can tighten stops or reduce exposure. Integrating momentum into risk decisions helps protect gains while keeping losses controlled.
Tips for Effective Use of Momentum Indicators
Momentum indicators provide their most significant value when used within a structured analysis process.
Combining tools, aligning timeframes, and layering macro context can significantly improve the reliability of signals.
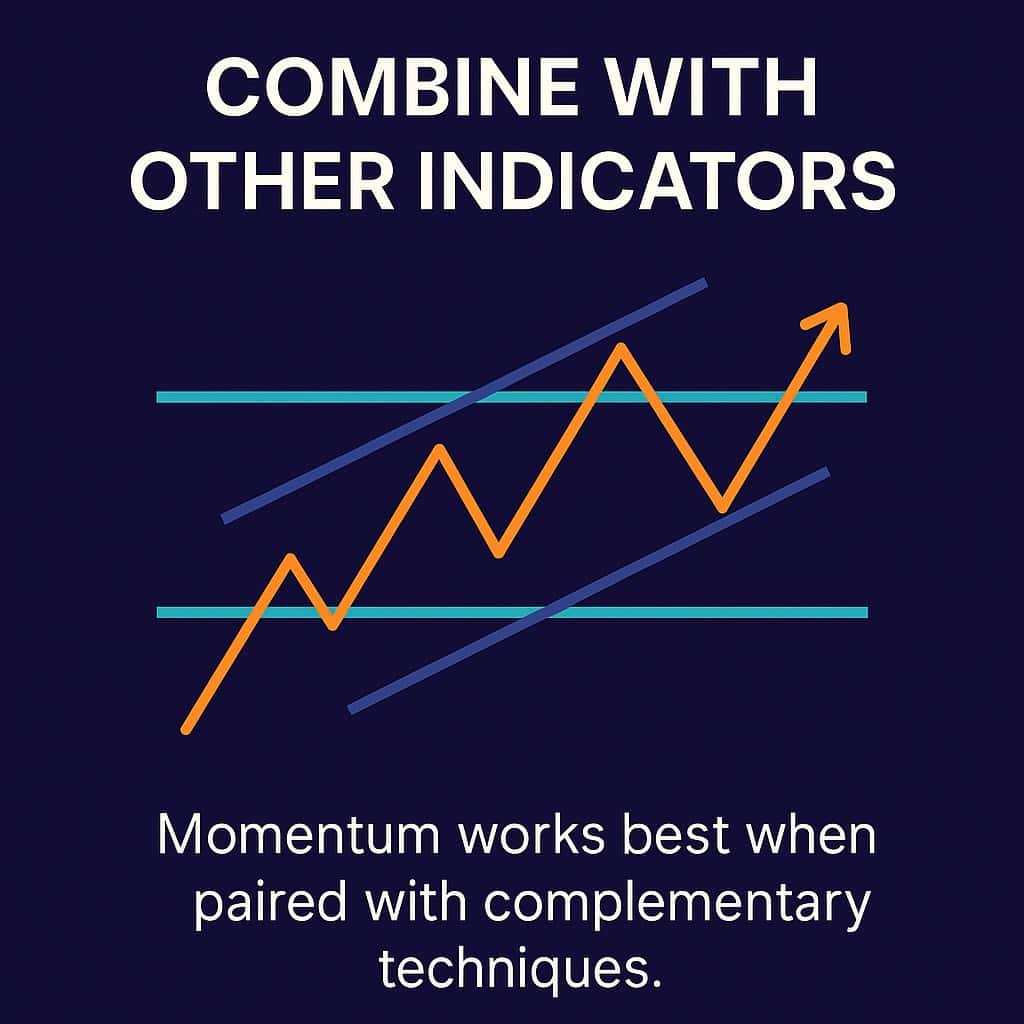
Combine with Other Indicators
Momentum works best when paired with complementary techniques.
Use channel lines to confirm direction and potential reversal points, and overlay horizontal support and resistance to validate momentum signals at consequential price levels. This confluence strengthens entries, targets, and stop placement.
Use in Confluence with Fundamental Analysis
Momentum reflects price behavior and market psychology, while fundamentals explain the “why” behind those moves.
Economic data, central-bank policy, and geopolitical events can shift momentum abruptly. If momentum aligns with supportive fundamentals—such as positive data backing a bullish signal—you gain added confidence in the trade thesis.
Conclusion
Momentum indicators are invaluable tools for gauging the strength and direction of price movements.
By understanding how they work and integrating them into a disciplined process, you can better identify trends, anticipate reversals, and execute entries and exits with greater precision.
Pair momentum with robust risk management and complementary analysis to leverage its full power in your trading journey.
What’s the Next Step?
Consider your trading experience and the strategies you use today. Look for immediate opportunities to incorporate momentum into your process and build habits that reinforce disciplined execution.
If you need help developing an analysis process, you can use our Six Basics of Chart Analysis—available free.
The “Six Basics” provide a strong foundation you can integrate with the momentum practices in this article.
When you get the “Six Basics,” you’ll also receive Forex Forecast delivered to your inbox every Sunday.
Forex Forecast includes:
- Trade Ideas and Analysis: The opportunities I’m watching using the Six Basics and advanced strategies.
- Case Studies from Around the Web: How the Six Basics worked in some of the best, most profitable trades.
- Trading Education Guides and Videos: Learn the Six Basics techniques and advanced strategies.
- Links to New Articles: Weekly posts on topics traders want to know about.
- Positionforex.com News: Updates and announcements.
- Links to Upcoming Webinars: Attend free sessions to improve your trading.
- And Much More: Tools, membership-only videos, and more—completely free.

Frequently Asked Questions
What is the significance of these indicators in Forex trading?
Momentum indicators play a crucial role by providing insights into the strength and direction of price movements.
They help traders identify trends, spot potential reversals, and make informed trading decisions.
How does momentum work in trading?
Momentum indicators compare current prices to historical prices over a specified period.
They generate signals based on the speed and magnitude of price movements, oscillating around a centerline or zero line to indicate overbought and oversold conditions.
What are some common types of momentum indicators used in Forex trading?
Common types include the Relative Strength Index (RSI), Stochastic Oscillator, Momentum Indicator, and True Strength Index (TSI).
Each offers a unique lens on market dynamics and trend analysis.
How can traders effectively utilize momentum in their trading strategy?
Combine momentum with other technical tools such as trendlines, support and resistance, and volume.
Consider multiple timeframes and incorporate fundamental analysis to improve signal quality and overall outcomes.
What are some tips for successfully applying momentum in Forex trading?
Practice patience and discipline; review and adapt strategies as market conditions evolve; use momentum in confluence with fundamental analysis.
Additionally, consider the reliability of signals, avoid overtrading, and prioritize risk management to maximize profitability and minimize risk.
Forex Trading Disclosure Statement
Risk Warning:
Forex trading involves significant risk and may not be suitable for all investors. The leveraged nature of Forex trading can work both for and against you, leading to substantial gains or losses. Before trading Forex, you should carefully consider your financial objectives, experience level, and risk tolerance. It is possible to lose more than your initial investment, and you should only trade with money you can afford to lose.
Market Risks and Volatility:
Forex markets are influenced by global economic, political, and social events, which can result in unpredictable price movements. High market volatility can lead to sudden and substantial changes in currency values, potentially causing losses that exceed your initial deposit.
Leverage Risks:
Leverage amplifies both potential gains and potential losses. While leverage can increase profitability, it also increases the risk of significant losses, including the loss of your entire trading capital.
Trading Tools and Technology Risks:
Forex trading platforms, including those offered by brokers, are subject to technology risks, such as system failures, latency issues, and potential errors in price feeds. Traders should be aware that these risks can impact the execution of trades and trading outcomes.
No Guarantee of Profitability:
Past performance in Forex trading is not indicative of future results. There is no guarantee that you will achieve profits or avoid losses when trading Forex. Market conditions and individual trading strategies vary, and no trading system can eliminate the inherent risks of Forex trading.
Educational Purposes Only:
Any information provided about Forex trading, including strategies, analysis, or market commentary, is for educational purposes only and should not be considered financial advice. Consult a qualified financial advisor or tax professional before making any trading decisions.
Regulatory Compliance:
Forex trading is regulated differently in various jurisdictions. Ensure that you are trading with a licensed and compliant broker in your country of residence.
Responsibility:
You are solely responsible for your trading decisions and the associated risks. It is your duty to understand the terms and conditions of Forex trading, including margin requirements, stop-losses, and other risk management tools.
Acknowledgment:
By engaging in Forex trading, you acknowledge that you have read, understood, and accepted this disclosure statement. You accept full responsibility for the outcomes of your trading decisions and agree to trade at your own risk.
This disclosure is intended to provide an overview of the risks associated with Forex trading and is not exhaustive. For additional information, consult your broker and other reliable financial resources.