
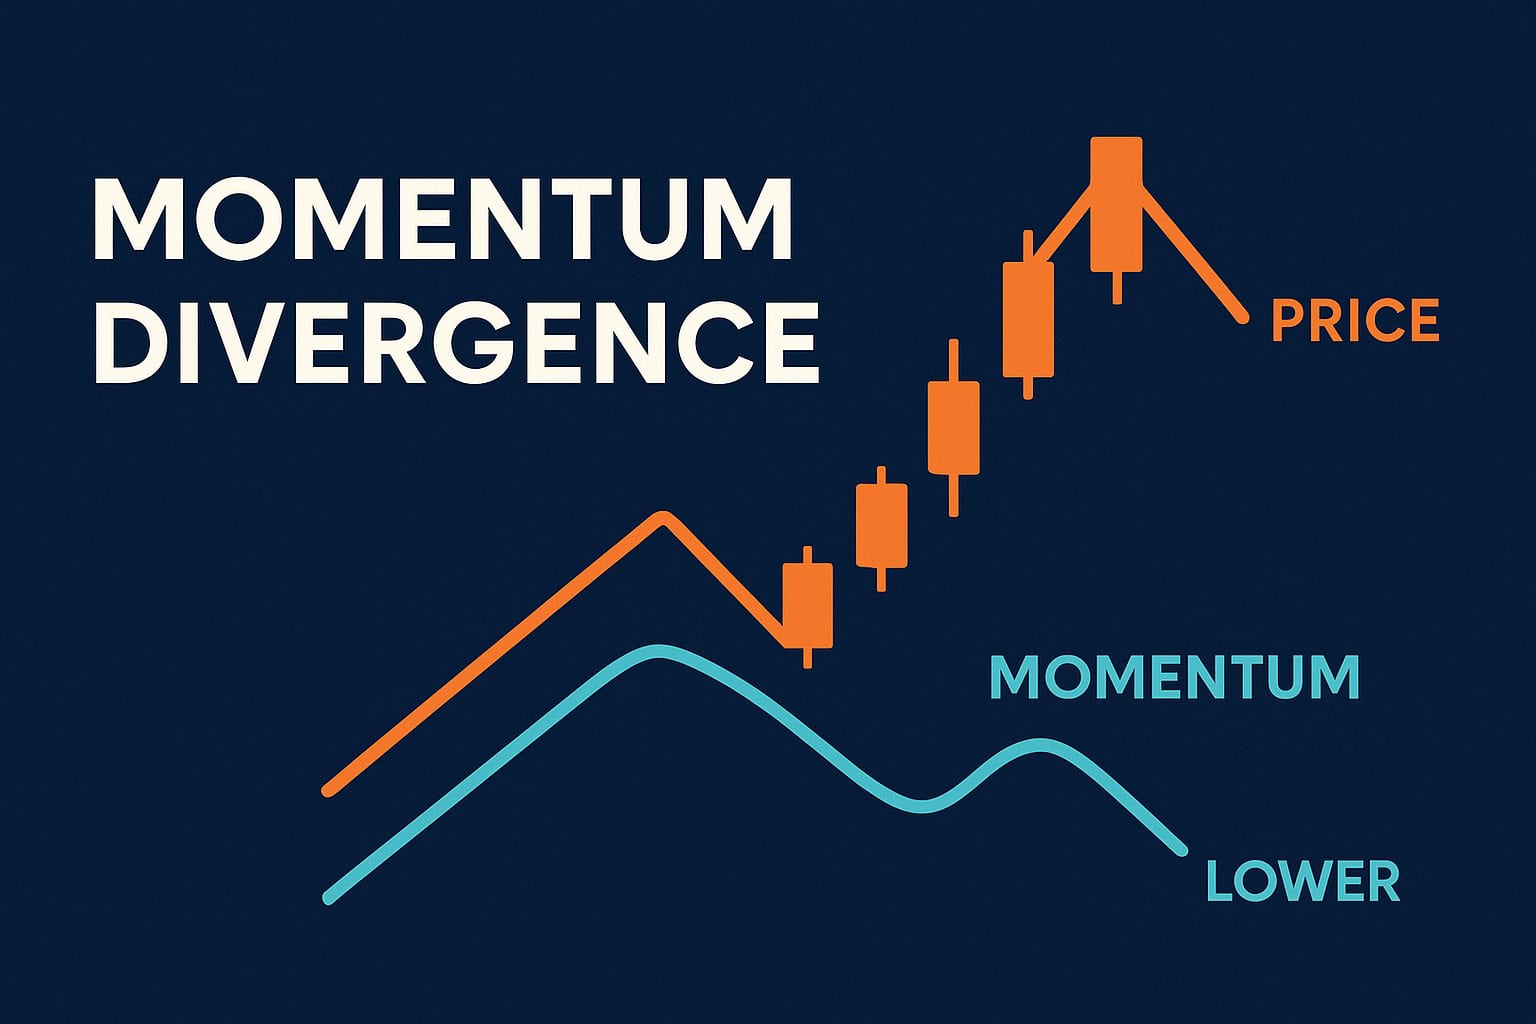
Momentum divergence is one of the most useful yet misunderstood tools in Forex technical analysis.
Traders often notice that momentum usually moves in the same direction as price—until suddenly it doesn’t. When that disconnect occurs, it can signal a potential shift in market direction.
This article explains what momentum divergence is, why it matters, and how you can use it to anticipate market reversals or continuations. The following sections break down its mechanics step by step while preserving the structure of the original explanation.
Quick Reference Table: 4 Types of Divergence
| Type of Divergence | Price Behavior | Indicator Behavior | Typical Signal |
| Regular Bullish | Lower Low | Higher Low | Potential upward reversal |
| Regular Bearish | Higher High | Lower High | Potential downward reversal |
| Hidden Bullish | Higher Low | Lower Low | Continuation of rally |
| Hidden Bearish | Lower High | Higher High | Continuation of selloff |
TL;DR
Momentum divergence occurs when prices and a Momentum indicator move in opposite directions. This mismatch can reveal weakening trends, potential reversals, or continuation signals before they become evident on the chart.
There are four main types of divergence you need to know:
- Regular Bullish Divergence: Price makes a lower low, momentum makes a higher low → possible upward reversal
- Regular Bearish Divergence: Price makes a higher high, momentum makes a lower high → possible downward reversal
- Hidden Bullish Divergence: Price makes a higher low, momentum makes a lower low → continuation of the rally
- Hidden Bearish Divergence: Price makes a lower high, momentum makes a higher high → continuation of the selloff
Always confirm divergence with other tools like Candlesticks, Chart Patterns, Support/Resistance, and fundamental events. Divergence alone should never be the sole trading signal.
Table of Contents
- Quick Reference Table: 4 Types of Divergence
- TL;DR
- What is Momentum in Forex Trading?
- Divergence: Going Beyond the Surface
- Spotting Divergences: A Step-by-Step Guide
- Momentum Divergences in Forex: 4 Types
- Implications of Regular Divergences
- Decoding Hidden Divergences
- Tools & Techniques for Confirmation
- Key Takeaways
- What’s the Next Step?
- Frequently Asked Questions (FAQs)
- Quiz: Understanding Momentum Divergence
- Forex Trading Disclosure Statement
What is Momentum in Forex Trading?
Momentum describes the speed at which a currency pair’s price changes over a specific time period. It is a direct measure of market strength or weakness and reflects the rate at which buyers or sellers are gaining control.
When momentum is strong and rising, it suggests the price is accelerating.
When momentum slows or turns negative, it indicates waning strength.
Tracking these changes helps you anticipate moves rather than react to them, making momentum one of the most influential elements of market analysis.
Divergence: Going Beyond the Surface
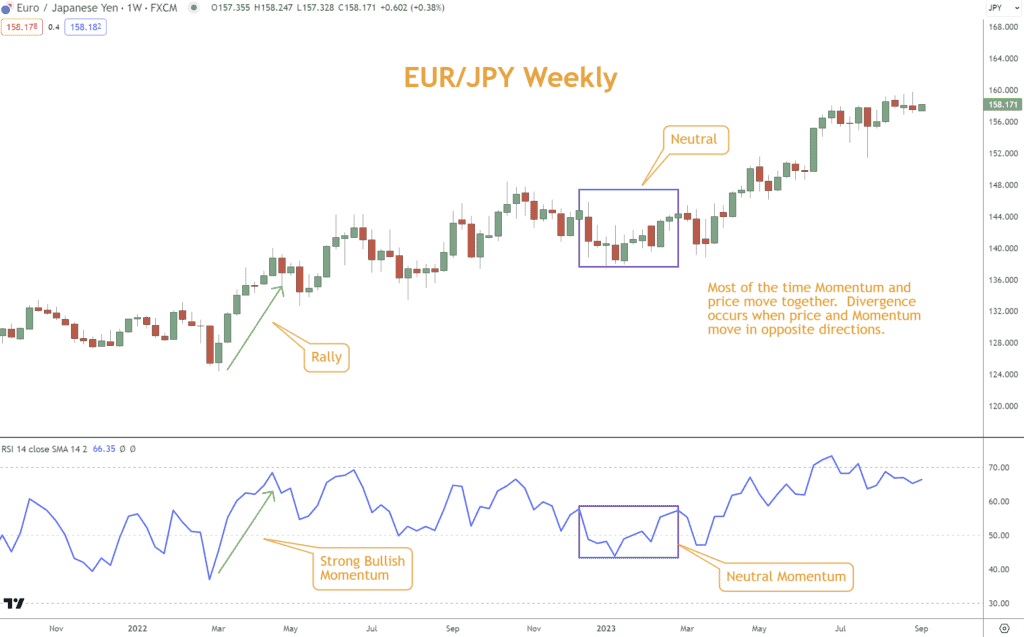
Divergence provides deeper insight by highlighting moments when price and Momentum no longer move together. This discrepancy often warns of underlying instability in the trend.
Divergence occurs when price forms new highs or lows that the momentum indicator fails to confirm. The two primary types—Bullish and Bearish divergence—help identify potential market reversals.
- Bullish Divergence: Price forms a lower low, but momentum forms a higher low.
- Bearish Divergence: Price forms a higher high, but momentum forms a lower high.
Correctly identifying these mismatches can provide critical entry or exit signals.
Spotting Divergences: A Step-by-Step Guide
Spotting divergence requires careful comparison between price movement and a Momentum indicator such as RSI, TSI, or Stochastic.
To identify true divergence:
- Verify that price makes a clear higher high or lower low relative to a previous swing.
- Check whether the momentum indicator moves in the opposite direction.
- Ensure the discrepancy is meaningful and not minor noise.
- Confirm both elements align before calling it a true divergence.
Following this process increases confidence in spotting actionable divergence setups.
Momentum Divergences in Forex: 4 Types
Momentum divergences appear in two primary categories: Regular and Hidden. Each type carries different implications for signals and trend expectations.
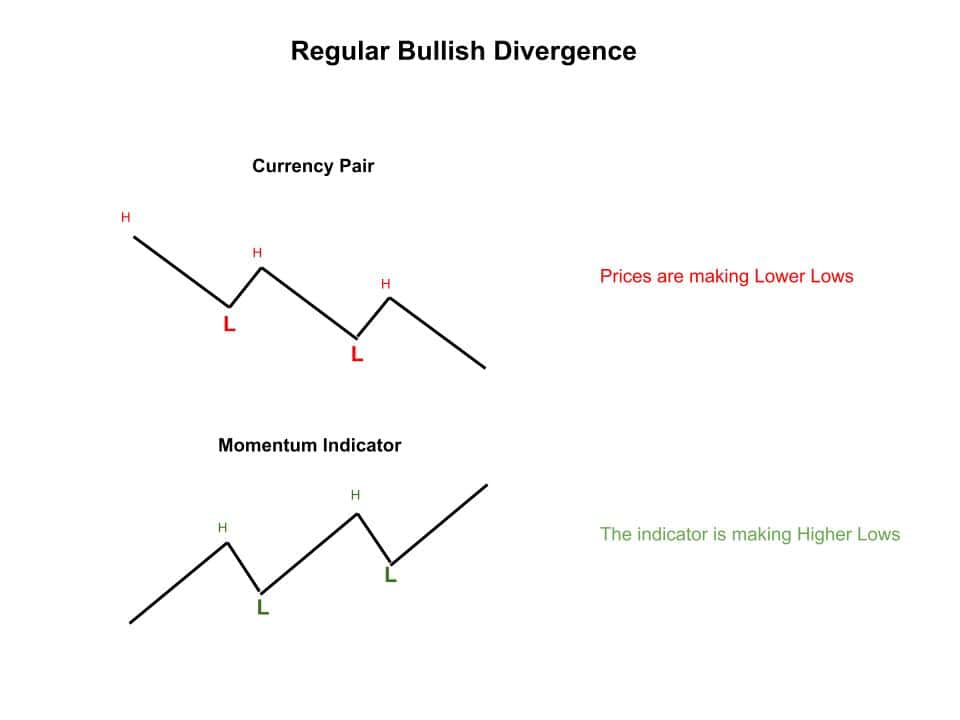
Regular Bullish Divergence
Occurs when:
- Price makes a new lower low
- Momentum forms a higher low
This often signals weakening selling pressure and a potential upward reversal.
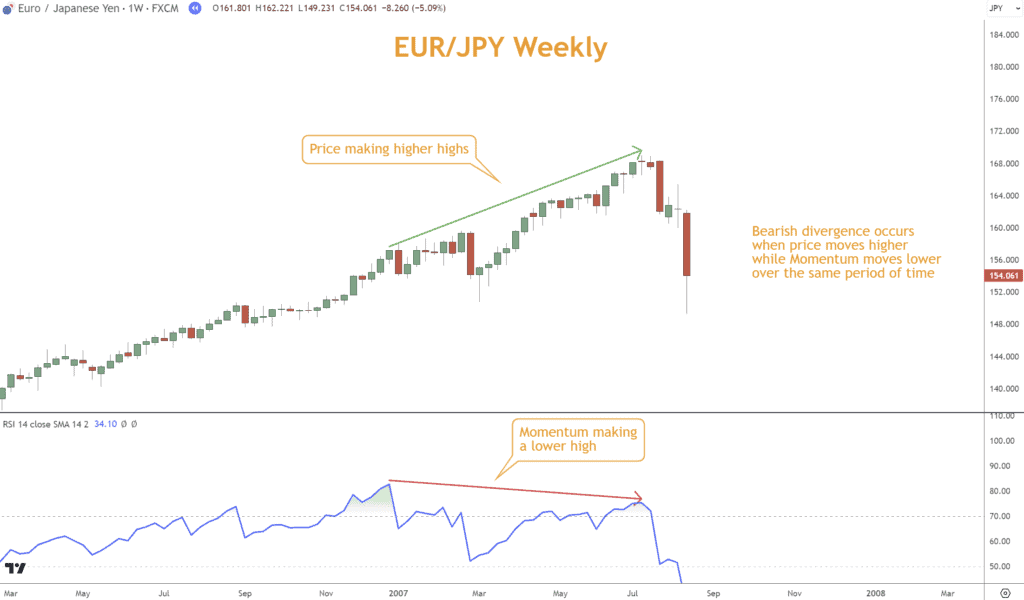
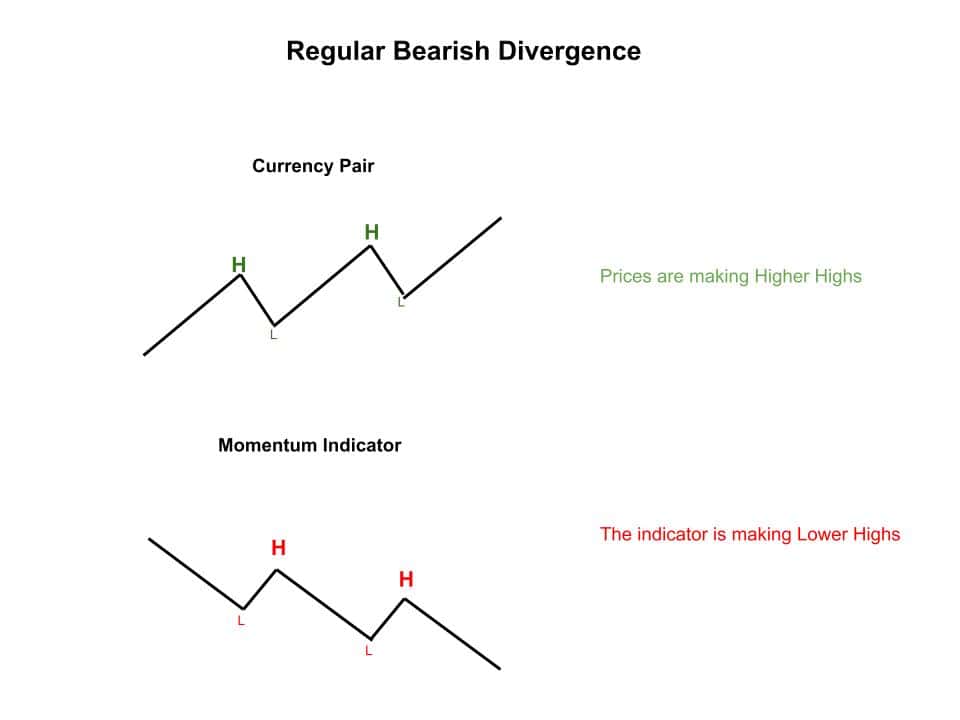
Regular Bearish Divergence
Occurs when:
- Price makes a new higher high
- Momentum forms a lower high
This suggests the Rally may be losing strength, and a reversal could be approaching.
Looking for a Strategy?
Download the Six Basics of Chart Analysis and sign up for Forex Forecast to learn a bottom-up approach to analyzing Forex markets and weekly market updates.
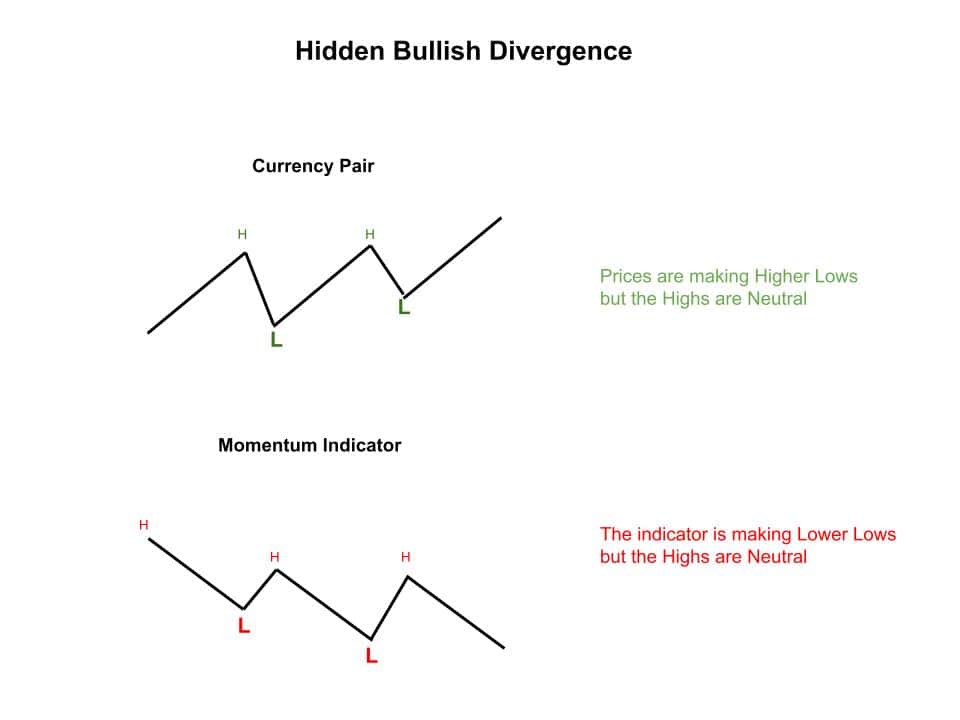
Hidden Bullish Divergence
Occurs when:
- Price makes a higher low
- Momentum forms a lower low
Instead of signaling a reversal, it suggests a continuation of the Rally.
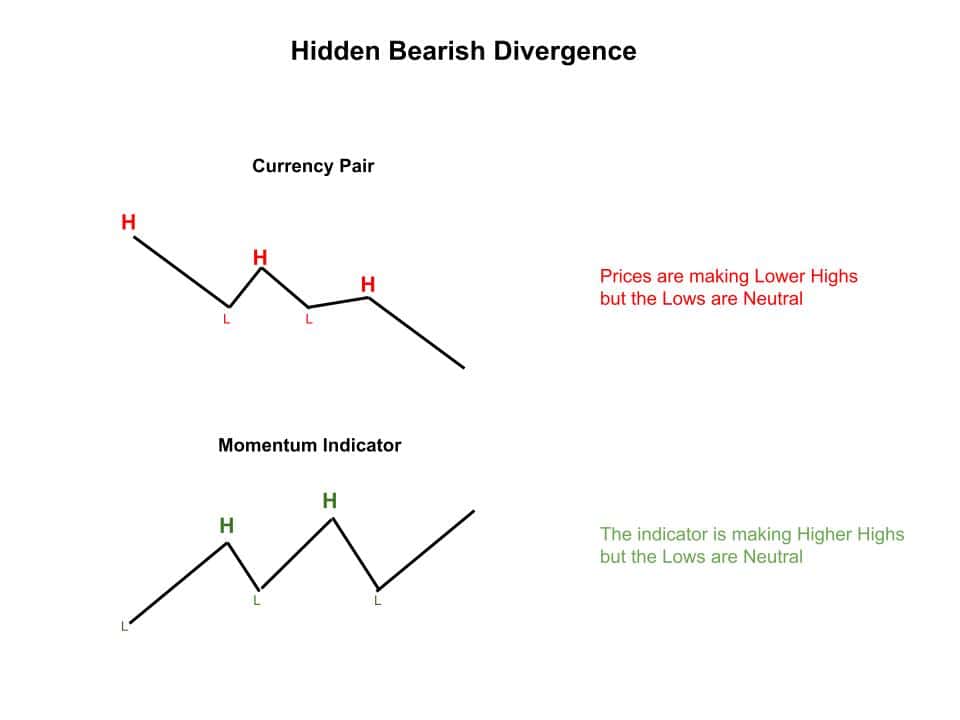
Hidden Bearish Divergence
Occurs when:
- Price forms a lower high
- Momentum forms a higher high
This indicates continued selling pressure and supports the ongoing Selloff.
Understanding these forms allows you to forecast the market’s likely direction.
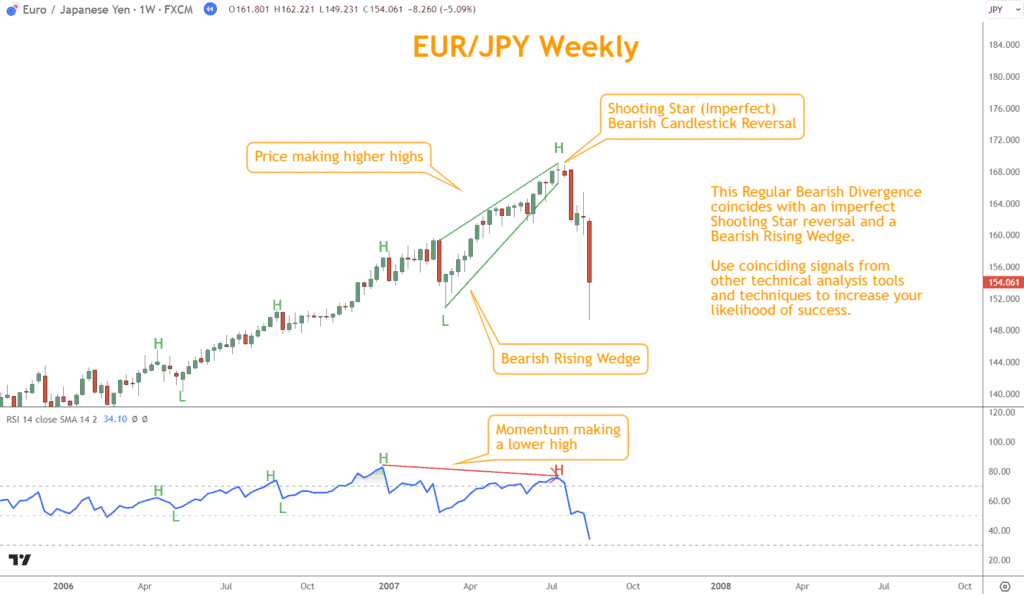
Implications of Regular Divergences
Regular divergence is typically associated with market reversals. When correctly identified, it provides clear signals for directional shifts.
Regular Bullish Divergence
- Occurs when bears push price to a lower low but momentum refuses to confirm.
- Suggests selling pressure is fading.
- It can serve as a potential buy signal if further technical confirmation aligns.
Regular Bearish Divergence
- Occurs when bulls push price to a higher high, but momentum weakens.
- Suggests the rally may be losing steam.
- Often interpreted as an early warning for a selloff.
Correctly interpreting these signals enhances your ability to anticipate turning points.
Decoding Hidden Divergences
Hidden divergences are typically continuation signals, indicating that the prevailing trend is likely to persist.
Hidden Bullish Divergence
- Price forms a higher low while momentum forms a lower low.
- Signals underlying strength in the uptrend.
- Suggests the rally has the potential to continue.
Hidden Bearish Divergence
- Price forms a lower high while momentum forms a higher high.
- Signals the selloff remains intact.
- Suggests downward continuation is more likely.
Hidden divergence offers more profound insight into a trend’s durability.
Tools & Techniques for Confirmation
Spotting divergence is only one part of the process. Confirmation greatly enhances the reliability of divergence-based decisions.
Pairing with Other Technical Indicators
Divergence becomes more meaningful when it aligns with other tools, such as:
- Japanese Candlestick reversal patterns
- Chart Patterns signaling reversal or continuation
- Stochastic or RSI overbought/oversold readings
When these elements confirm each other, signals become significantly stronger.
Factoring in Economic Announcements
Because global events drive Forex, technical signals can be overridden by:
- Economic releases
- Central bank policy decisions
- Geopolitical developments
A Bullish technical signal may weaken if major negative news is expected. Conversely, positive data may reinforce a bullish divergence.
Integrating technical and fundamental elements produces a more robust analysis.
Key Takeaways
Momentum divergence can offer valuable insights into market behavior when used correctly.
Key points include:
- Momentum measures the speed and strength of market movement.
- Divergence reflects discrepancies between price and indicator behavior.
- Regular divergences suggest reversal potential.
- Hidden divergences support continuation signals.
- Confirmation is essential—never rely on divergence alone.
Mastering these dynamics can help you make more informed, confident trading decisions.
What’s the Next Step?
Select a candlestick chart and attach a momentum indicator. Look for both regular and hidden divergences to practice identification.
Then, combine your findings with other technical tools—Japanese Candlesticks, Chart Patterns, and Support and Resistance—to validate your analysis.
For a structured approach, download the Six Basics of Chart Analysis for free. You’ll also receive Forex Forecast, the weekly newsletter that includes:
- Trade ideas using the Six Basics
- Case studies
- Educational guides and videos
- New article announcements
- Webinars
- Tools and exclusive content

All are delivered every Sunday at no cost.
Frequently Asked Questions (FAQs)
What’s the Best Time Frame to Spot Divergences?
Longer time frames generally produce more reliable divergence signals, though the ideal time frame depends on your trading strategy.
How Do I Differentiate Between a False Divergence and a True One?
Use confirmation tools such as candlestick patterns, chart patterns, or indicator confluence. Waiting for price confirmation—such as a break of Support or Resistance—also helps.
Can This Be Combined With Fundamental Analysis?
Yes. Divergence provides technical insight, while fundamentals explain the underlying “why.” Combining both forms a deeper understanding.
How Do I Integrate Divergence Into My Existing Strategy?
Practice spotting divergence on historical charts, define clear entry/exit rules, and consistently pair divergence with other confirming tools.
Quiz: Understanding Momentum Divergence
- What does Momentum measure in Forex trading?
a. The number of trades executed per minute
b. The speed of price movement
c. The number of open positions
d. The average trader sentiment - Regular Bullish Divergence occurs when:
a. Price makes a higher low and momentum forms a lower low
b. Price makes a lower low and momentum forms a higher low
c. Price makes a higher high and momentum forms a lower high
d. Price makes a lower high and momentum forms a higher high - Hidden Bearish Divergence typically signals:
a. A reversal to the upside
b. A reversal to the downside
c. A continuation of the selloff
d. A weakening of the uptrend - Which of the following helps confirm divergence?
a. Time-based moving averages alone
b. Japanese Candlesticks, Chart Patterns, and Momentum tools
c. Volume from stock exchanges
d. Currency conversion rates - Why can economic announcements affect divergence signals?
a. Because they slow down indicator calculations
b. Because they introduce psychological round numbers
c. Because fundamentals can override technical signals
d. Because they change candlestick colors
Answer Key
- b
- b
- c
- b
- c
Forex Trading Disclosure Statement
Risk Warning:
Forex trading involves significant risk and may not be suitable for all investors. The leveraged nature of Forex trading can work both for and against you, leading to substantial gains or losses. Before trading Forex, you should carefully consider your financial objectives, experience level, and risk tolerance. It is possible to lose more than your initial investment, and you should only trade with money you can afford to lose.
Market Risks and Volatility:
Forex markets are influenced by global economic, political, and social events, which can result in unpredictable price movements. High market volatility can lead to sudden and substantial changes in currency values, potentially causing losses that exceed your initial deposit.
Leverage Risks:
Leverage amplifies both potential gains and potential losses. While leverage can increase profitability, it also increases the risk of significant losses, including the loss of your entire trading capital.
Trading Tools and Technology Risks:
Forex trading platforms, including those offered by brokers, are subject to technology risks such as system failures, latency issues, and potential errors in price feeds. Traders should be aware that these risks can impact the execution of trades and trading outcomes.
No Guarantee of Profitability:
Past performance in Forex trading is not indicative of future results. There is no guarantee that you will achieve profits or avoid losses when trading Forex. Market conditions and individual trading strategies vary, and no trading system can eliminate the inherent risks of Forex trading.
Educational Purposes Only:
Any information provided about Forex trading, including strategies, analysis, or market commentary, is for educational purposes only and should not be considered financial advice. Consult a qualified financial advisor or tax professional before making any trading decisions.
Regulatory Compliance:
Forex trading is regulated differently in various jurisdictions. Ensure that you are trading with a licensed and compliant broker in your country of residence.
Responsibility:
You are solely responsible for your trading decisions and the associated risks. It is your duty to understand the terms and conditions of Forex trading, including margin requirements, stop-losses, and other risk management tools.
Acknowledgment:
By engaging in Forex trading, you acknowledge that you have read, understood, and accepted this disclosure statement. You accept full responsibility for the outcomes of your trading decisions and agree to trade at your own risk.