
The True Strength Index (TSI) is the most effective momentum indicator for Forex trading and a core component of the Six Basics of Chart Analysis.
Unlike many oscillators that generate noise, late signals, or conflicting interpretations, the TSI provides clean, timely, and actionable momentum insights.
In this guide, you’ll learn why the TSI stands out, how its signal-line crossovers work, how it identifies overbought and oversold conditions, and how to combine it with other technical tools for more powerful confirmation.
What Is the True Strength Index?
The True Strength Index (TSI) is a Momentum indicator designed to measure the strength behind price movement.
It helps you identify:
- Bullish Momentum
- Bearish Momentum
- Overbought or Oversold conditions
- Neutral periods before breakouts or reversals
The TSI’s double-smoothing formula filters out noise and provides more reliable reversal signals than many commonly used momentum tools.
Table of Contents
- What Is the True Strength Index?
- Why the TSI Is Different from Other Momentum Indicators
- How I Use Signal Line Crossovers for Trading
- A Better Way to Identify Overbought and Oversold Conditions
- How to Use the TSI for Trading Decisions
- Why the TSI Works Best With Other Indicators
- What’s the Next Step?
- Frequently Asked Questions
- Conclusion
- TSI Knowledge Check: 5-Question Quiz
- 1. What does a TSI–signal line distance of less than 2 indicate?
- 2. When is a Bullish TSI entry signal generated?
- 3. Why are the default TSI settings not recommended for Momentum trading?
- 4. What is considered an exit signal using the TSI?
- 5. Which tool provides the strongest confirmation for TSI signals?
- Answer Key
Why the TSI Is Different from Other Momentum Indicators
Most traders rely on tools like RSI, Stochastic, or ADX—each combining trend, momentum, and overbought/oversold indicators.
The TSI focuses solely on momentum, giving you a cleaner, more direct reading.
What Makes the TSI Unique
1. Double Smoothing for Cleaner Signals
Removing noise helps reduce false signals, especially during consolidation.
2. Built-In Signal Line for Trading Signals
This allows you to use:
- Bullish crossovers
- Bearish crossovers
- Early warnings before reversals
- Acceleration/deceleration clues
3. Adaptive Overbought/Oversold Levels
Instead of arbitrary thresholds like RSI’s 70/30, the TSI interprets overbought/oversold by the distance between the TSI and its signal line.
4. Momentum-Only Interpretation
Ignore the TSI’s centerline.
It adds no value here—the TSI’s power lies in the crossover relationship, not trend direction.
Context comes from other indicators, such as:
- Trend indicators (LSMA)
- Japanese Candlesticks
- Chart Patterns
- Support and Resistance
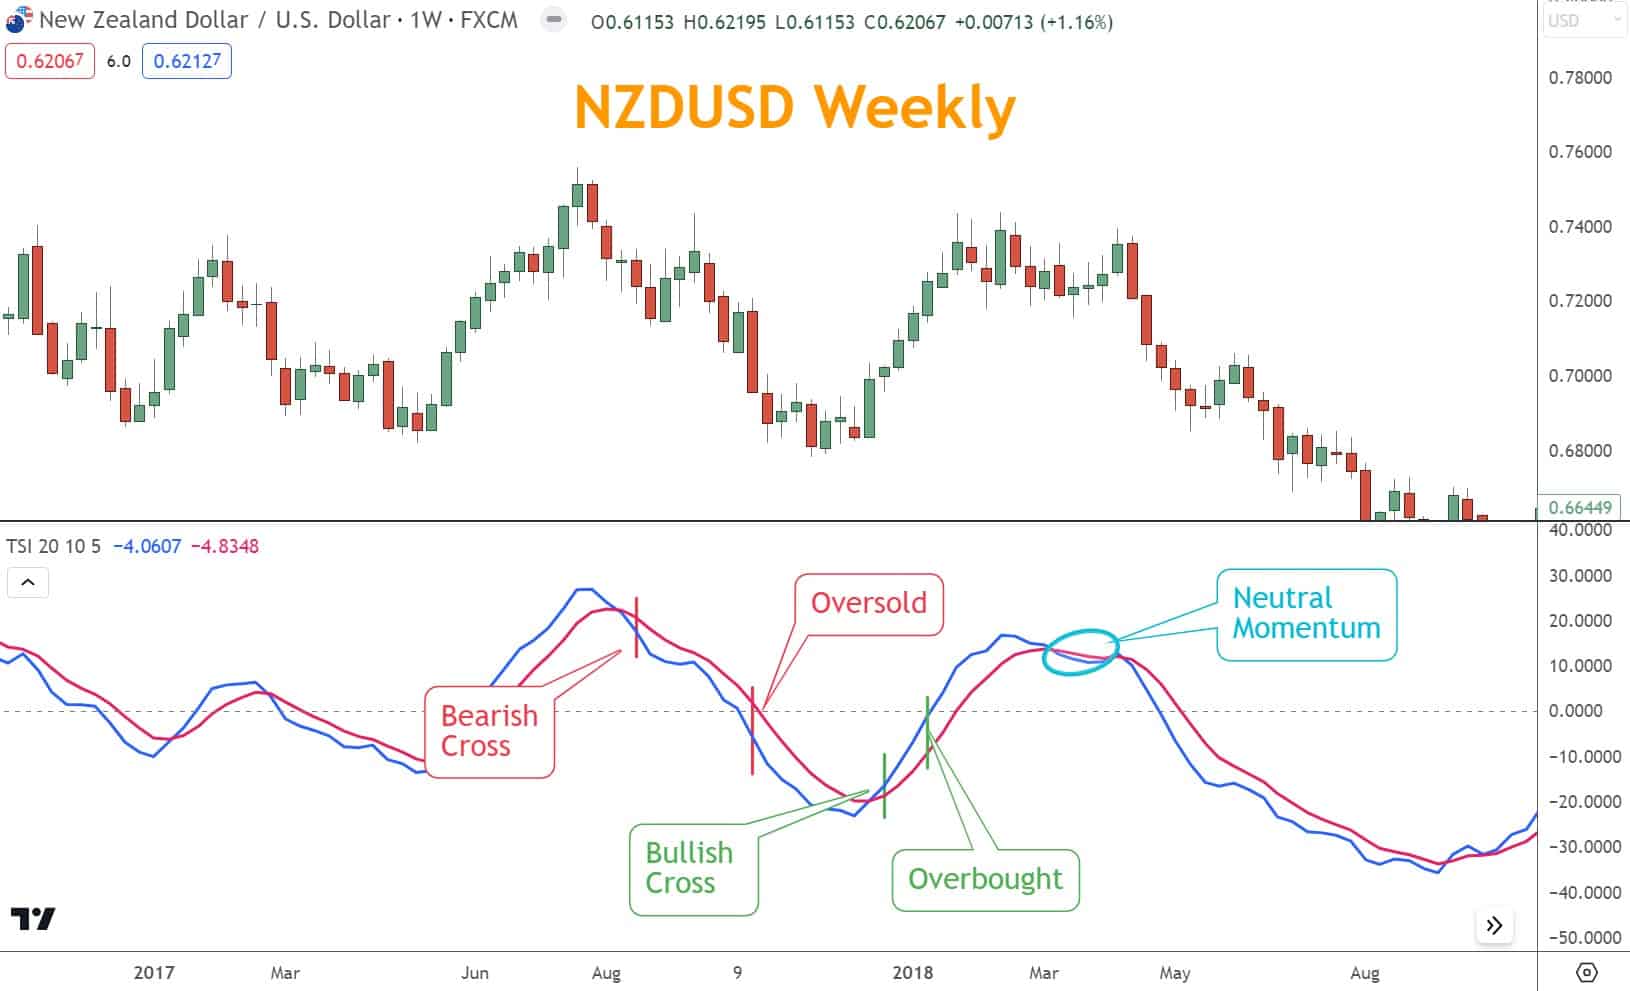
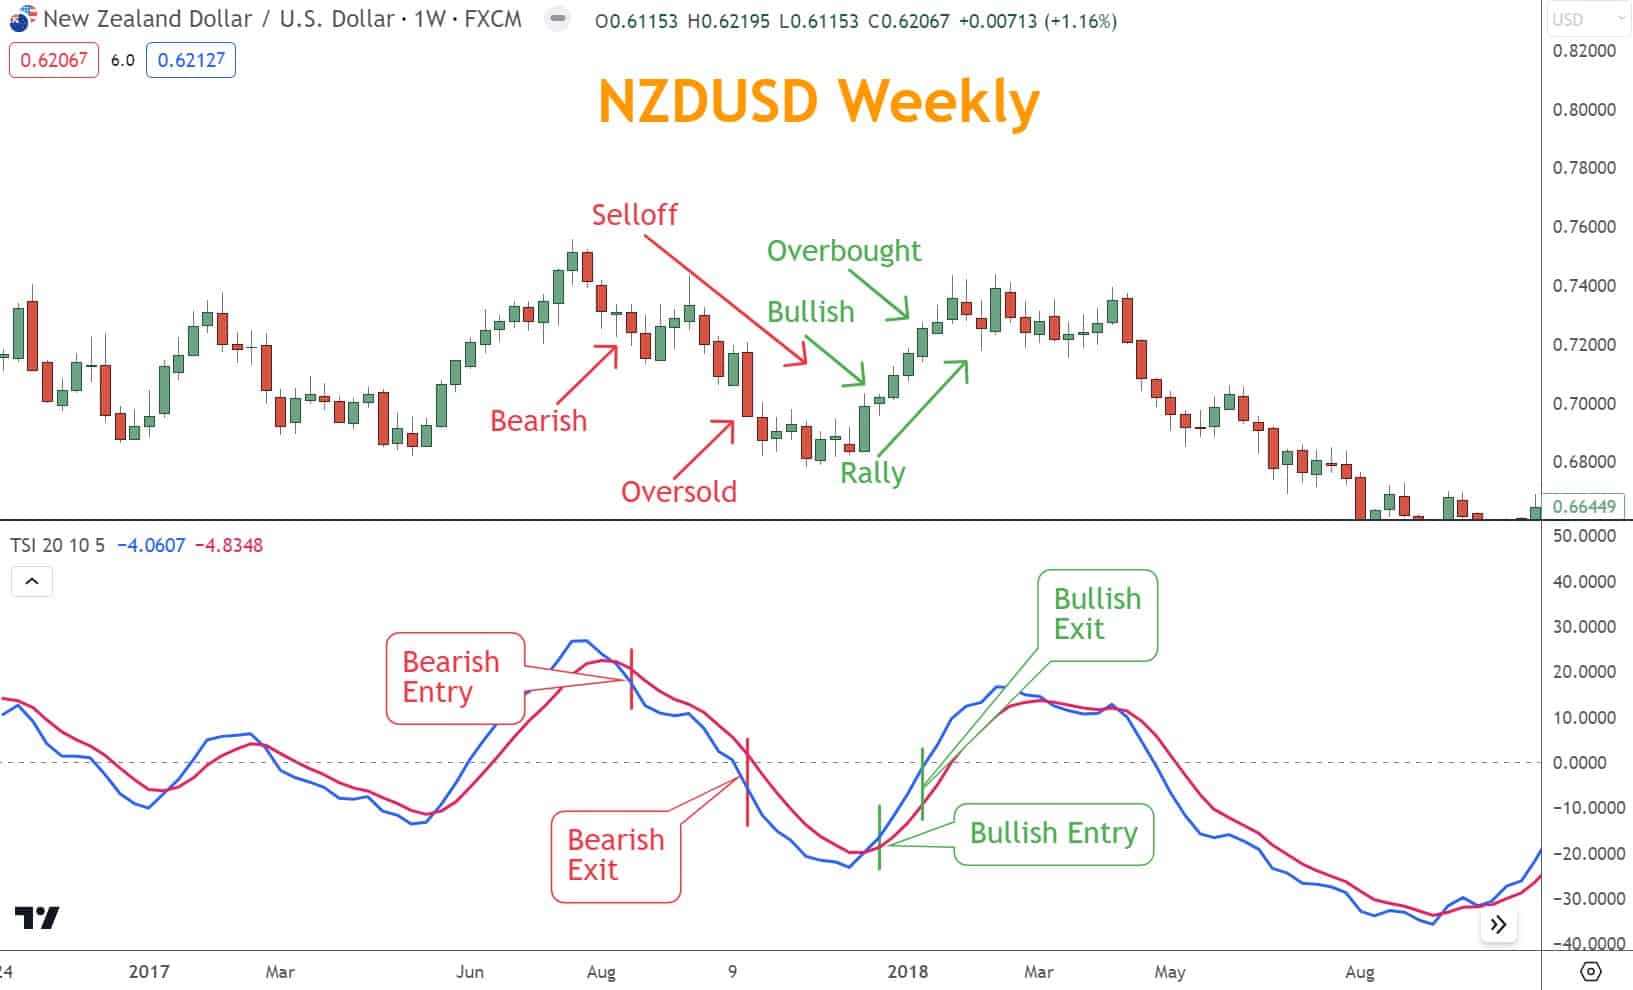
The NZD/USD chart illustrates bearish, bullish, and neutral momentum states described by the TSI.
How I Use Signal Line Crossovers for Trading
Signal-line crossovers are the core of how I trade using the TSI.
Momentum Classification Based on Distance
| TSI–Signal Line Distance | Momentum Condition |
| < 2 | Neutral |
| 2–7 | Bullish or Bearish Momentum |
| > 7 | Overbought or Oversold |
Trading Interpretation
- Bullish Entry:
Signal line crosses above the TSI and distance >2 - Bearish Entry:
Signal line crosses below the TSI and distance >2 - Exit:
Distance >7 → price is stretched and likely to reverse - Wait (No Trade):
Distance <2 → Momentum Neutral → high likelihood of noise
Examples of the different kinds of crosses can be seen in the NZD/USD example below.
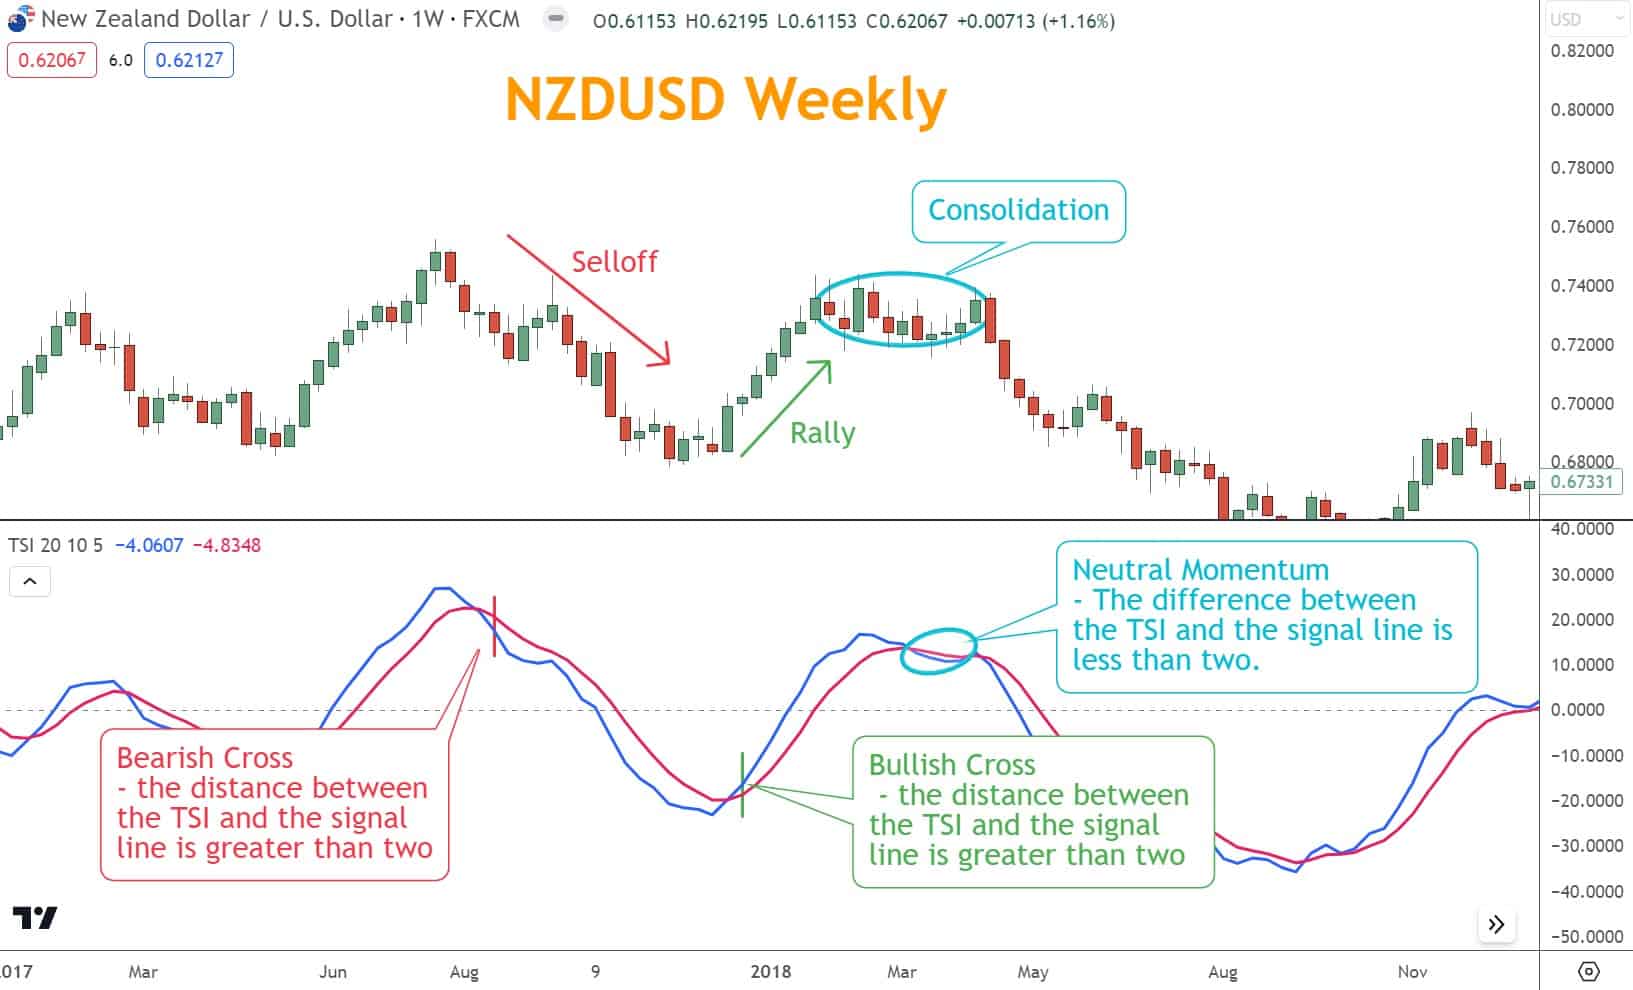
The best trades often appear as Momentum shifts out of Neutral (distance >2) but before overbought/oversold conditions (>7).
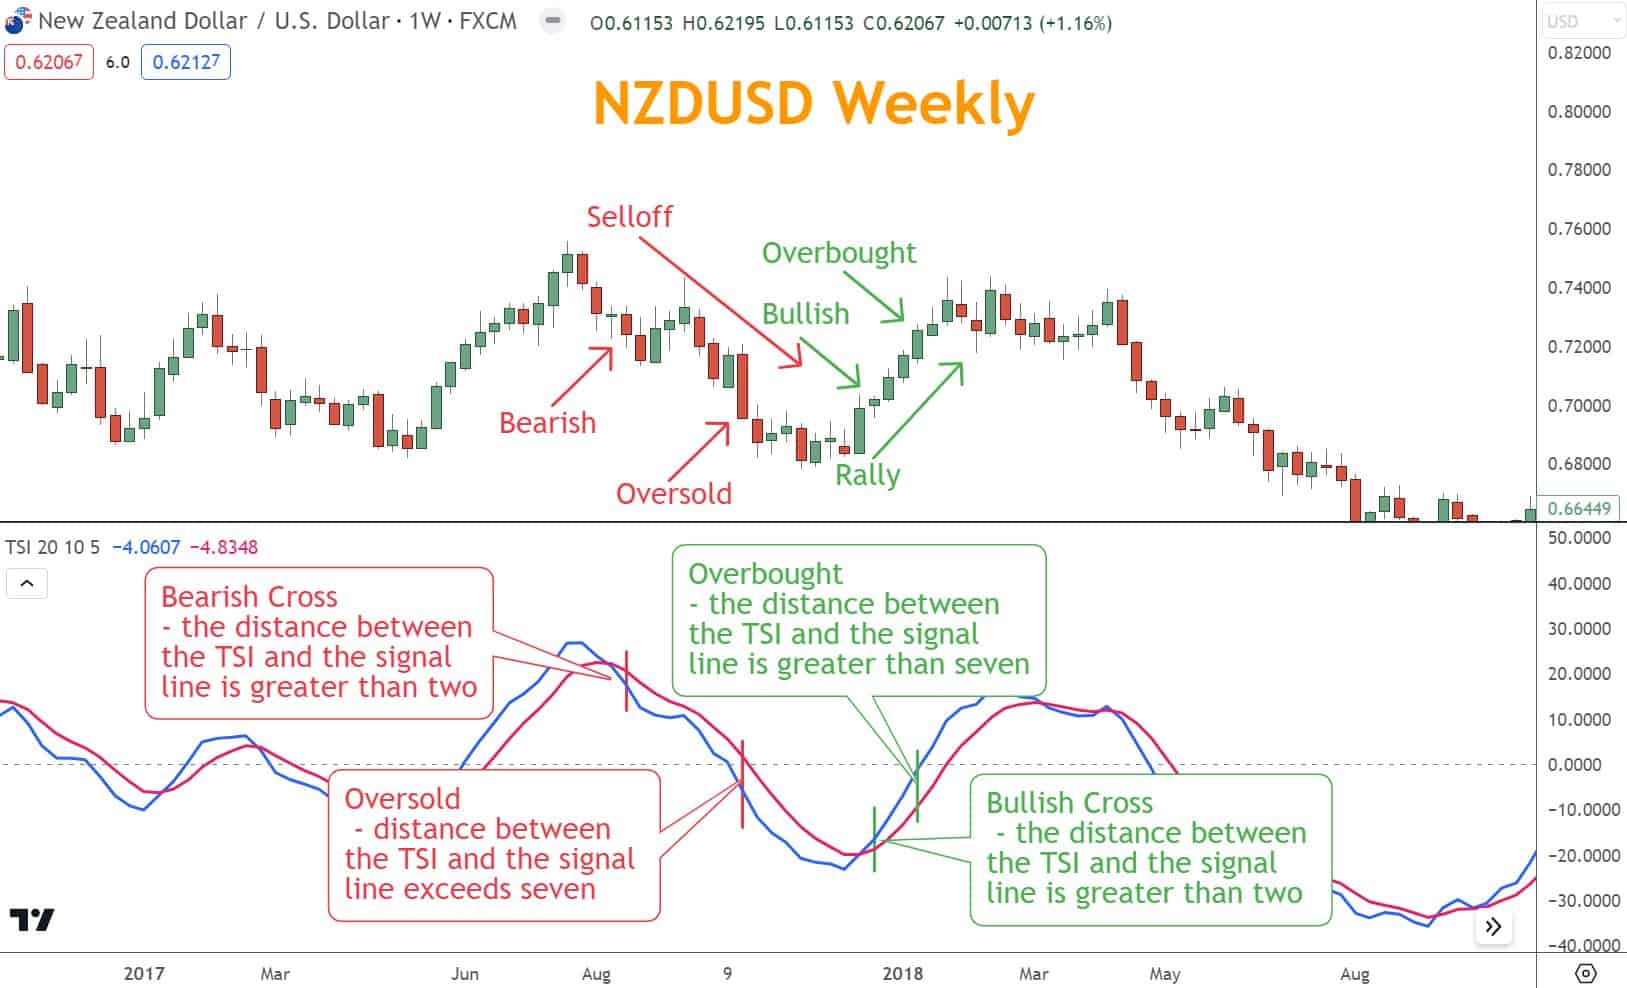
If the difference between the TSI and signal line exceeds seven, momentum is considered either overbought or oversold, depending on the nature of the crossover.
You can establish straightforward entry and exit points for your trades by incorporating signal line crossovers into your trading strategy.
Ideally, you want to enter when the crossover difference exceeds two but before it exceeds 7. Entries can appear resulting from a reversal or a pullback.
Examine the NZD/USD chart below as an example of changes in momentum and price.
Looking for a Strategy?
Download the Six Basics of Chart Analysis and sign up for Forex Forecast to learn a bottom-up approach to analyzing Forex markets and weekly market updates.
A Better Way to Identify Overbought and Oversold Conditions
The TSI excels at identifying momentum states because it adapts to current market conditions.
Its double smoothing reveals stretched conditions more accurately than rigid lines on RSI or Stochastic.
Why I Don’t Use the Default Settings
The default parameters (25, 15, 13) behave more like a trend indicator, whereas momentum-based trading requires greater sensitivity.
My recommended settings:
- Long MA: 20
- Short MA: 10
- Signal: 5
These settings:
- Capture momentum shifts earlier
- Improve entry and exit timing
- Avoid turning the TSI into a trend indicator
- Reduce lag during reversals
Pair a sensitive momentum indicator (TSI) with less sensitive tools (Trend, Patterns, S/R) for a complete picture.
How to Use the TSI for Trading Decisions
| Decision Type | What to Look For | Explanation / Notes |
|---|---|---|
| When to Enter | – TSI–signal line crossovers with distance > 2 – Confirm with Trend, Support/Resistance, Candlestick patterns, or Chart Patterns | Momentum leaving Neutral often precedes major moves. Entries become higher probability when multiple tools confirm the shift. |
| When to Exit | – Distance > 7 between TSI and signal line | Indicates Overbought/Oversold conditions and a likely reversal. Reliability increases when combined with Candlestick patterns or S/R levels. |
| When to Wait (No Trade) | – Distance < 2 | Momentum is Neutral. This phase typically produces noise and false signals. The TSI helps you avoid low-quality, choppy conditions. |
Why the TSI Works Best With Other Indicators
| Indicator Type | How It Enhances TSI Signals | Key Notes / Examples |
|---|---|---|
| Trend Indicators (LSMA) | Confirms the trend after the Momentum shift | – Prevents premature entries- Reduces false signals in ranges- Validates direction once Momentum turns |
| Japanese Candlestick Patterns | Provides a psychological context that the TSI cannot show | Common patterns that align with TSI reversals:- Bearish Engulfing- Shooting Star- Bullish Piercing Pattern- Marubozu breakout candles |
| Chart Patterns | Structural confirmation after Momentum signals | – Wedges, double tops/bottoms, triangles- Often complete shortly after TSI exit signals |
| Support & Resistance Levels | Strongest confirmation for TSI signals | Provides a psychological context the TSI cannot show |
What’s the Next Step?
- Open your favorite chart.
- Add the TSI with the recommended settings (20, 10, 5).
- Look for signal-line crossovers and measure the distance.
- Confirm each signal with Trend, Candlesticks, Chart Patterns, and S/R.
- Track Momentum shifts moving out of Neutral—they often precede big opportunities.
If you need a structured process to support your TSI analysis, start with the Six Basics of Chart Analysis.

It pairs perfectly with momentum tools and comes with a weekly Forex Forecast delivered every Sunday.
Frequently Asked Questions
What is the True Strength Index and how does it work?
It measures the strength of price movement using double smoothed values and signal-line crossovers to highlight Momentum reversals, Overbought/Oversold conditions, and Neutral zones.
Can you combine the TSI with other indicators?
Yes. It becomes significantly stronger when combined with Trend indicators, Japanese Candlesticks, Chart Patterns, and Support/Resistance.
Conclusion
The True Strength Index is one of the most reliable and flexible Momentum indicators available to Forex traders.
Its clean crossovers, adaptive Overbought/Oversold measurement, and compatibility with other technical tools make it ideal for spotting early reversals and filtering out noise.
By learning to read the TSI correctly and combining it with strong confirmation tools, you can dramatically improve the precision and confidence of your trading decisions.
TSI Knowledge Check: 5-Question Quiz
1. What does a TSI–signal line distance of less than 2 indicate?
A. Strong Bullish Momentum
B. Strong Bearish Momentum
C. Neutral Momentum
D. Oversold conditions
2. When is a Bullish TSI entry signal generated?
A. When TSI crosses the centerline
B. When the signal line crosses above the TSI with distance >2
C. When RSI shows Overbought
D. When the TSI distance exceeds 7
3. Why are the default TSI settings not recommended for Momentum trading?
A. They are too sensitive
B. They turn the TSI into a Trend indicator
C. They cause more crossovers
D. They eliminate Neutral zones
4. What is considered an exit signal using the TSI?
A. A centerline crossover
B. A candlestick reversal pattern
C. TSI–signal distance exceeding 7
D. A Change of Character pattern
5. Which tool provides the strongest confirmation for TSI signals?
A. Bollinger Bands
B. Support and Resistance levels
C. Volume indicators
D. VWAP
Answer Key
- C — Neutral Momentum
- B — Signal line crossing above TSI with distance >2
- B — Default settings behave more like a Trend indicator
- C — Distance >7 indicates Overbought/Oversold
- B — Support and Resistance provide the strongest confirmation
Forex Trading Disclosure Statement
Risk Warning:
Forex trading involves significant risk and may not be suitable for all investors. The leveraged nature of Forex trading can work both for and against you, leading to substantial gains or losses. Before trading Forex, you should carefully consider your financial objectives, experience level, and risk tolerance. It is possible to lose more than your initial investment, and you should only trade with money you can afford to lose.
Market Risks and Volatility:
Forex markets are influenced by global economic, political, and social events, which can result in unpredictable price movements. High market volatility can lead to sudden and substantial changes in currency values, potentially causing losses that exceed your initial deposit.
Leverage Risks:
Leverage amplifies both potential gains and potential losses. While leverage can increase profitability, it also increases the risk of significant losses, including the loss of your entire trading capital.
Trading Tools and Technology Risks:
Forex trading platforms, including those offered by brokers, are subject to technology risks, such as system failures, latency issues, and potential errors in price feeds. Traders should be aware that these risks can impact the execution of trades and trading outcomes.
No Guarantee of Profitability:
Past performance in Forex trading is not indicative of future results. There is no guarantee that you will achieve profits or avoid losses when trading Forex. Market conditions and individual trading strategies vary, and no trading system can eliminate the inherent risks of Forex trading.
Educational Purposes Only:
Any information provided about Forex trading, including strategies, analysis, or market commentary, is for educational purposes only and should not be considered financial advice. Consult a qualified financial advisor or tax professional before making any trading decisions.
Regulatory Compliance:
Forex trading is regulated differently in various jurisdictions. Ensure that you are trading with a licensed and compliant broker in your country of residence.
Responsibility:
You are solely responsible for your trading decisions and the associated risks. It is your duty to understand the terms and conditions of Forex trading, including margin requirements, stop-losses, and other risk management tools.
Acknowledgment:
By engaging in Forex trading, you acknowledge that you have read, understood, and accepted this disclosure statement. You accept full responsibility for the outcomes of your trading decisions and agree to trade at your own risk.