
Pennants, Flags, and Rectangles are among the most reliable continuation chart patterns you can use as a Forex trader.
Unlike reversal patterns—where you must determine whether price will turn—these continuation formations already tell you the likely direction. Your job is to identify the pattern, wait for the breakout, and ride the next move.
In this guide, you’ll learn how these patterns form, how to trade them, and how to enhance them with tools like Momentum, Japanese Candlesticks, and Support and Resistance.
TL;DR (Quick Summary)
- Pennants, Flags, and Rectangles are continuation patterns, meaning price typically resumes in its original direction.
- Best practice is to wait for the breakout before entering the trade.
- Confirmation tools—Momentum, Candlesticks, Support/Resistance—can substantially improve accuracy.
- Avoid relying solely on “Measured Moves”; use proven tools for Stops and Targets.
- Rectangles break in both directions more frequently than Pennants and Flags.
Table of Contents
- TL;DR (Quick Summary)
- Understanding Pennants, Flags, and Rectangles
- How to Trade Pennants
- Bull Pennants
- Bear Pennants
- How to Trade Flags
- Understanding Rectangles
- How to Trade a Rectangle
- Combining Continuation Patterns with Other Confirmations
- Confirmation Tools Table
- Combining with Momentum
- Combining with Japanese Candlesticks
- Combining with Support and Resistance
- Conclusion
- Quiz: Pennants, Flags, and Rectangles
- 1. What do Pennants and Flags primarily signal in Forex trading?
- 2. Which confirmation tool is considered the strongest when evaluating continuation patterns?
- 3. Which pattern typically forms after a sharp directional move followed by consolidation in a small triangle?
- 4. Why combine Momentum indicators with continuation patterns?
- 5. What does a breakout from a Rectangle often indicate?
- Answer Key
- What’s the Next Step?
- Frequently Asked Questions
- Forex Trading Disclosure Statement
Understanding Pennants, Flags, and Rectangles
Pennants, Flags, and Rectangles all signal temporary consolidation before price continues in the original direction. Each pattern has a unique structure:
- Pennants: Small triangular consolidation with converging trendlines.
- Flags: Sloping rectangular consolidation after a sharp move (the “flagpole”).
- Rectangles: Sideways consolidation trapped between horizontal Support and Resistance.
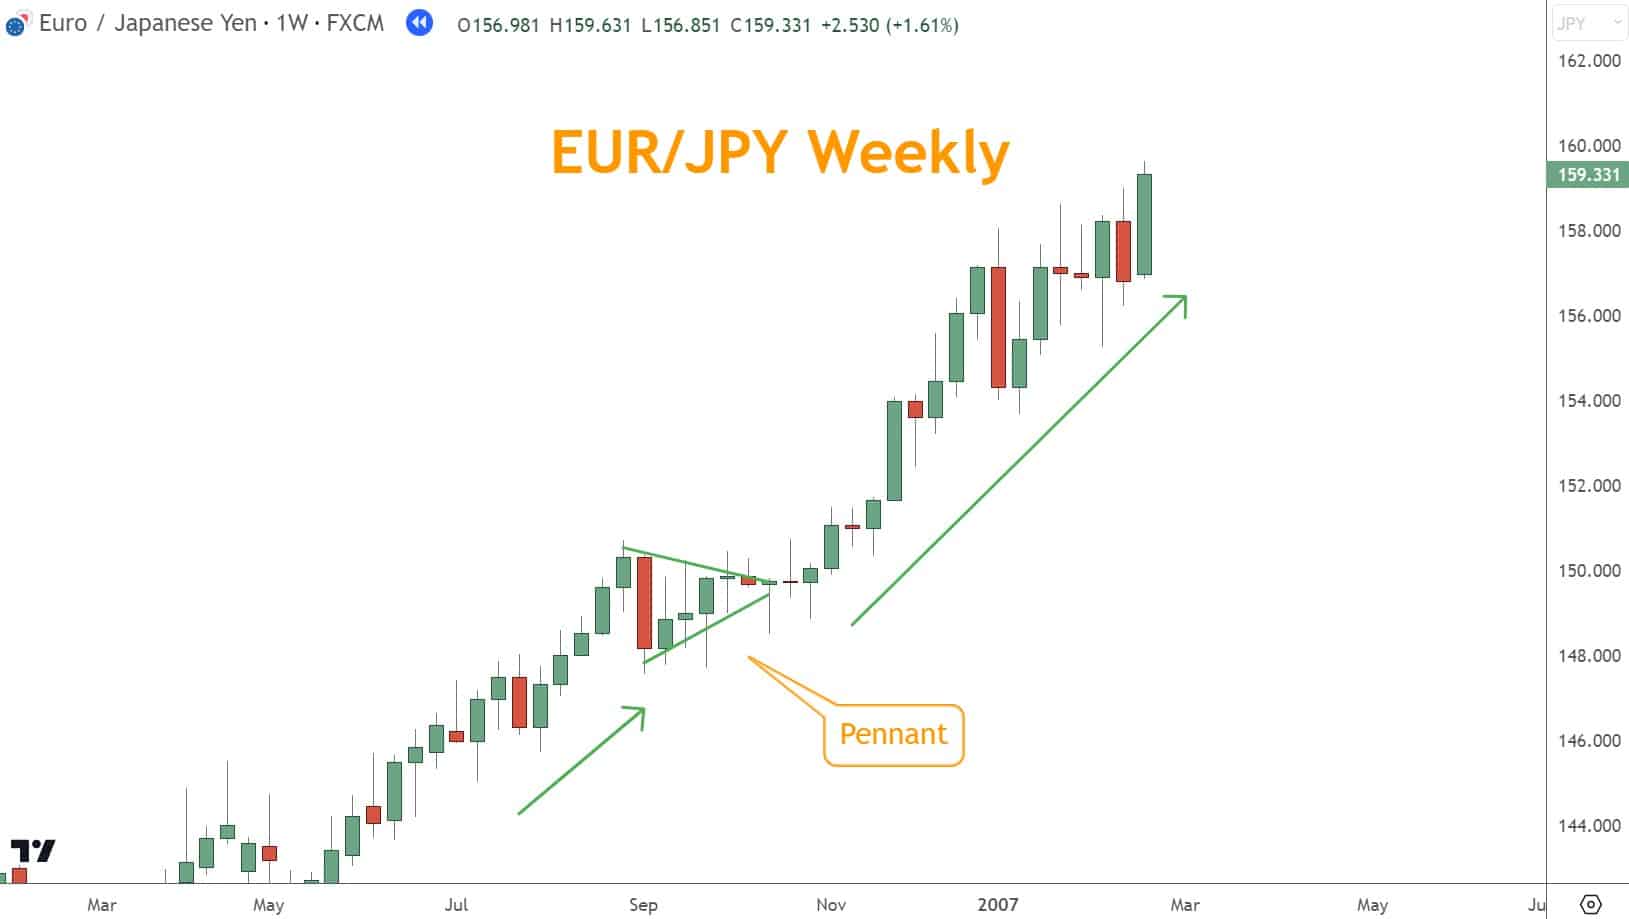
For example, a Pennant Chart Pattern, as illustrated below, is characterized by a triangular shape with converging lines, indicating a temporary pause in the direction before a potential continuation.
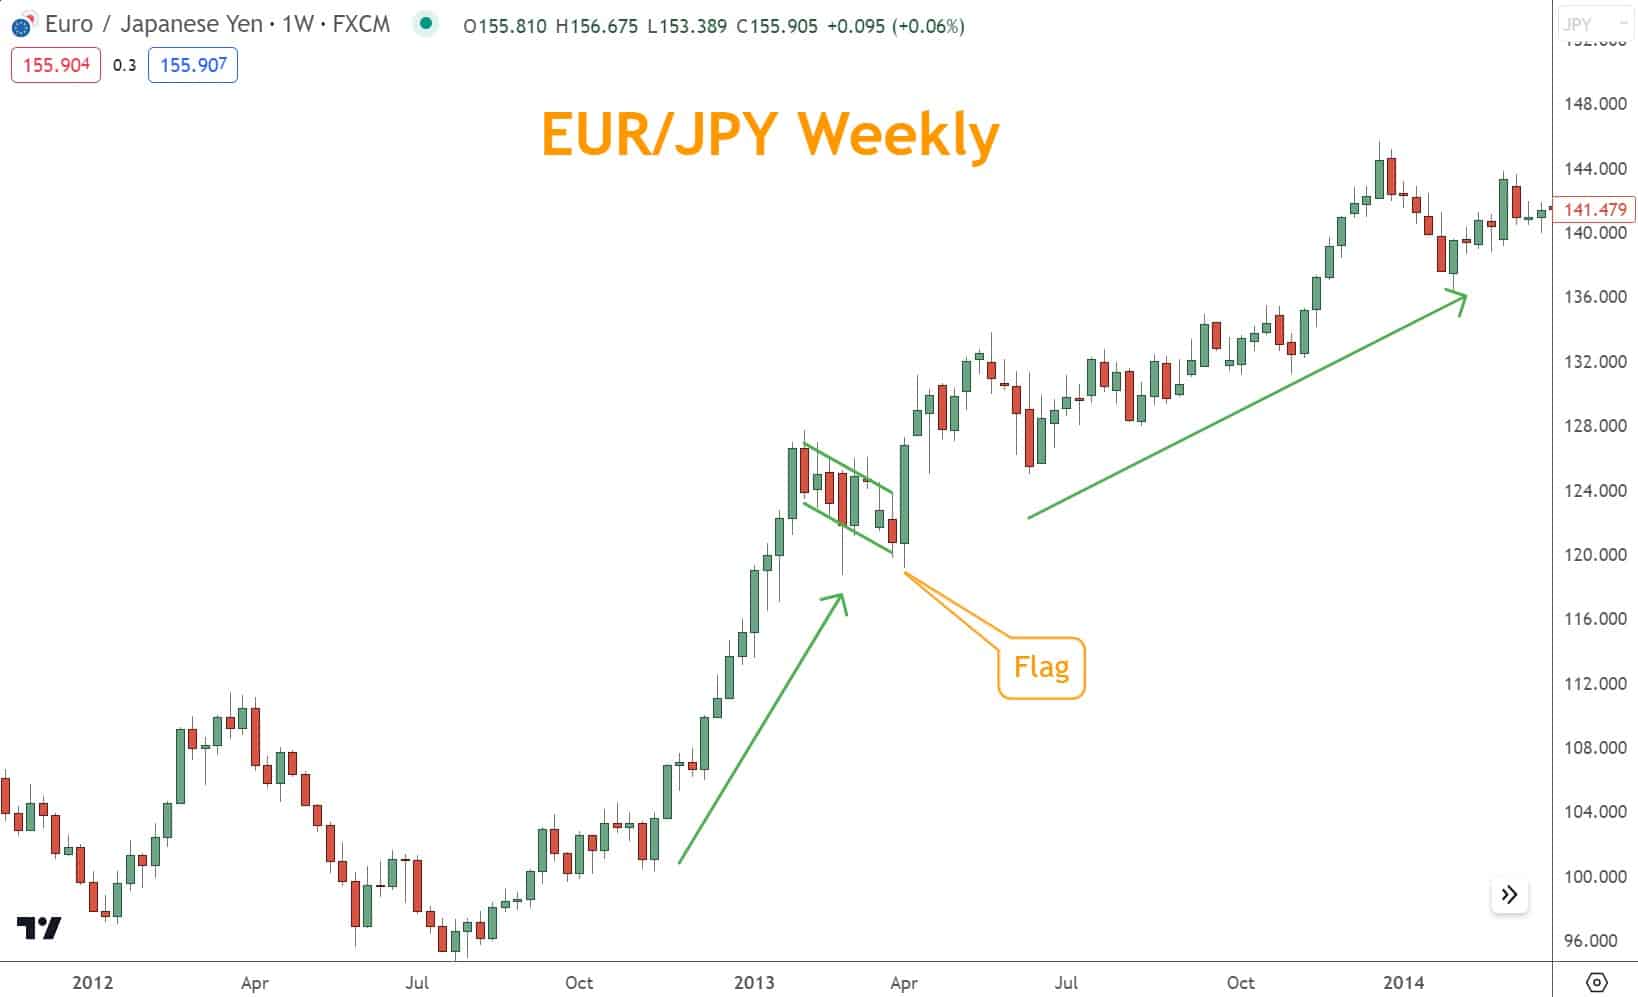
On the other hand, as you can see in the Flag pattern below is more rectangular, representing a brief consolidation phase before the price resumes its original direction.
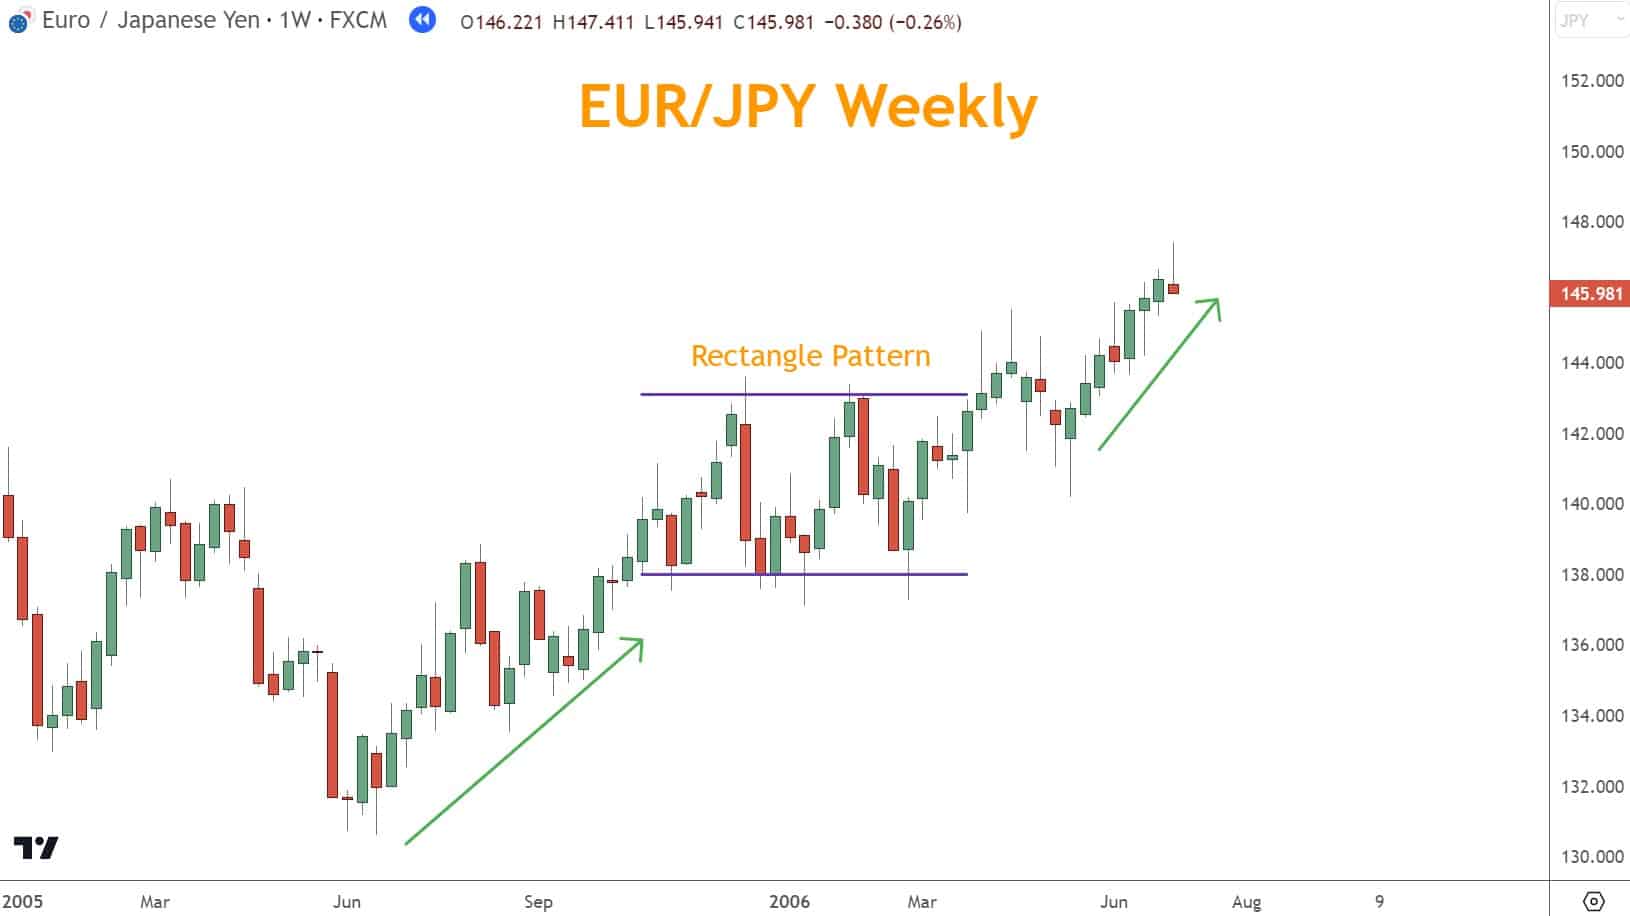
The Rectangle pattern below comprises price trapped between two horizontal lines. When prices leave the Rectangle, they can move in either direction.
It’s important to note that these patterns should not be considered in isolation but rather in conjunction with other indicators and tools.
In addition, it is crucial to have a trading plan in place, including stop loss and take-profit levels, to manage risks effectively.
Key Pattern Characteristics (Overview Table)
| Pattern | Appearance | Direction Bias | What It Means |
| Pennant | Small triangle with converging lines | Strong continuation bias | A pause following an aggressive move |
| Flag | Narrow parallel channel | Strong continuation bias | Price is resting before continuing |
| Rectangle | Horizontal range | Neutral (can break either way) | Buyers and sellers battling for control |
Why These Patterns Work
These consolidations serve as the market’s “reset” mechanism—absorbing orders, cooling momentum, and preparing for the next directional movement.
Use them together with indicators (Momentum, Candlesticks, S/R) to improve the quality of your entries, Stops, and Targets.
How to Trade Pennants
Pennants form after a strong surge or selloff and narrow into a tight triangle as market energy compresses.
How to Identify a Pennant
- A sharp move forms the “pole”
- Small consolidation with converging trendlines
- Breakout typically continues the original direction
Pennant formations are a typical Forex trading pattern that indicates a continuation of the current trend.
They are formed by a consolidation period after a strong price move, characterized by converging lines. Traders can enter a trade when the price breaks out of the pennant pattern in the previous direction.
One way to manage risk in this trade is to place a stop-loss below the Pennant’s lowest point and set take-profit targets based on the size of the previous price move.
This technique is called a “Measured Move.”
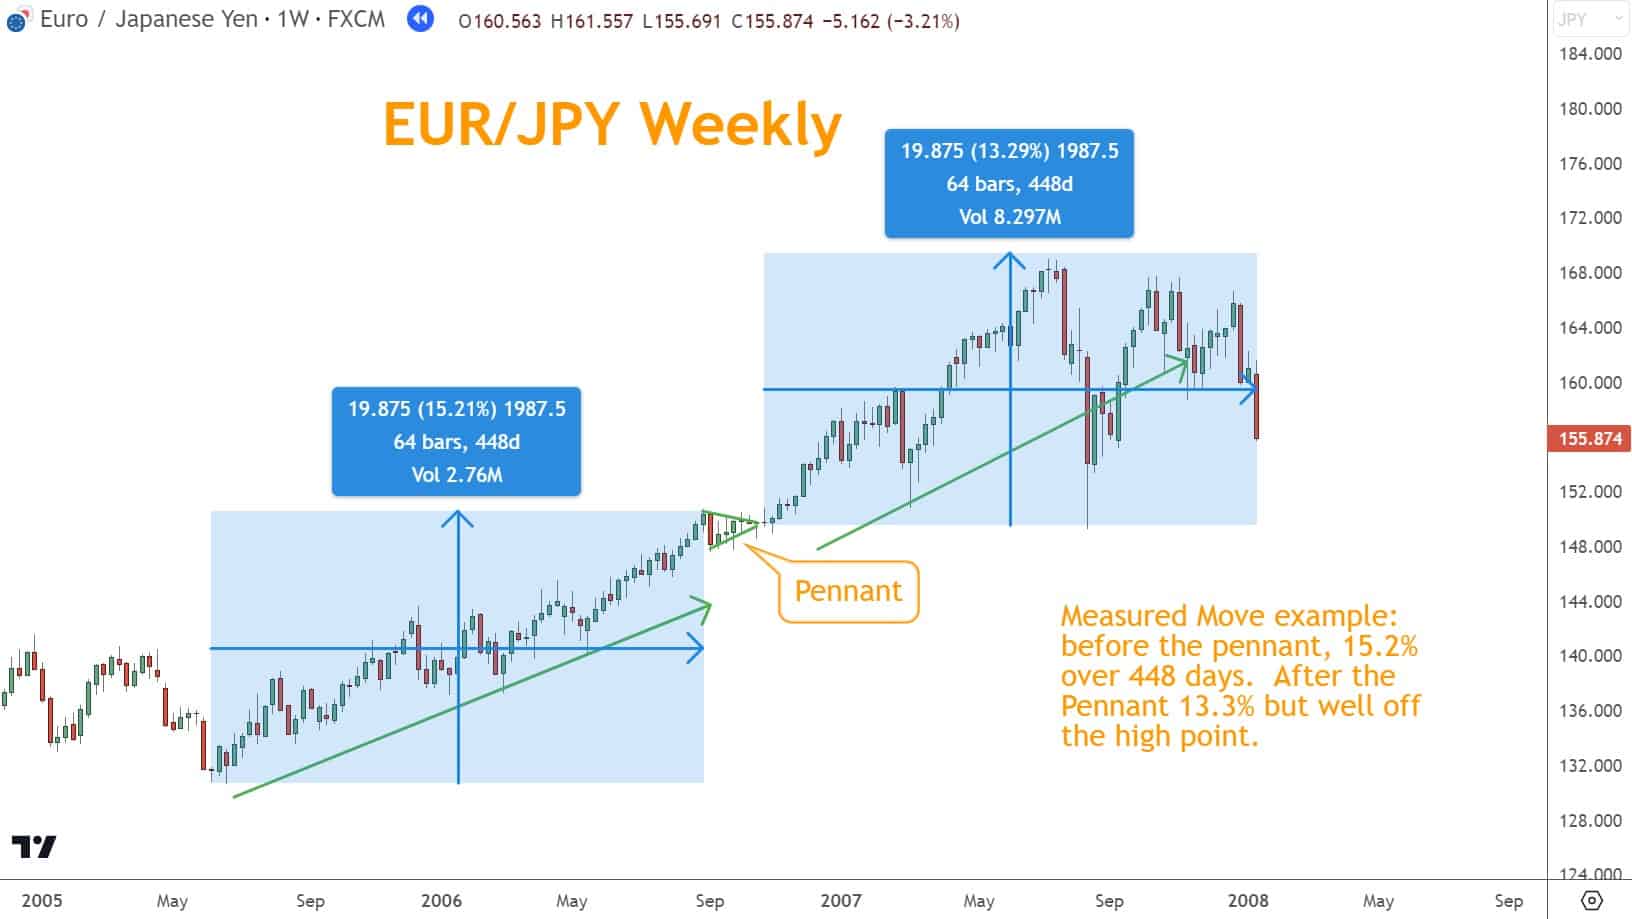
The idea behind Measured Move is that a Forex pair will move just as far after the Pennant as before.
I prefer not to use this approach and instead examine other technical analysis elements to choose a stop and target since I consider the Measured Move arbitrary.
Trading Steps
- Wait for a breakout above (Bullish) or below (Bearish) the triangle
- Avoid placing Stops inside the Pennant
- Use Support/Resistance levels for more reliable stop placement
- Skip Measured Move targets; they are often arbitrary
- Confirm the breakout with Momentum or Candlestick signals
Bull Pennants
A Bull Pennant is a continuation pattern that forms after a significant rally.
A small triangle with converging lines characterizes it. The pattern typically signals a temporary consolidation before the price resumes its rise.
When trading, I search for a breakout above the upper boundary of the Pennant as a signal to enter a long position.
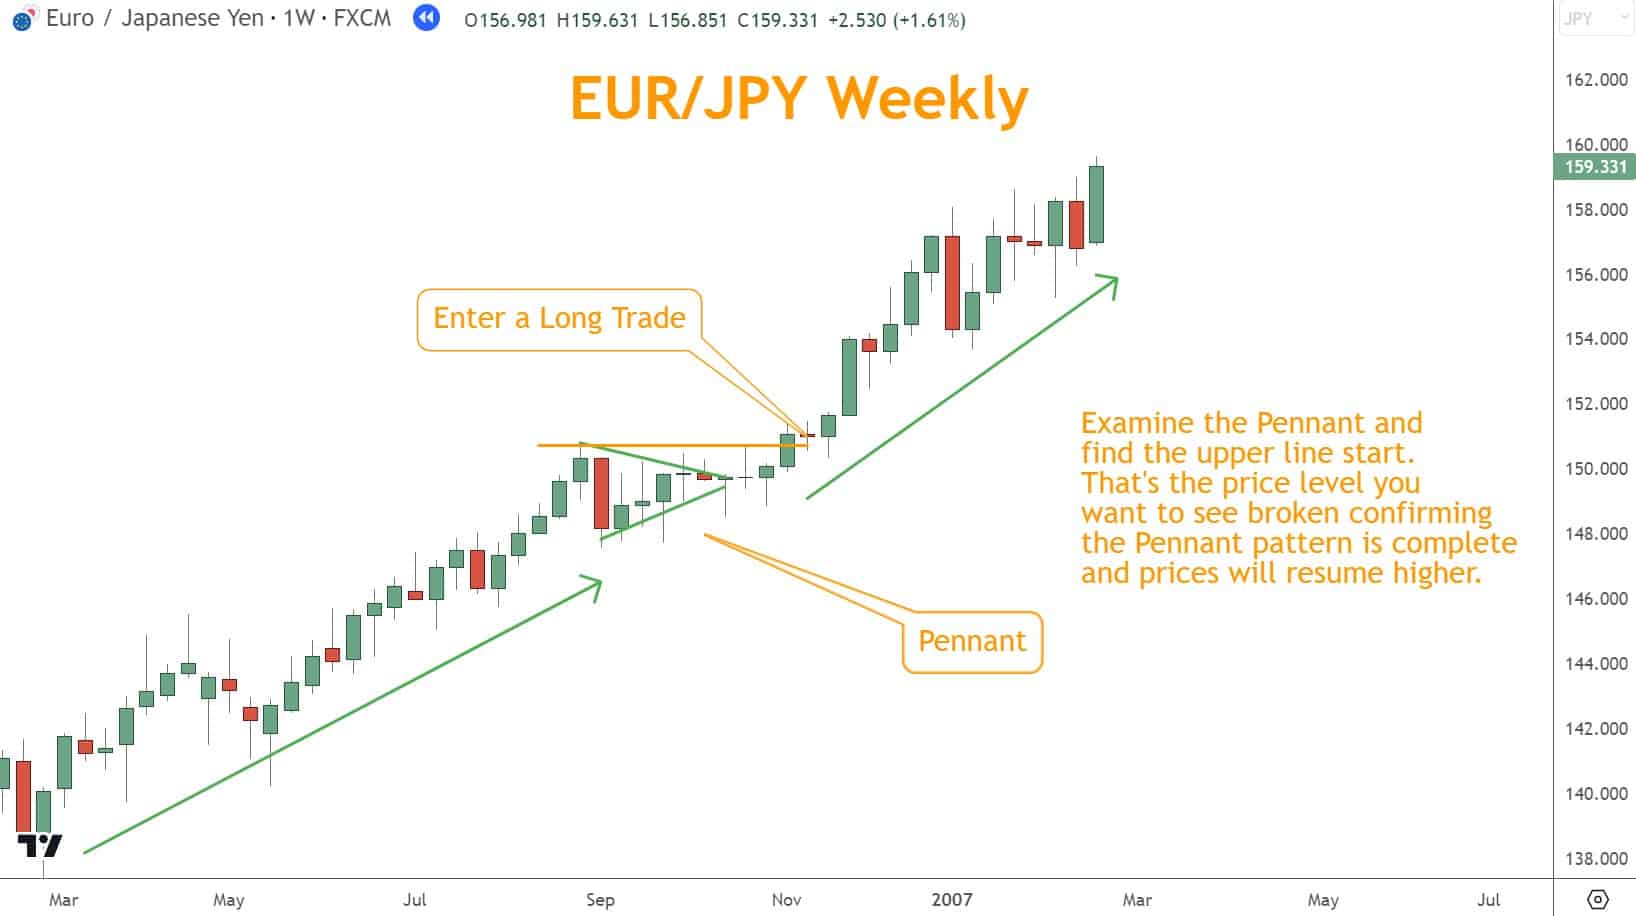
Entry: Breakout above the upper trendline.
Stops: Set below the Pennant or at a major Support level.
Targets: Use Support/Resistance or broader structure—not Measured Moves.
Bear Pennants
A Bear Pennant is the mirror opposite: A selloff → small triangle → continuation lower.
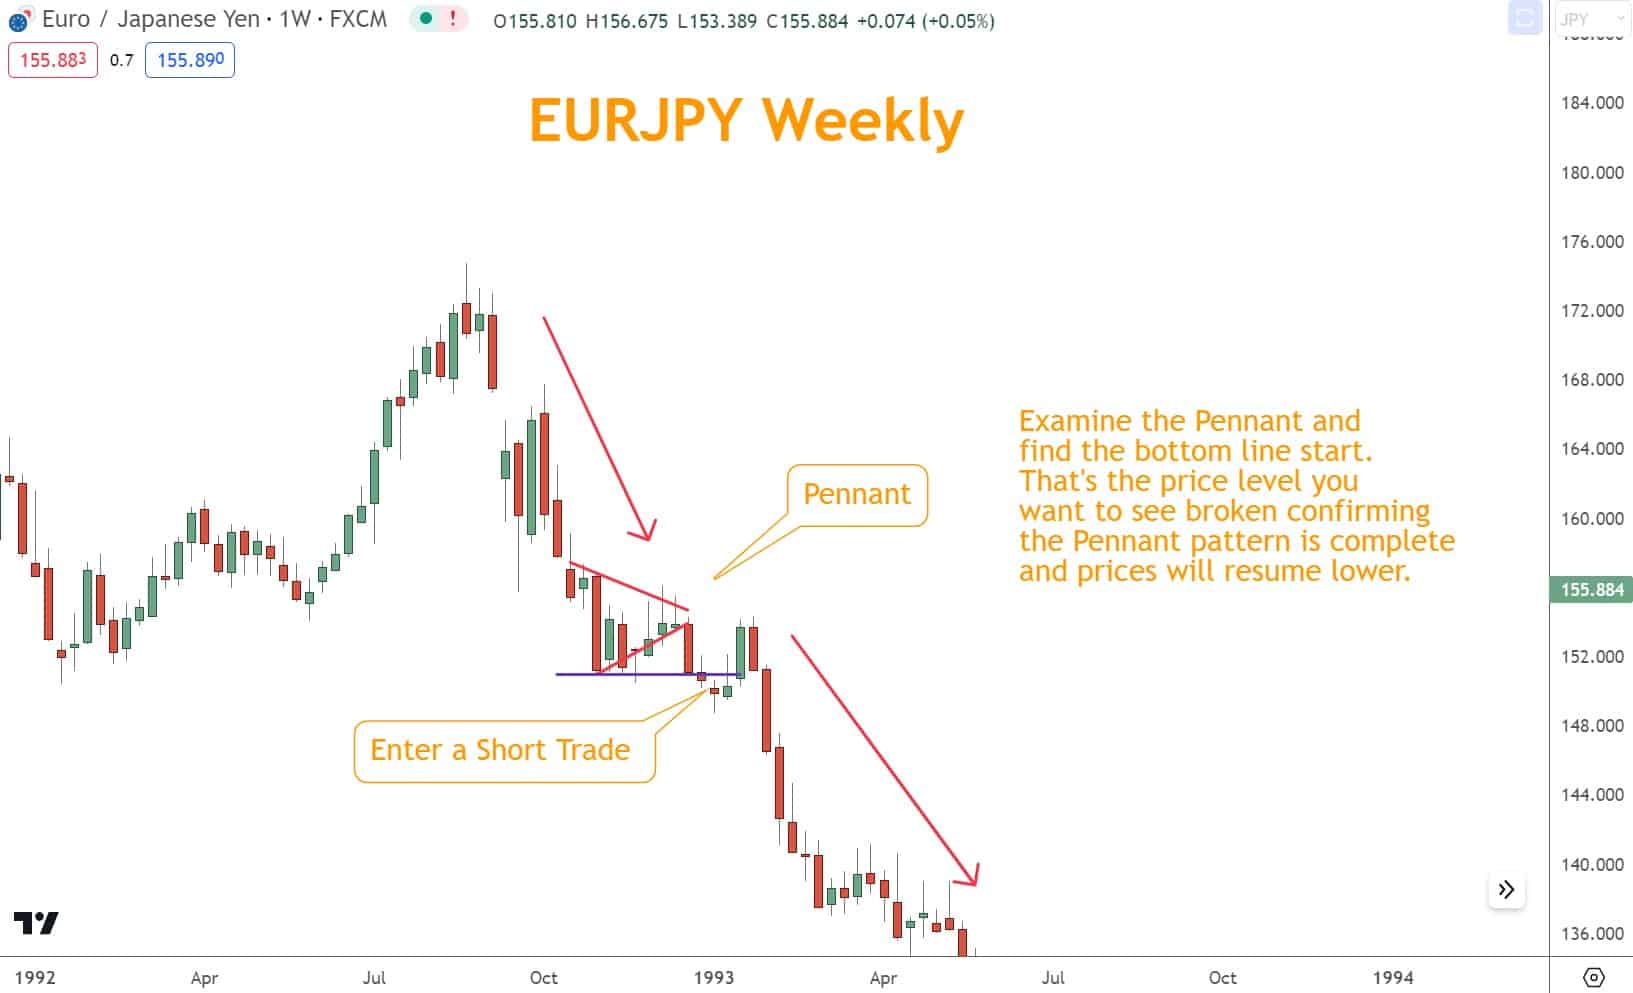
This continuation pattern is confirmed when the price breaks below the triangle’s lower line, indicating further downside.
Entry:
Breakdown below the lower boundary.
Stops:
Above the triangle or at a key Resistance level.
Targets:
Use structure-based levels.
How to Trade Flags
Flags resemble a slanted rectangular consolidation after a sharp move.
A Bull Flag is a typical Chart Pattern in Forex trading that signals a continuation of a Rally.
This pattern is formed when there is a sharp upward price movement, known as the flagpole, followed by a consolidation period called the Flag.
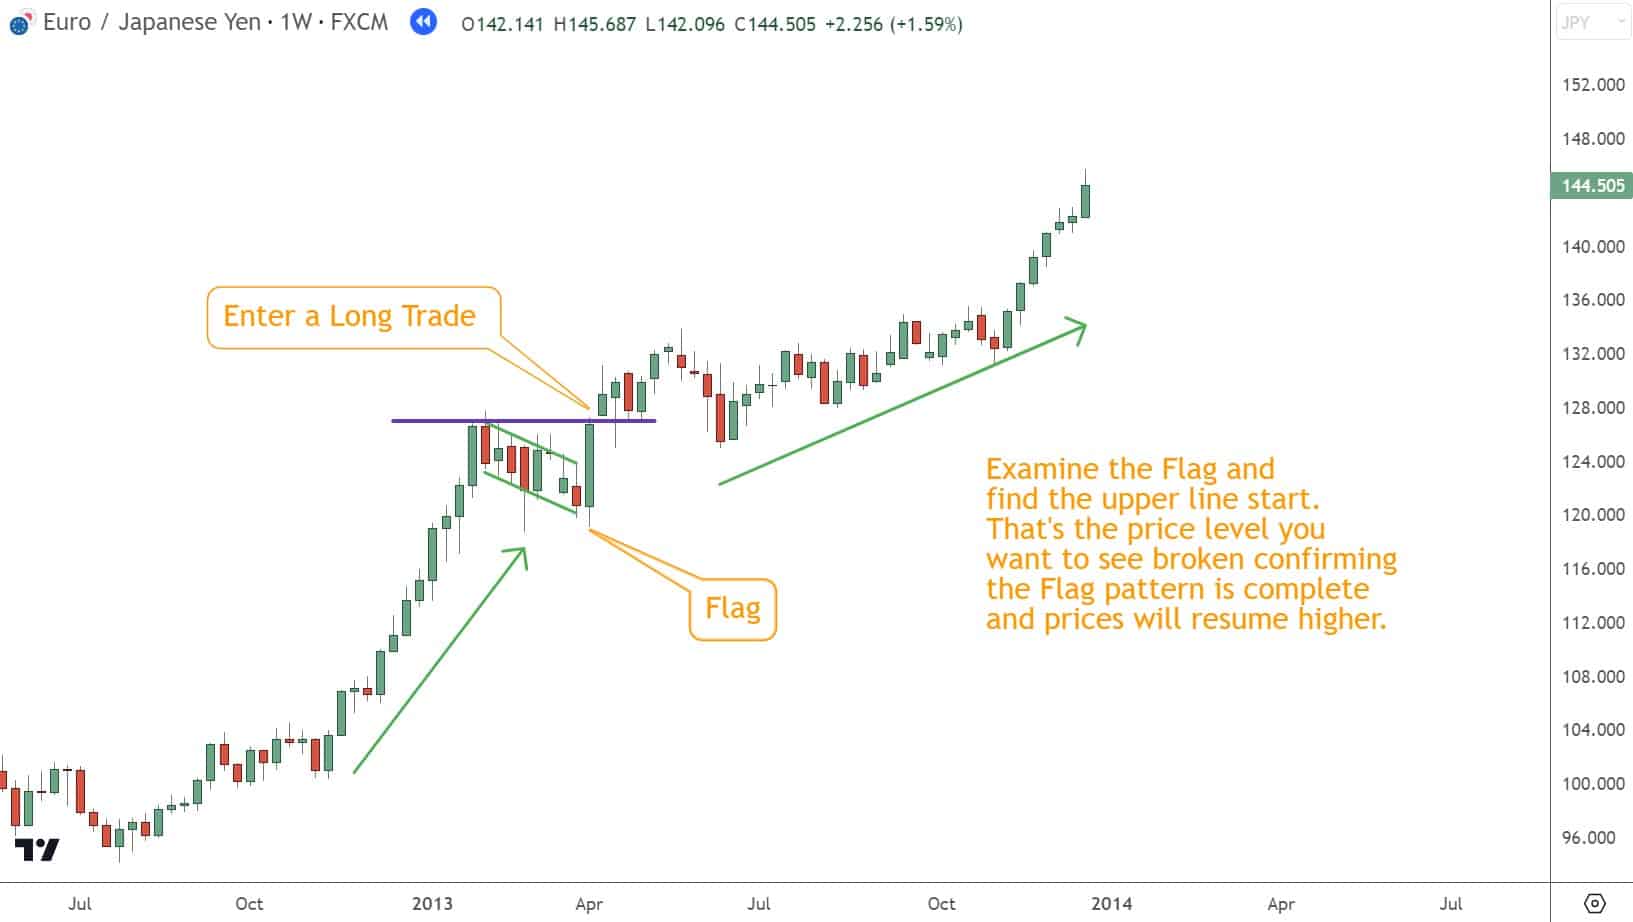
To trade a Bull Flag, wait for the price to break out above the upper line of the Flag and enter a long position.
Stop losses can be set below the lower line of the Flag or using another technical analysis approach to limit potential losses.
Bull Flags
- Form after a strong Rally
- Consolidation slopes slightly downward
- Breakout above the Flag = continuation higher
Bear Flags are a typical Chart Pattern in Forex trading that suggests a potential continuation of a Selloff.
These patterns are characterized by a sharp price decline followed by a period of consolidation in the form of a Flag shape.
To trade a Bear Flag, wait for a break below the lower boundary of the Flag and enter a short position.
It is crucial to set stop-loss orders above the upper boundary of the Flag.
Bear Flags
- Form after a strong selloff
- Consolidation slopes slightly upward
- Breakdown below the Flag = continuation lower
Flags often appear in trending markets and tend to break with momentum.
Understanding Rectangles
Rectangles differ from Pennants and Flags because they have no inherent directional bias.
This pattern is formed when prices consolidate between two horizontal levels, creating a range-bound market.
How They Form
- Price oscillates between clear horizontal Support and Resistance
- Market is undecided—buyers and sellers fight for control
- Breakouts can occur in either direction
Best Practices
- Wait for a clean breakout
- Treat false breakouts as high-quality reverse-direction setups
- Place stops outside the range at key structural levels
How to Trade a Rectangle
You can identify Rectangles by drawing horizontal lines connecting the highs and lows of the consolidation period.
Once a rectangle pattern is identified, look for potential breakouts or breakdowns from the range.
Breakouts occur when the price breaks above the upper boundary of the Rectangle, signaling a potential Bullish move. Breakdowns happen when the price breaks below the lower boundary of the Rectangle, signaling a likely Bearish move.
False breakouts are often strong signals to trade in the opposite direction, as seen in this Rectangle example.
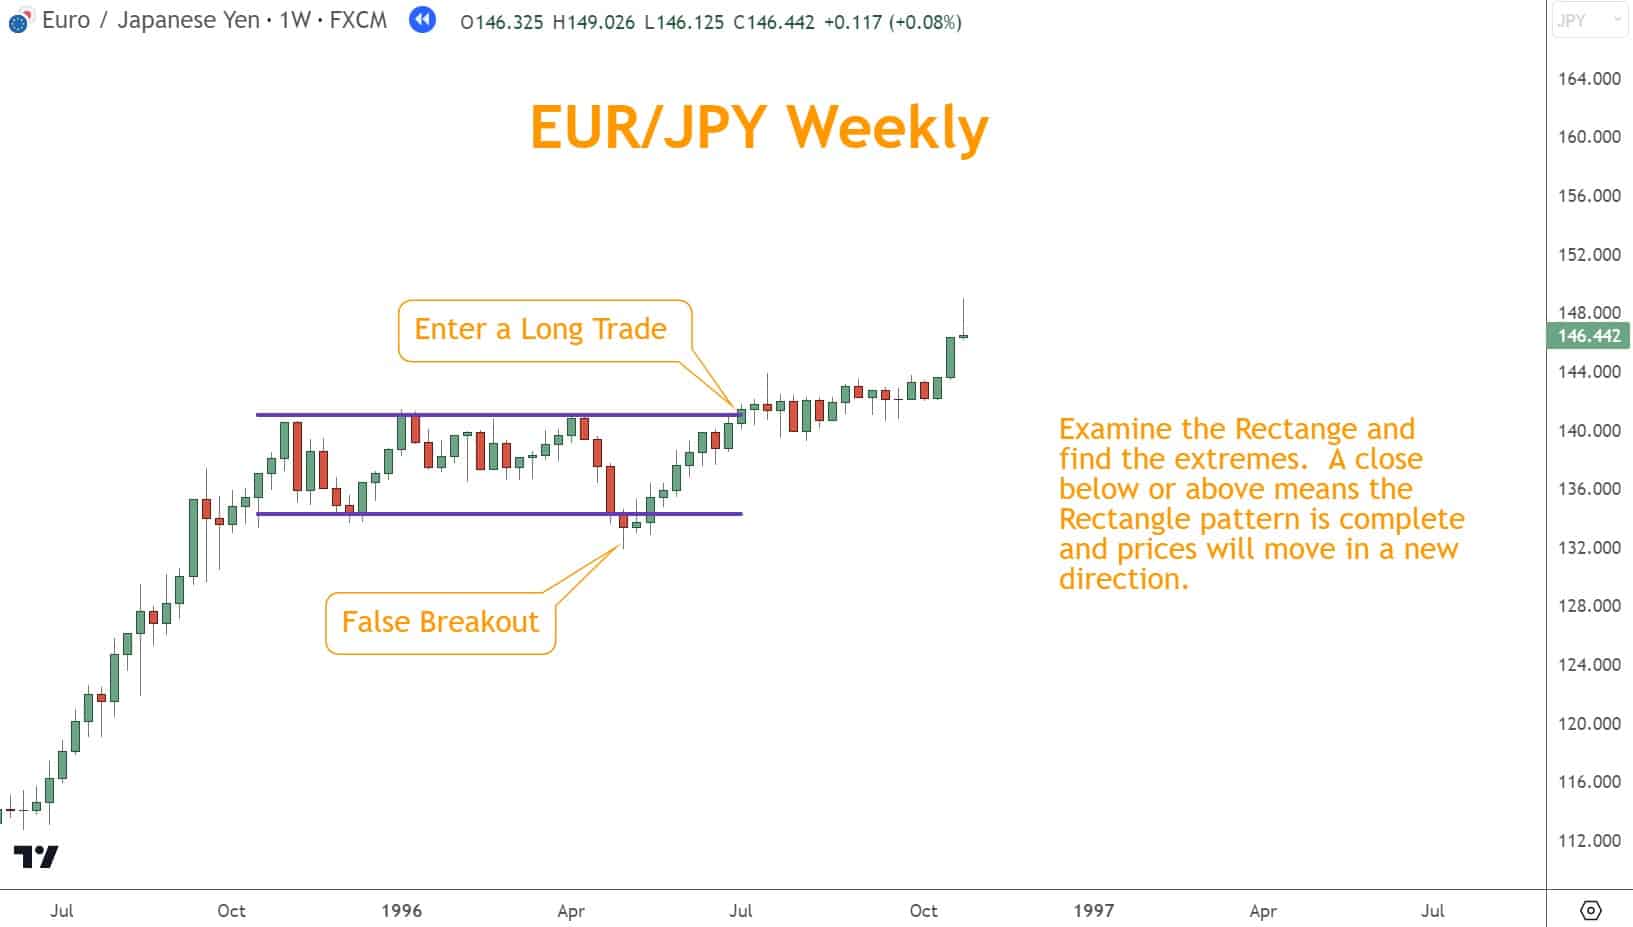
Entry
- Breakout above Resistance → long
- Breakout below Support → short
False breakouts are common—and often signal the real move is coming in the opposite direction.
Stops
- Place beyond the opposite side of the rectangle or at major S/R zones
Targets
- Use Support/Resistance or trend continuation structure
Combining Continuation Patterns with Other Confirmations
To maximize accuracy, pair these patterns with strong confirmation tools.
Confirmation Tools Table
| Tool Category | Examples | Why It Matters |
| Momentum Indicators | CCI, Stochastic, RSI, TSI | Shows strength or weakness. Oversold/overbought conditions and divergences confirm the potential for continuation. |
| Japanese Candlesticks | Shooting Star, Hammer, Engulfing | Help validate whether a breakout is genuine or weakening. |
| Support & Resistance | Major horizontal levels, Swing Highs/Lows | Most reliable confirmation. Crucial for Stops, Targets, and entry timing. |
Combining with Momentum
Momentum indicators can help confirm the strength behind a breakout.
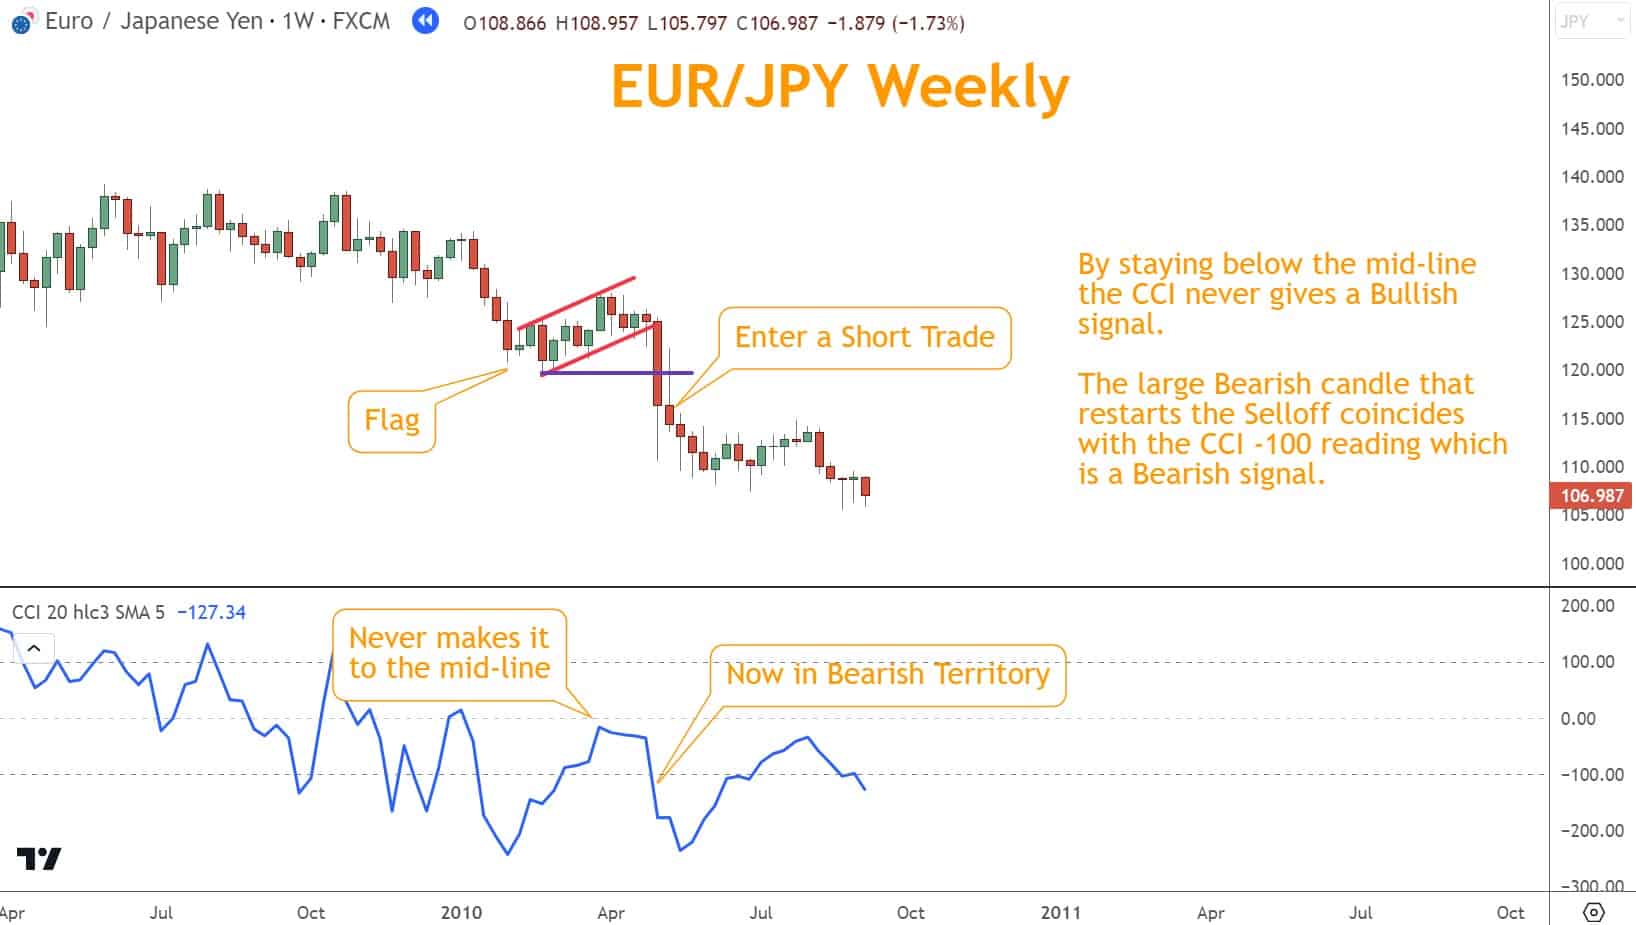
Momentum indicators, such as the CCI or Stochastic, can confirm signals provided by Continuation patterns.
For instance, when a Bullish Pennant pattern appears complete and the price is oversold, it confirms a potential rally.
Conversely, if a Bearish Flag pattern is forming and the Stochastic is overbought, it suggests a potential selloff soon.
In the example below EUR/JPY’s CCI indicator fails at the midline and shortly after produces a bearish candle which closed below the base of the Flag pattern.
Combining with Japanese Candlesticks
Candlesticks reveal real-time sentiment shifts:
- Shooting Star with a Bear Pennant
- Hammer with a Rectangle
- Engulfing pattern before breakout
Combining these continuation patterns with Japanese Candlestick patterns can help confirm reversals or continuations.
For example, if a Bearish Pennant pattern forms and is accompanied by a Shooting Star Candlestick pattern, it may indicate a strong continuation of a Selloff.
An example of this is in the EUR/JPY chart below.
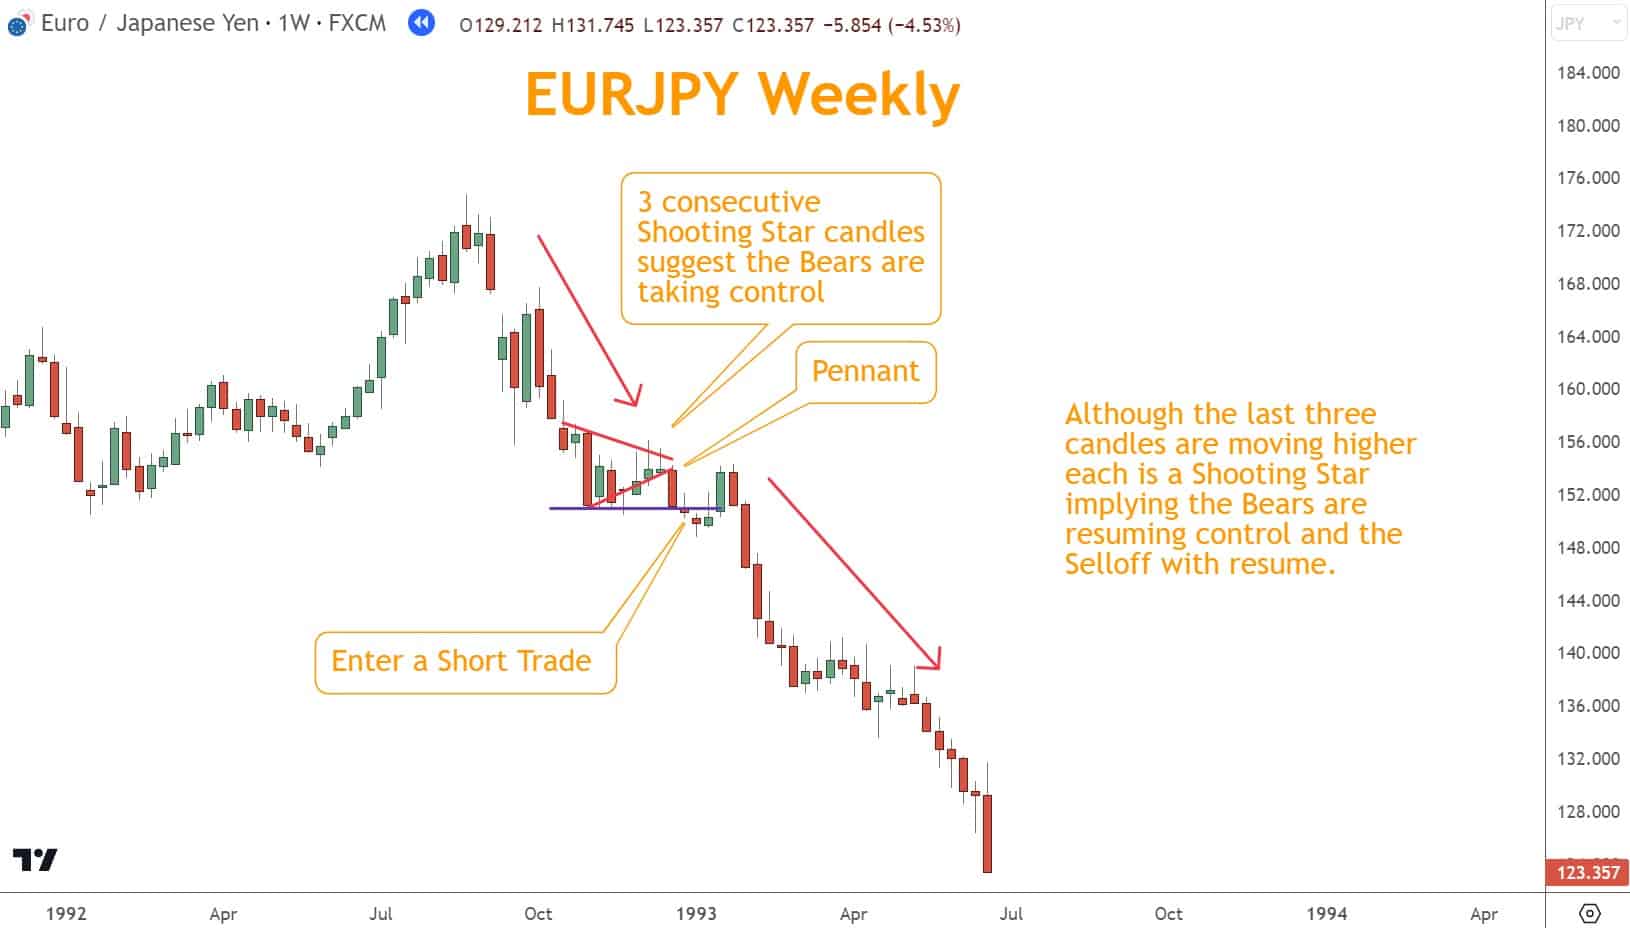
These combinations significantly increase your confidence.
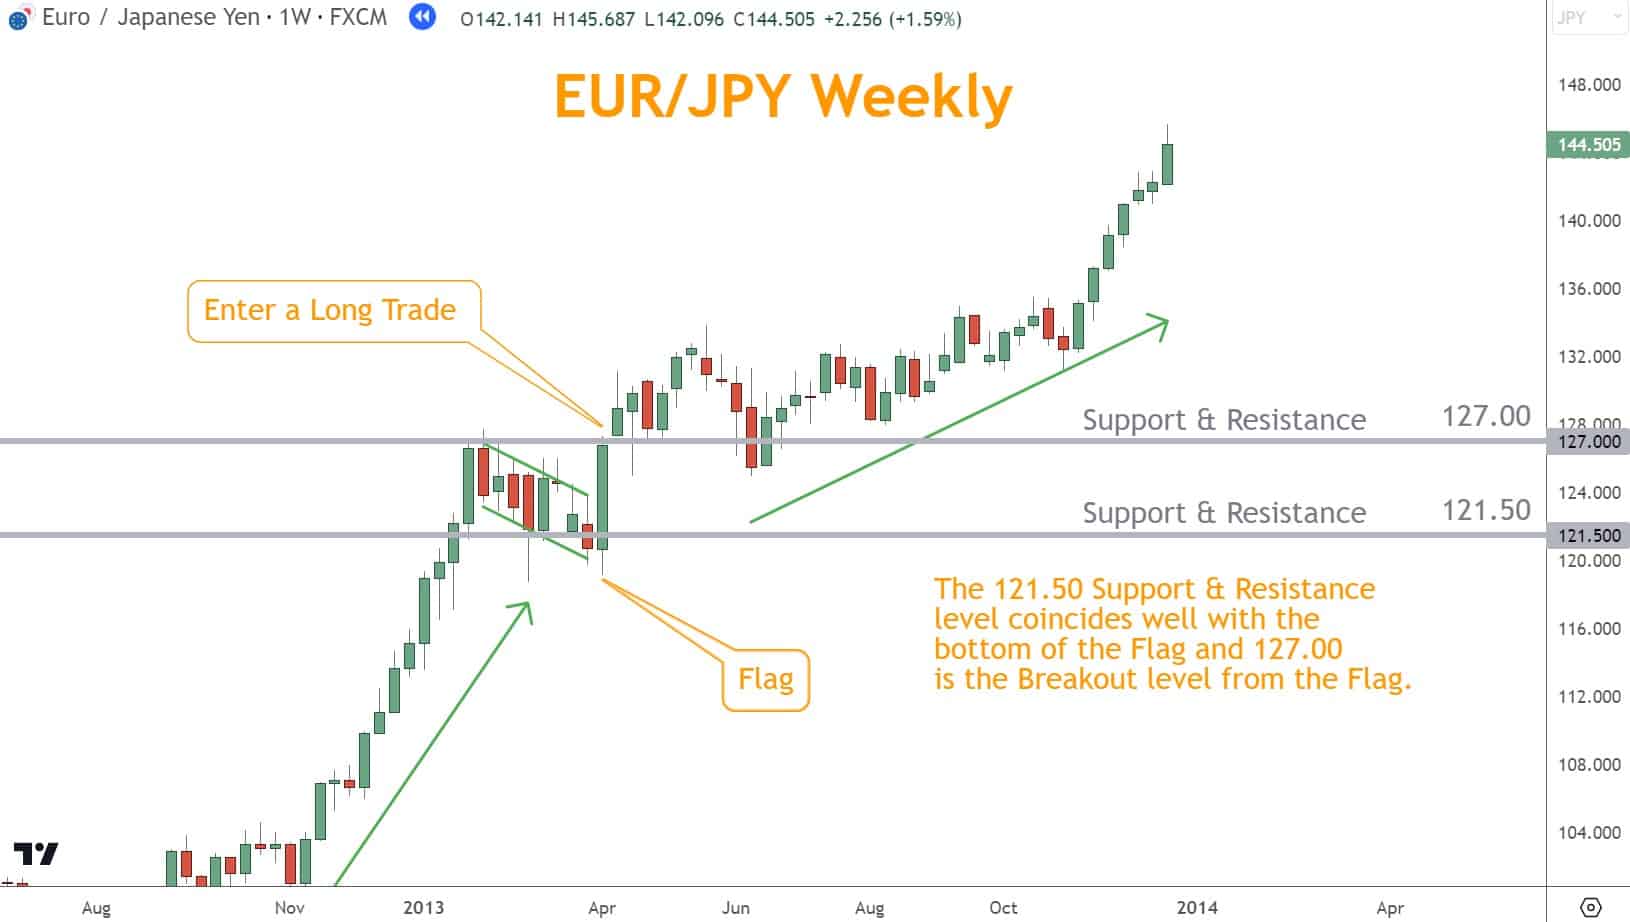
Combining with Support and Resistance
Support and Resistance levels are significant areas on a price chart where the price has previously struggled to break through or fall below.
When a continuation pattern tests a Support or Resistance level, it further validates the continuation.
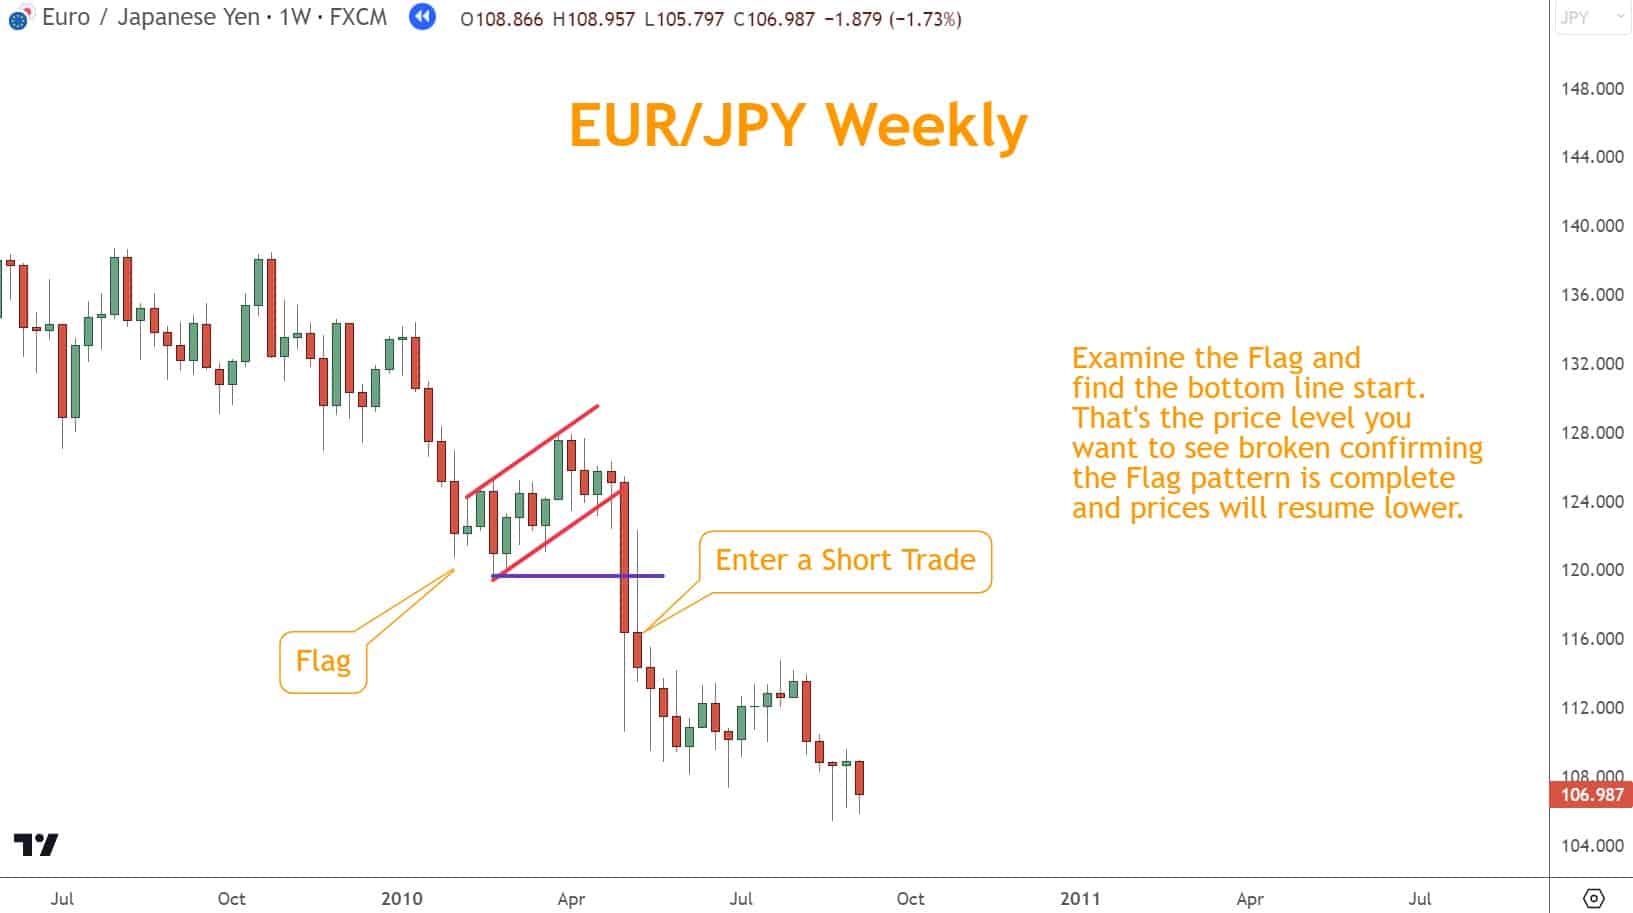
The Flag in the EUR/JPY example below is confirmed by first finding support, then taking an entry on a break of resistance.
S/R helps you:
- Confirm breakouts
- Choose accurate Stops
- Select realistic Targets
- Avoid low-probability trades
Conclusion
Pennants, Flags, and Rectangles are among the most dependable continuation patterns in Forex trading because they reveal both market structure and trader intent.
When combined with confirmation tools such as momentum indicators, Japanese Candlesticks, and support and resistance levels, these patterns provide clear, high-probability setups.
By understanding how these consolidations form, waiting for confirmation, and managing risk with discipline, you can turn simple chart formations into practical, repeatable trading opportunities.
Quiz: Pennants, Flags, and Rectangles
1. What do Pennants and Flags primarily signal in Forex trading?
A. Trend reversals
B. Continuations of the prior move
C. Neutral market conditions
D. Market exhaustion
2. Which confirmation tool is considered the strongest when evaluating continuation patterns?
A. Moving averages
B. Trendlines
C. Support and Resistance
D. Fibonacci retracements
3. Which pattern typically forms after a sharp directional move followed by consolidation in a small triangle?
A. Rectangle
B. Bull Flag
C. Pennant
D. Cup-and-Handle
4. Why combine Momentum indicators with continuation patterns?
A. To remove the need for stop-losses
B. To confirm whether the existing direction has strength
C. To guarantee the breakout direction
D. To replace all other analysis tools
5. What does a breakout from a Rectangle often indicate?
A. A continuation or reversal, depending on direction
B. A false signal
C. Always a continuation
D. Always a reversal
Answer Key
- B — Continuations of the prior move
- C — Support and Resistance
- C — Pennant
- B — To confirm whether the existing direction has strength
- A — A continuation or reversal, depending on direction
What’s the Next Step?
- Open a chart you trust and identify recent Pennant, Flag, and Rectangle patterns.
- Mark the boundaries and observe whether price respected support and resistance.
- Apply confirmation tools such as momentum, candlesticks, support/resistance—to evaluate trade quality.
- Test entries on a demo account before adding them to your live process.
If you need a structured approach, download The Six Basics of Chart Analysis—your foundation for professional-level chart reading.
You’ll also receive Forex Forecast every Sunday, which includes:
- Trade ideas
- Case studies
- Educational guides
- Videos
- Notifications of new articles
- Webinar access

All are completely free.
Frequently Asked Questions
How do you trade Flags and Pennants?
Identify the pattern, wait for a breakout in the original direction, confirm with indicators, then set Stops and Targets based on structure.
What’s the difference between a Flag and a Pennant?
A Flag is a slanted rectangle; a Pennant is a triangle with converging lines. Both are continuation patterns.
How Do You Avoid False Breakouts With Continuation Patterns?
The most effective method is to wait for confirmation before entering on the first breakout candle. Confirmation can include:
- A retest of the breakout level
- A close beyond Support/Resistance
- Momentum confirmation (RSI, CCI, Stochastic)
- Candlestick confirmation is essential. Combining these elements significantly reduces the risk of being caught in a fake move.
Should You Use Measured Moves With Pennants, Flags, and Rectangles?
Measured Moves can provide a rough estimate of potential targets, but they’re not always reliable.
Price often overshoots or undershoots the projected distance. A better approach is using horizontal Support and Resistance, swing highs/lows, or recent structure levels. These provide more realistic and higher-probability target levels.
Forex Trading Disclosure Statement
Risk Warning:
Forex trading involves significant risk and may not be suitable for all investors. The leveraged nature of Forex can amplify both gains and losses. Trade only with capital you can afford to lose.
Market Risks and Volatility:
Currency values are influenced by global economic and political events that may cause sudden price fluctuations. High volatility can result in losses exceeding your initial deposit.
Leverage Risks:
While leverage can increase profit potential, it also magnifies loss risk and may lead to margin calls or account liquidation.
Technology Risks:
Trading platforms are subject to system failures and latency issues that may impact execution accuracy or timing.
No Guarantee of Profitability:
Past performance does not guarantee future results. No system can eliminate the risks inherent in Forex trading.
Educational Purpose Only:
This material is for educational purposes and should not be construed as financial advice. Consult a qualified financial advisor before making trading decisions.
Responsibility:
You bear full responsibility for your trading decisions and their outcomes. Understand margin requirements, stop-loss tools, and risk management strategies before participating.
Acknowledgment:
By engaging in Forex trading, you acknowledge these risks and accept that all trades are undertaken at your own risk.