
Introduction
The Moving Average Convergence Divergence (MACD) is one of the most widely used technical indicators in Forex trading.
Built from exponential moving averages (EMAs), it helps identify trend direction, generate entry and exit signals, and detect momentum divergence.
In this guide, you’ll learn how MACD works, its strengths and weaknesses, and how to apply three core strategies: crossover signals, divergence signals, and zero-line crossovers.
We’ll also explore how combining MACD with RSI can refine your strategy for more reliable trades.
Summary: MACD Forex Strategies at a Glance
This section offers a quick reference table for the core MACD strategies you’ll learn and apply in this guide.
| Strategy | Signal Type | Confirmation Tools |
|---|---|---|
| Crossover Strategy | MACD line crosses signal line | Histogram, trend analysis |
| Divergence Strategy | MACD diverges from price | Price action, reversal confirmation |
| Zero-Cross Strategy | MACD crosses above/below 0 | Histogram strength, RSI filter |
| MACD + RSI Combo | Trend + momentum confirmation | RSI crossing 50 or reaching extremes |
Table of Contents
- Introduction
- Summary: MACD Forex Strategies at a Glance
- What Is the MACD Indicator?
- Why Use the Default 12, 26, and 9 Settings?
- Advantages of the MACD
- Disadvantages of the MACD
- Strategy #1: MACD Crossover Strategy
- Strategy #2: MACD Divergence Strategy
- Strategy #3: Zero-Cross Strategy
- Combining MACD with RSI
- MACD + RSI Strategy in Action
- Should You Use Stricter Filters?
- What Are Your Next Steps?
- Frequently Asked Questions
- What’s the Next Step?
- Forex Trading Disclosure Statement
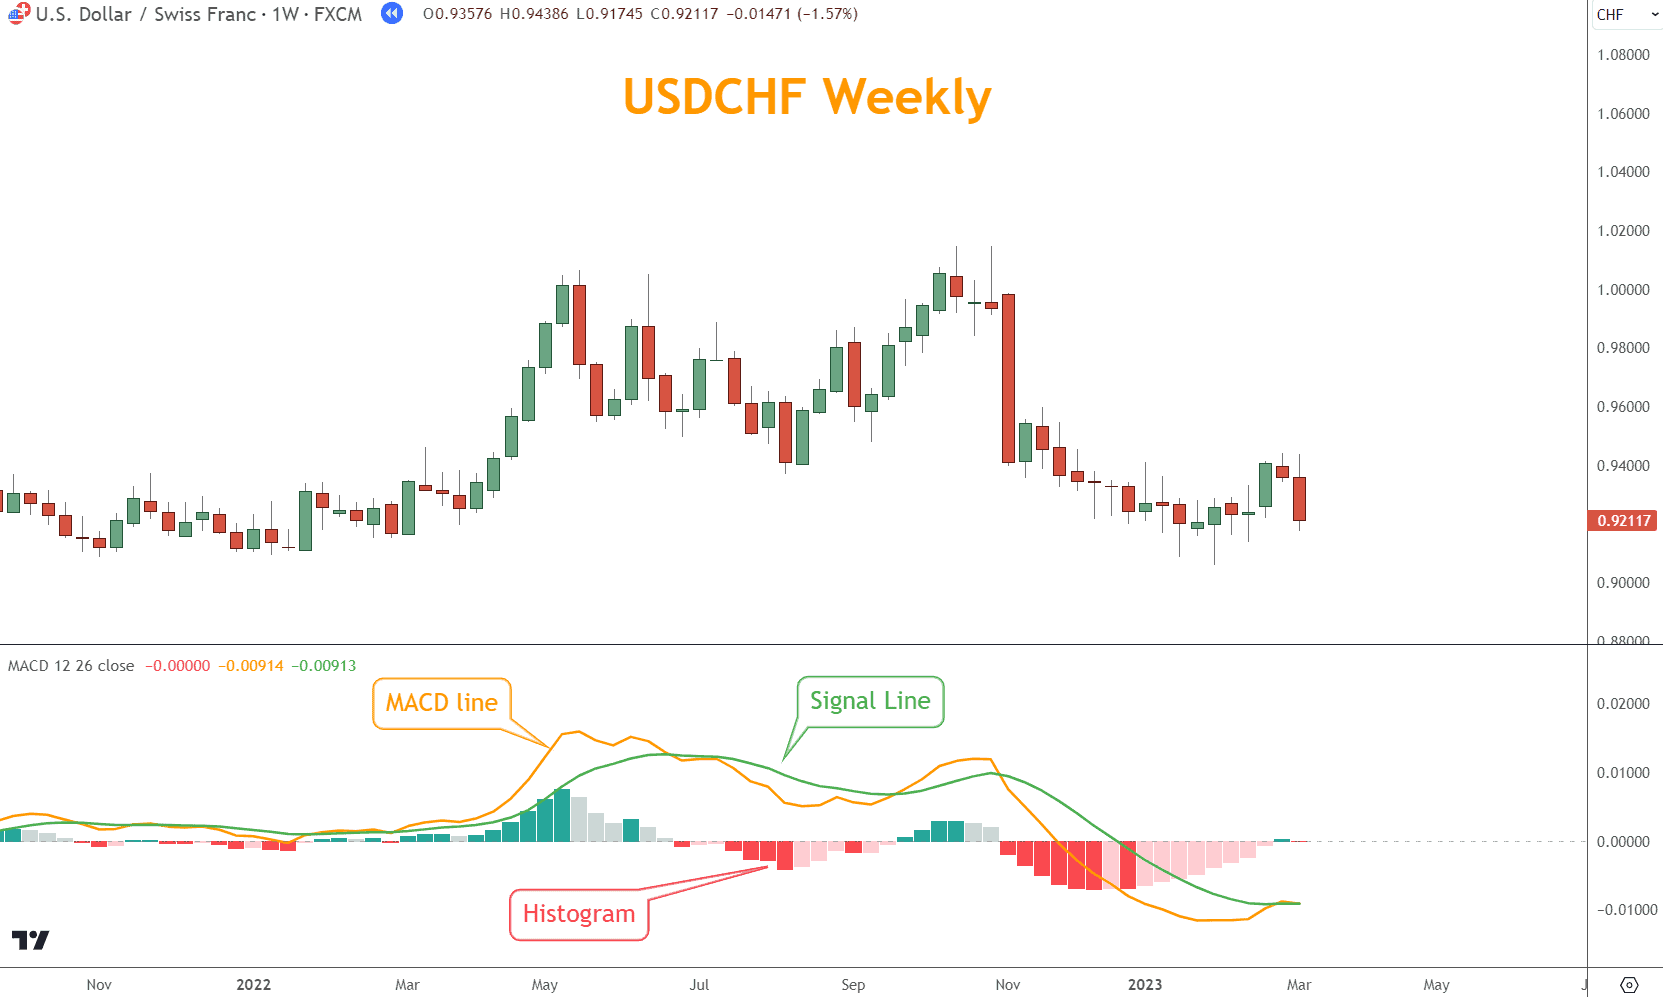
What Is the MACD Indicator?
The MACD, developed by Gerald Appel in the late 1970s, is a momentum and trend-following indicator.
It is composed of:
A MACD line: the difference between the 12-period and 26-period EMAs
A signal line: a 9-period EMA of the MACD line
A histogram: the visual difference between the MACD line and signal line
The MACD line oscillates above and below a zero line. When the MACD line crosses the signal line, it generates a buy or sell signal.
However, as it’s based on moving averages, MACD is a lagging indicator. This means signals often appear after price movement has already started.
Why Use the Default 12, 26, and 9 Settings?
Most platforms use 12- and 26-period EMAs for the MACD, with a 9-period EMA for the signal line.
These values are based more on tradition than logic, particularly the “26 working days” theory, which is questionable since there was no six-day trading week even when the MACD was created.
While you can adjust the settings to suit your strategy or timeframe better, this guide uses the default values to remain consistent with standard usage.
Advantages of the MACD
The MACD is favored for several reasons:
It provides a clear visual of trend strength and direction
The crossover and zero-line signals are easy to interpret
It highlights divergence between price and momentum, which can indicate reversals
Disadvantages of the MACD
Despite its popularity, MACD has notable limitations:
Lagging nature leads to late entries and exits
False signals are common in choppy or sideways markets
Divergence setups often fail without additional confirmation tools
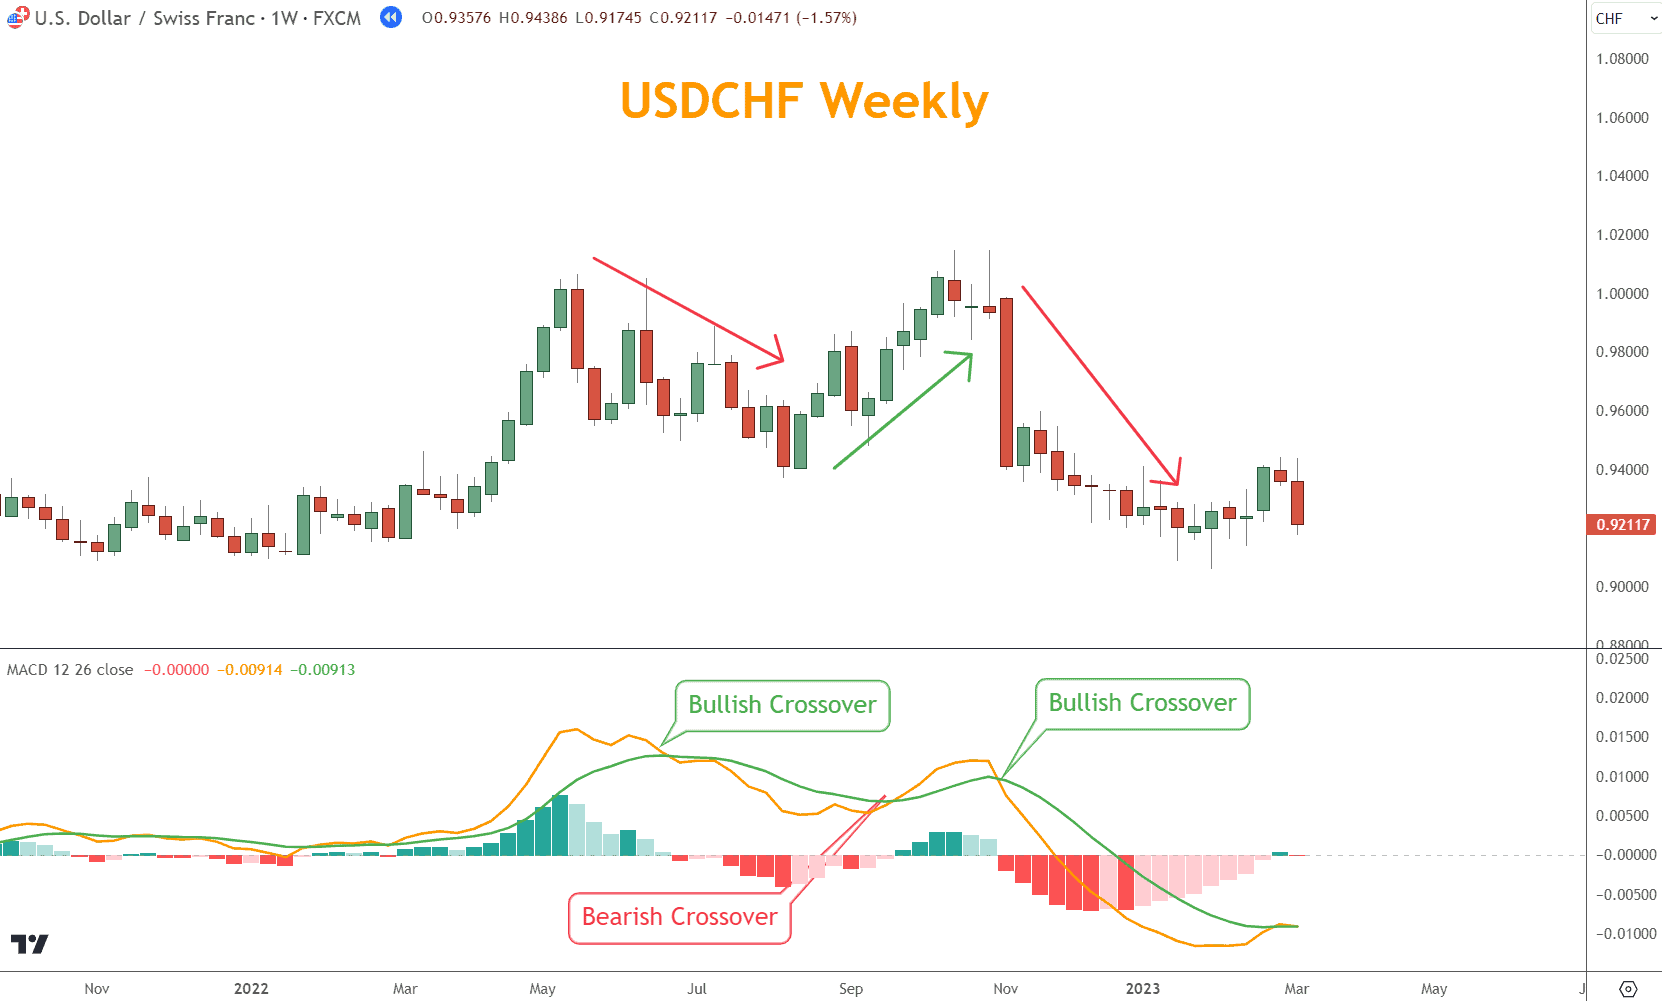
Strategy #1: MACD Crossover Strategy
The crossover strategy is the most commonly used MACD method. It occurs when:
The MACD line crosses above the signal line → Bullish signal
The MACD line crosses below the signal line → Bearish signal
Traders often enhance this strategy by checking the MACD histogram, which goes to zero when the lines cross.
Some use a filter where:
Bullish cross is valid only if above the zero line
Bearish cross is valid only if below the zero line
When It Works:
This strategy performs well in strongly trending markets.
When It Fails:
In sideways or consolidating markets, it gives late or false signals, resulting in losses.
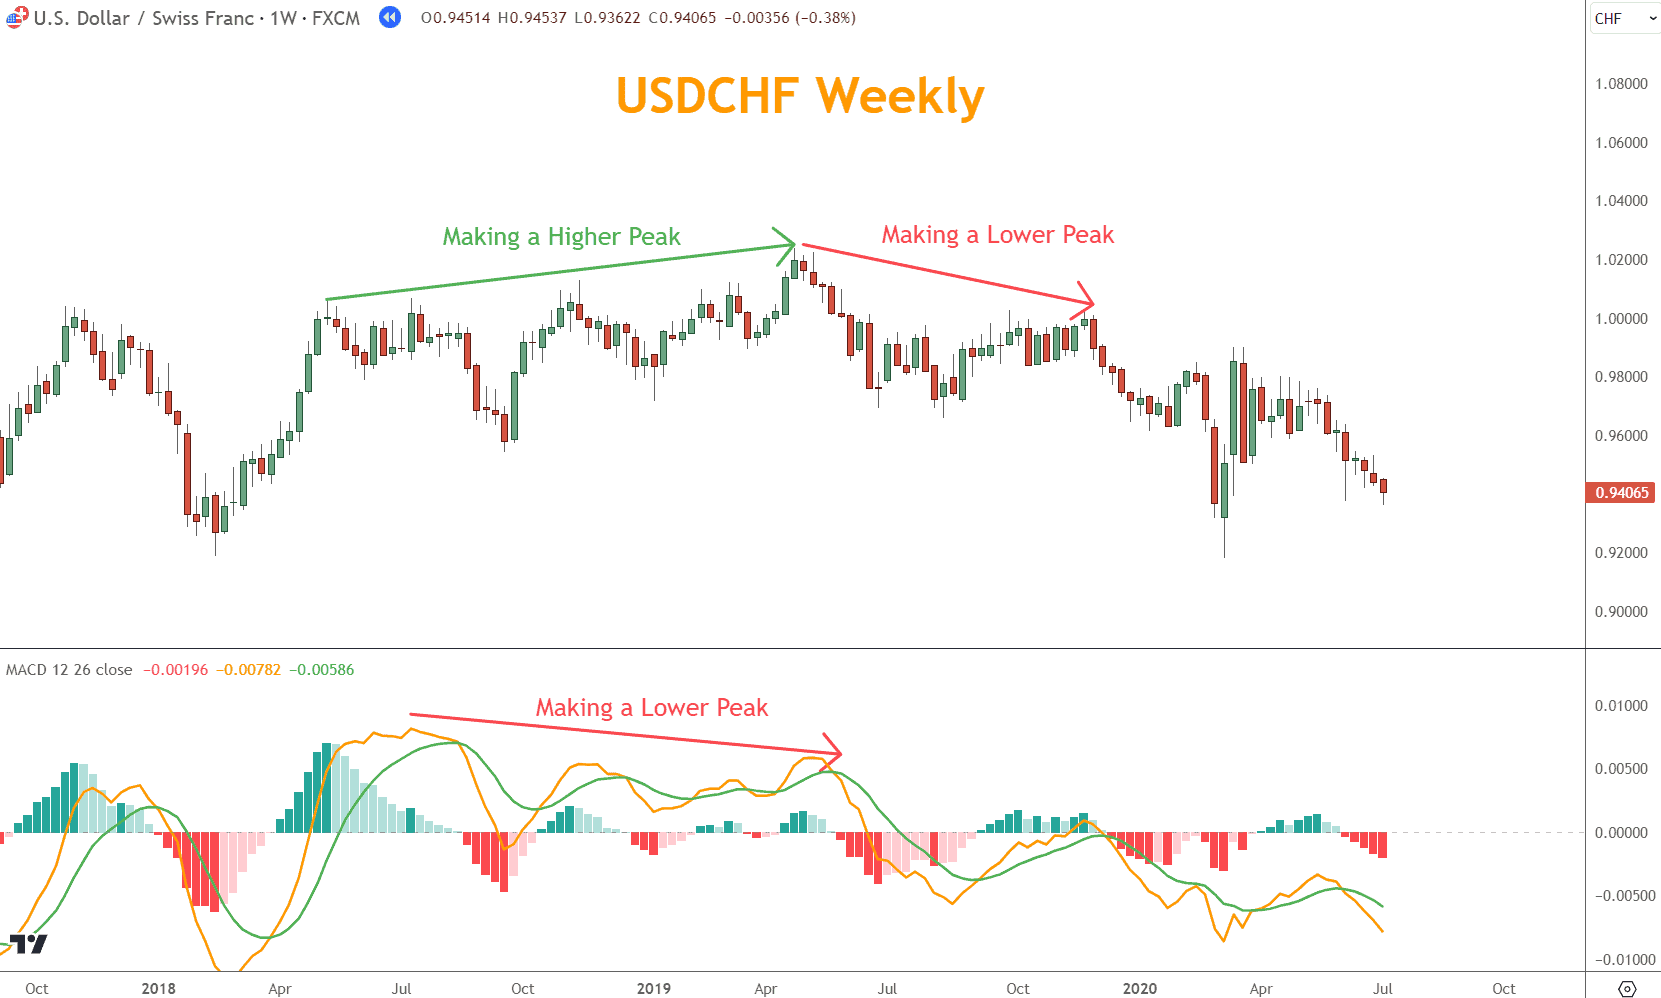
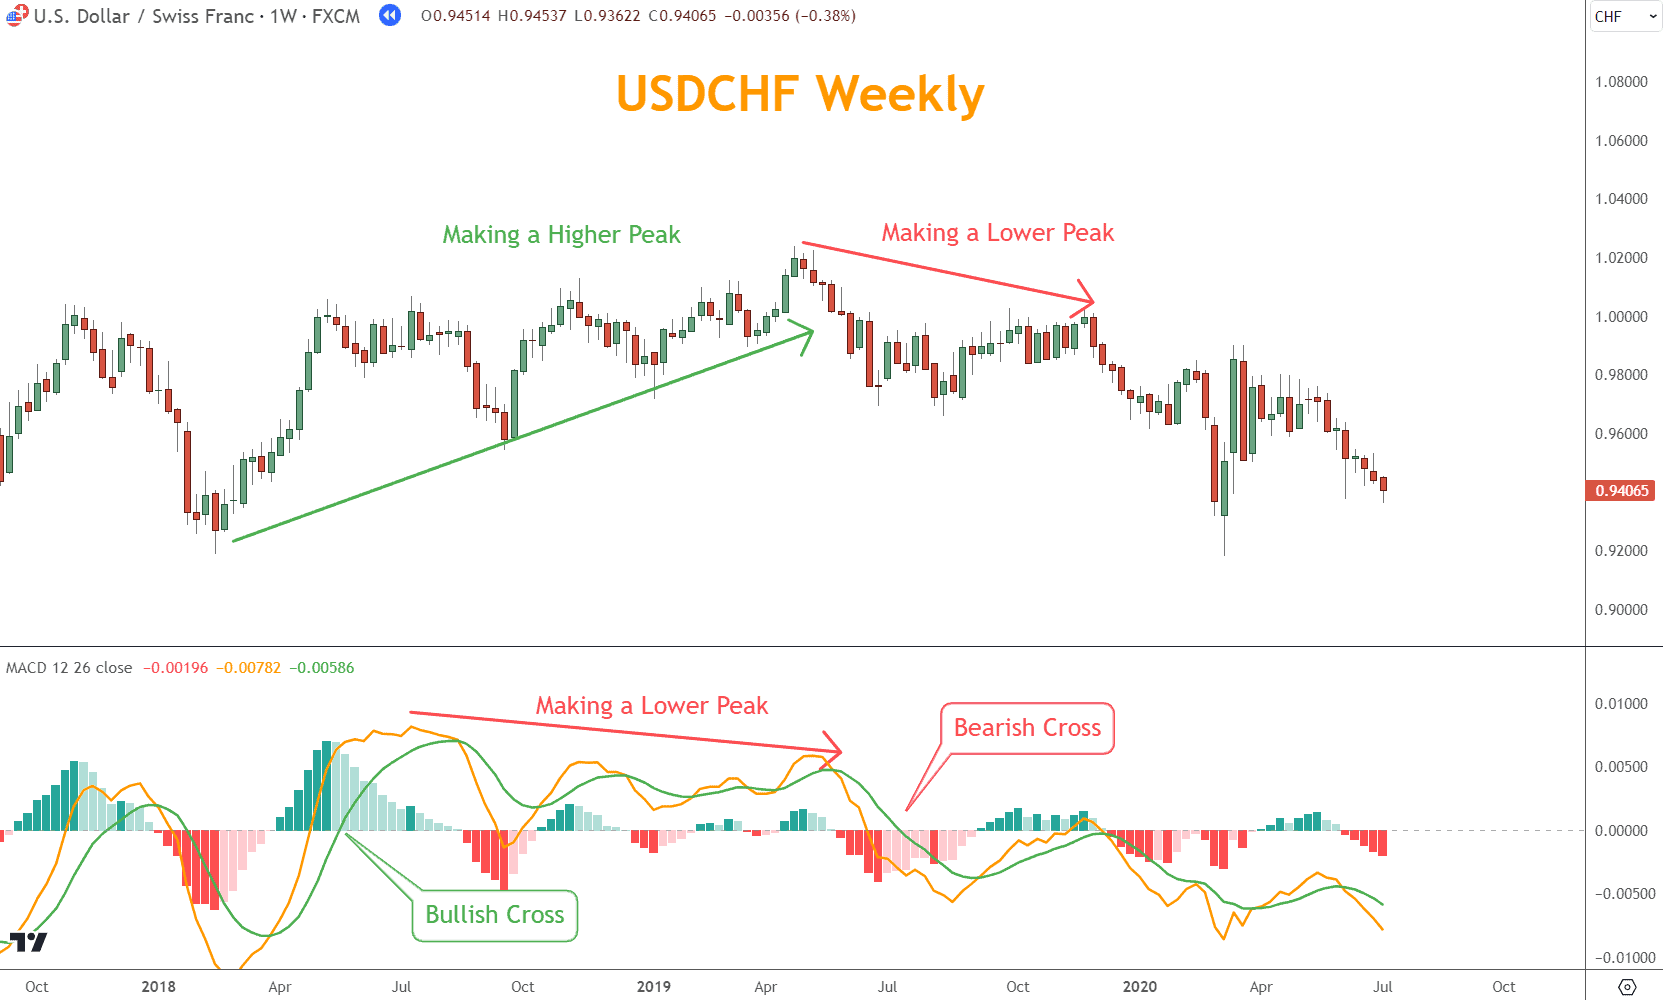
Strategy #2: MACD Divergence Strategy
MACD divergence occurs when:
Price moves in one direction (e.g., higher highs)
MACD moves in the opposite direction (e.g., lower highs)
This implies that price momentum is fading, potentially signaling a reversal.
Example:
In a 2018–2019 USD/CHF chart:
Price made higher highs
MACD formed lower highs
The result: a selloff
The Problem:
Divergence doesn’t always produce results. While it can offer early warning signs, it needs confirmation from price action or other tools to be reliable.
Looking for a Strategy?
Download the Six Basics of Chart Analysis and sign up for Forex Forecast to learn a bottom-up approach to analyzing Forex markets and weekly market updates.
Strategy #3: Zero-Cross Strategy
The zero-cross occurs when the MACD line crosses the zero line:
Above zero = bullish trend
Below zero = bearish trend
This is interpreted as a confirmation of a trend shift rather than an entry trigger alone.
The histogram provides strength cues—the longer the bars, the stronger the momentum.
Limitation:
Zero-cross signals often arrive late, after the price has already moved significantly.
Combining MACD with RSI
One way to overcome MACD’s lagging nature is to pair it with the Relative Strength Index (RSI).
The RSI is a leading momentum indicator and offers entry signals when:
RSI crosses above 50 → bullish momentum
RSI crosses below 50 → bearish momentum
RSI reaches 30 (oversold) or 70 (overbought) → reversal zones
This combo is particularly effective when:
MACD identifies trend direction
RSI confirms momentum or signals exhaustion
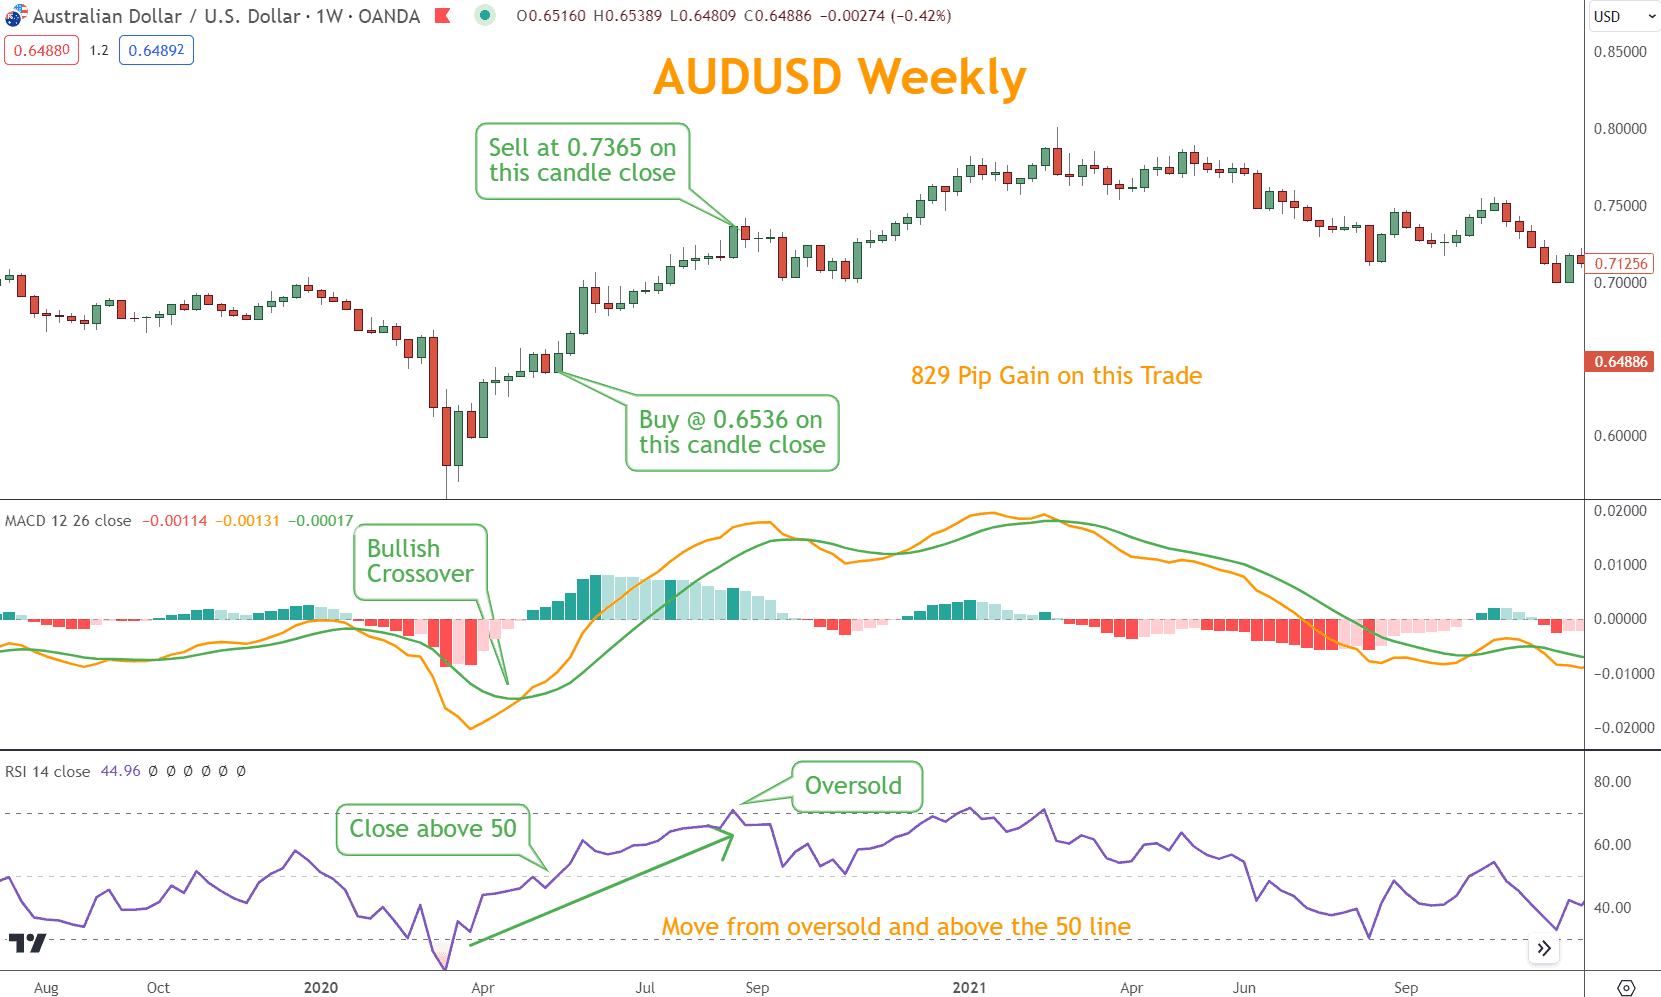
MACD + RSI Strategy in Action
Let’s look at two examples using this combined approach.
AUD/USD Trade – A Textbook Example
April 27, 2020: MACD bullish crossover
May 18, 2020: RSI crosses above 50 from oversold
Result: 829 pip gain as AUD/USD rallies
Exit: RSI re-enters oversold territory on August 24, 2020
This is a strong trade, with both indicators aligning perfectly for entry and exit.
USD/CHF Trade – A Weak Setup
September 19, 2019: MACD crossover and RSI crosses 50
However, price action lacks momentum
Result: A loss of 59 pips due to sideways price action
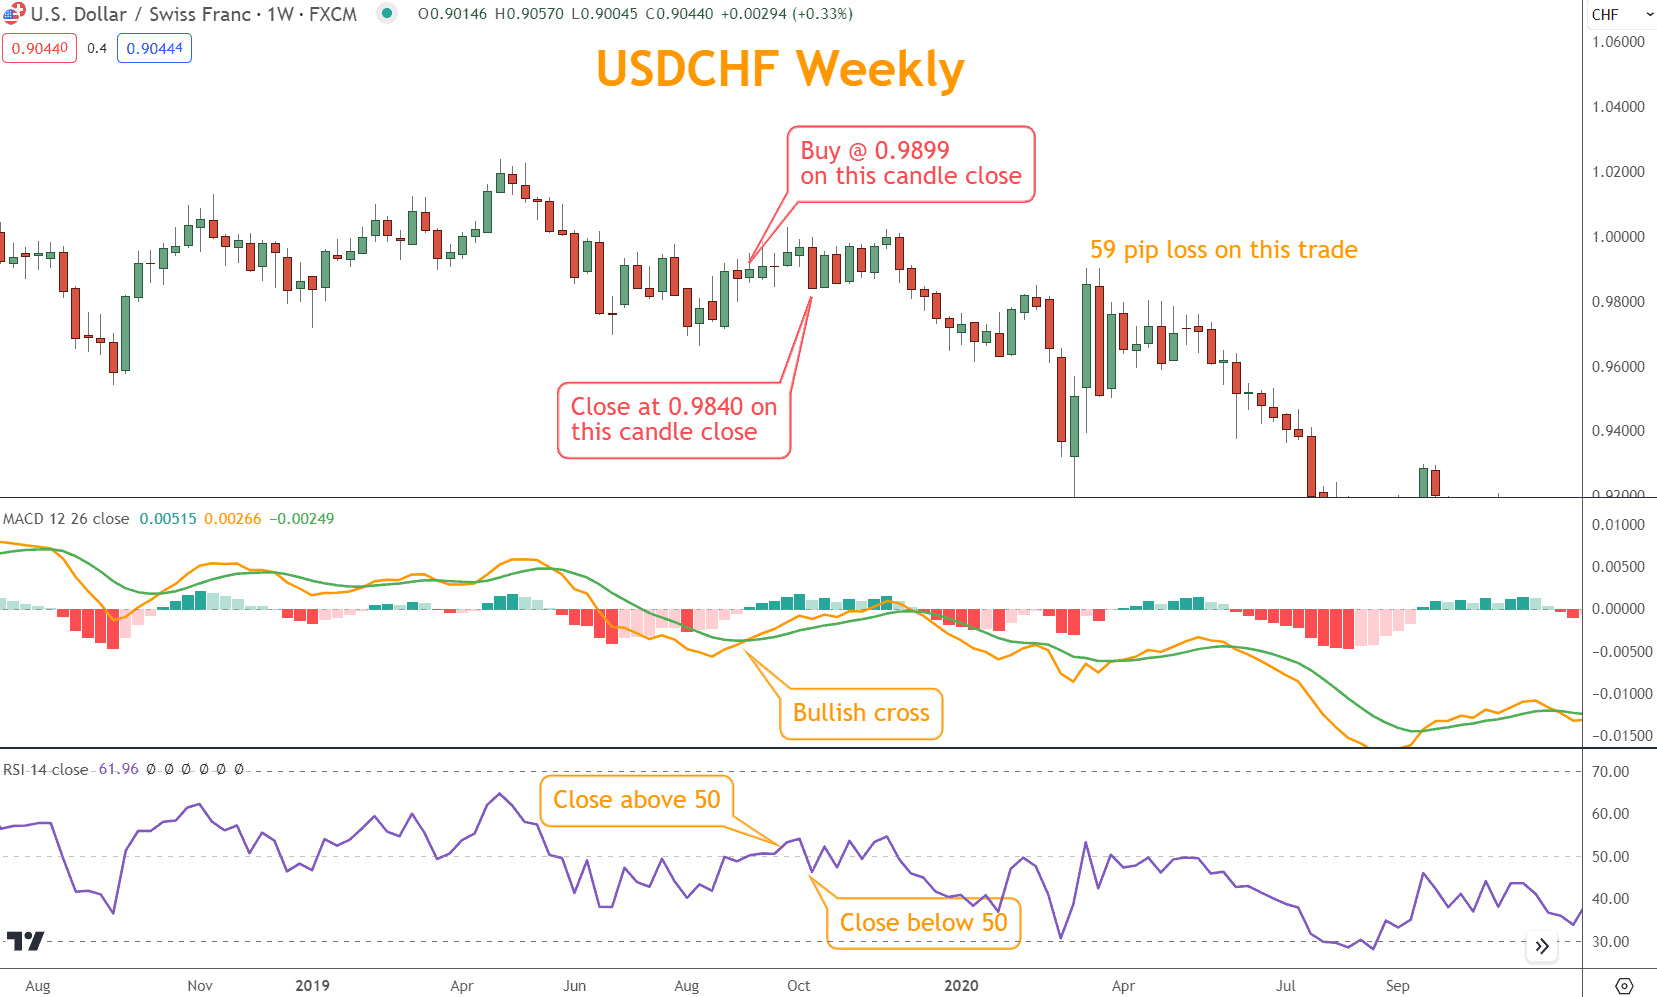
This shows that even rule-based setups can underperform in consolidating markets.
Neither MACD nor RSI handles sideways ranges well.
Should You Use Stricter Filters?
Some traders only take RSI signals from oversold or overbought levels, not just 50-line crosses.
The Tradeoff:
Fewer false signals
Fewer opportunities may leave you sitting out of the market too often
Like all strategies, there’s a balance between signal quality and signal frequency.
What Are Your Next Steps?
If you’re curious about using MACD in Forex:
Pick a favorite currency pair
Compare MACD alone and then MACD with RSI
Review trade quality during trends and consolidations
While MACD can be helpful, it’s not perfect. There may be better tools depending on your strategy and timeframe.
Looking for a platform? TradingView is a great place to start. You can use it for free or upgrade to a paid version (affiliate link).
Want to improve your chart reading? Download The Six Basics of Chart Analysis—free.
You’ll also get the Forex Forecast newsletter every Sunday with trade setups, case studies, and educational tools.

Frequently Asked Questions
Does Trading with MACD Work?
It can work, primarily when used with confirmation tools like RSI or price patterns. However, MACD signals often lag and can mislead during low-momentum periods.
What Is the MACD and How Is It Calculated?
MACD = 12-period EMA – 26-period EMA
Signal Line = 9-period EMA of the MACD
Histogram = MACD – Signal Line
A crossover of the MACD and signal line generates potential trade signals.
What Do the MACD Lines Indicate?
They reflect momentum and trend direction:
MACD line above signal = bullish
MACD line below signal = bearish
Divergence = potential trend reversal
How Can Traders Use the MACD Histogram?
The histogram shows the difference between the MACD and signal line:
Positive histogram = bullish momentum
Negative histogram = bearish momentum
Divergence between histogram and price = early reversal warning
What’s the Next Step?
Apply the MACD strategies:
Try all 3: Crossover, Divergence, and Zero-Cross
Combine MACD with RSI for stronger entries and exits
Use TradingView for analysis
Download the Six Basics of Chart Analysis
Subscribe to the Forex Forecast for weekly trading insights
Forex Trading Disclosure Statement
Risk Warning:
Forex trading involves significant risk and may not be suitable for all investors. The leveraged nature of Forex trading can work both for and against you, leading to substantial gains or losses. Before trading Forex, you should carefully consider your financial objectives, experience level, and risk tolerance. It is possible to lose more than your initial investment, and you should only trade with money you can afford to lose.
Market Risks and Volatility:
Forex markets are influenced by global economic, political, and social events, which can result in unpredictable price movements. High market volatility can lead to sudden and substantial changes in currency values, potentially causing losses that exceed your initial deposit.
Leverage Risks:
Leverage amplifies both potential gains and potential losses. While leverage can increase profitability, it also increases the risk of significant losses, including the loss of your entire trading capital.
Trading Tools and Technology Risks:
Forex trading platforms, including those offered by brokers, are subject to technology risks, such as system failures, latency issues, and potential errors in price feeds. Traders should be aware that these risks can impact the execution of trades and trading outcomes.
No Guarantee of Profitability:
Past performance in Forex trading is not indicative of future results. There is no guarantee that you will achieve profits or avoid losses when trading Forex. Market conditions and individual trading strategies vary, and no trading system can eliminate the inherent risks of Forex trading.
Educational Purposes Only:
Any information provided about Forex trading, including strategies, analysis, or market commentary, is for educational purposes only and should not be considered financial advice. Consult a qualified financial advisor or tax professional before making any trading decisions.
Regulatory Compliance:
Forex trading is regulated differently in various jurisdictions. Ensure that you are trading with a licensed and compliant broker in your country of residence.
Responsibility:
You are solely responsible for your trading decisions and the associated risks. You must understand the terms and conditions of Forex trading, including margin requirements, stop-losses, and other risk management tools.
Acknowledgment:
By engaging in Forex trading, you acknowledge that you have read, understood, and accepted this disclosure statement. You assume full responsibility for the outcomes of your trading decisions and agree to trade at your own risk.