
Understanding Swing Highs and Swing Lows gives you an edge that most traders never develop: the ability to interpret market structure with clarity.
When you can read structure, you immediately understand direction, where reversals occur, where retracements form, and where the highest-probability opportunities exist.
This technique has nothing to do with “swing trading” over several days. Instead, it’s about learning how price moves—and how to identify peaks and troughs that reveal the actual market environment.
Below you’ll learn the three essential rules for trading Swing Highs and Swing Lows, how to combine them with technical tools, and how to turn market structure into a repeatable trading method.
TL;DR (Too Long; Didn’t Read)
- Swing Highs and Swing Lows define market structure, direction, and retracement opportunities.
- Higher Highs + Higher Lows = Rally; Lower Highs + Lower Lows = Selloff; no pattern = Neutral.
- Combine swings with Candlesticks, Momentum, and Chart Patterns for confirmation.
- Use swing points for natural Stop and Target placement.
- Retracements aligned with swing structure provide the highest-probability trade setups.
Quick Reference Table — Swing Highs & Swing Lows at a Glance
| Concept | Meaning | What It Tells You | How to Use It |
| Swing High | Local peak before price reverses lower | Selling pressure at that level | Short entries, resistance, stop placement |
| Swing Low | Local trough before price reverses higher | Buying pressure at that level | Long entries, support, stop placement |
| Higher High / Higher Low | Bullish structure | Rally | Look for long retracements |
| Lower High / Lower Low | Bearish structure | Selloff | Look for short retracements |
| Neutral Structure | No clear pattern | Sideways | Ranging trades (higher risk) |
| Indicator Confirmation | Candlesticks, Momentum, Chart Patterns | Confirms the strength of swings | Improves entry/exit probability |
Table of Contents
- TL;DR (Too Long; Didn’t Read)
- Quick Reference Table — Swing Highs & Swing Lows at a Glance
- What Are Swing Highs and Swing Lows?
- What Are Swing Points?
- How Swing Points Identify Market Direction
- How Swing Points Improve Risk Management
- How to Trade Swing Lows
- How to Trade Swing Highs
- Swing Points Are Technical Analysis Too
- Using Candlestick Patterns with Swing Points
- Using Chart Patterns with Swing Points
- Using Momentum Indicators to Confirm Swing Points
- What Are Retracements?
- What’s the Next Step?
- Frequently Asked Questions
- 5-Question Quiz
- Answer Key
- Conclusion
- Forex Trading Disclosure Statement
What Are Swing Highs and Swing Lows?
Swing Highs and Swing Lows are price turning points that map market structure:
- Swing High: A local peak before price reverses downward
- Swing Low: A local trough before price reverses upward
In this article, we will cover the basics of identifying peaks and troughs with three simple rules:
- Have a system for determining peaks and troughs
2. Determine the Forex pair’s direction before opening a trade. Is there a defined trend?
3. Find complementary indicators before opening a trade.
Additionally, we will discuss how to use technical indicators and techniques to discover trading opportunities, including retracements.
By the end of this article, you will better understand how to trade this technique and increase your chances of success in the market.
These swings help you see:
- Where the market is heading
- Where reversals previously occurred
- Where retracements are likely to form next
When you combine swings with momentum, candlesticks, or chart patterns, you get a powerful method to identify high-probability trades.
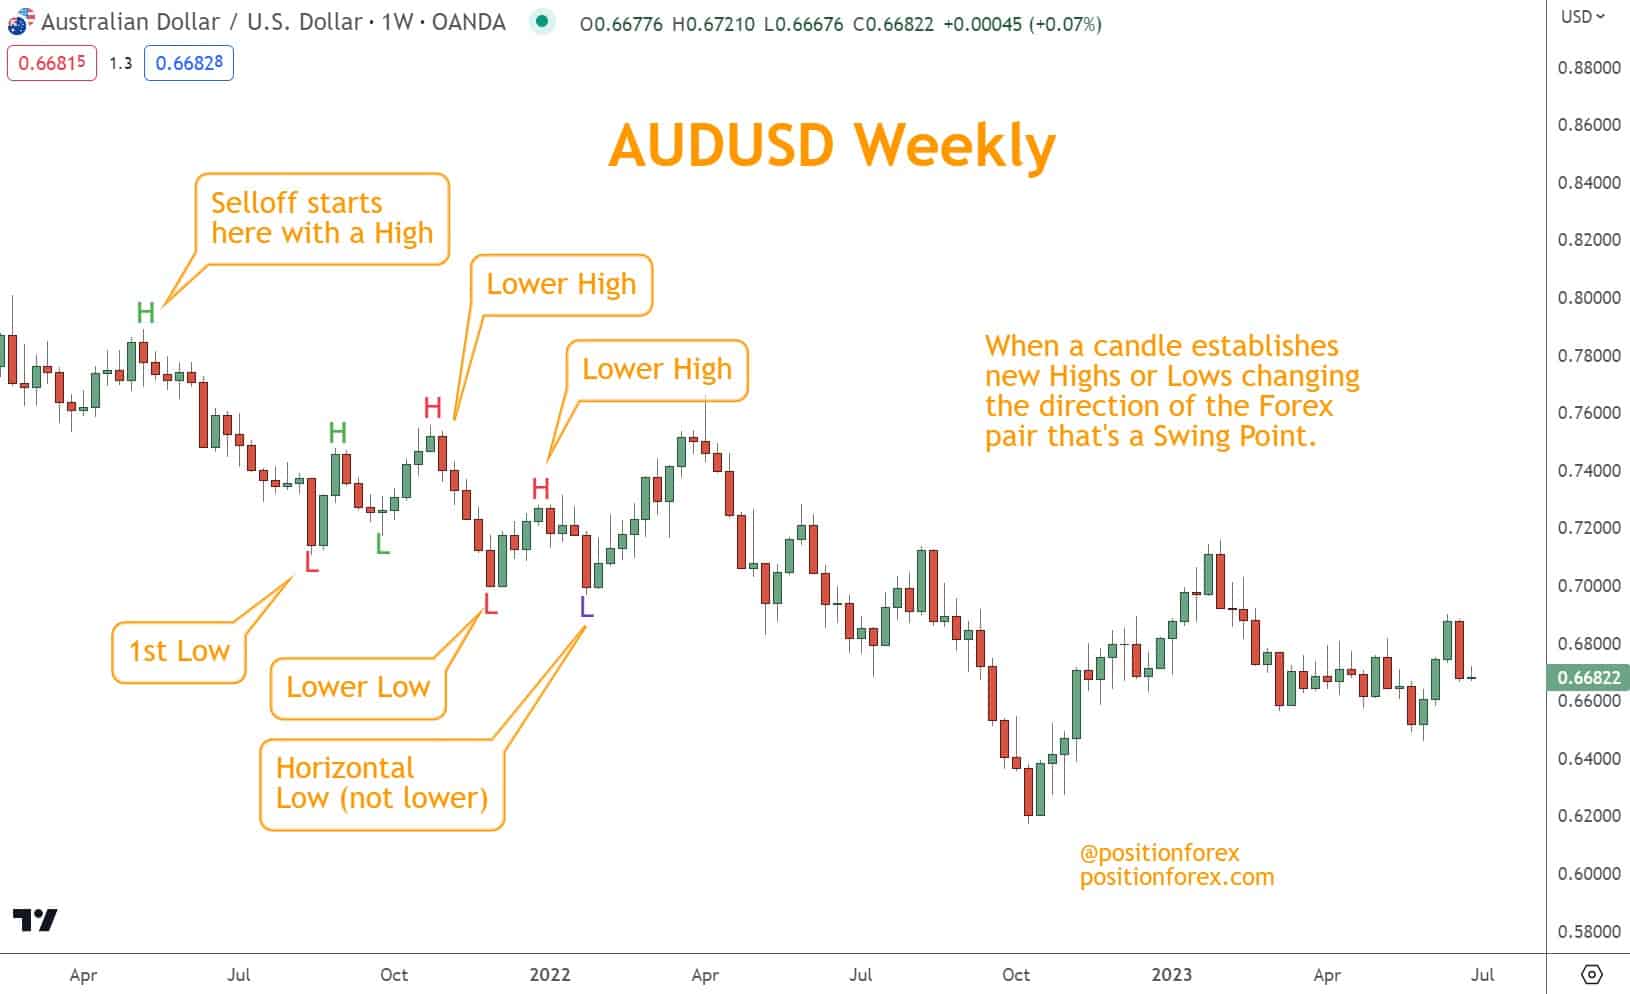
What Are Swing Points?
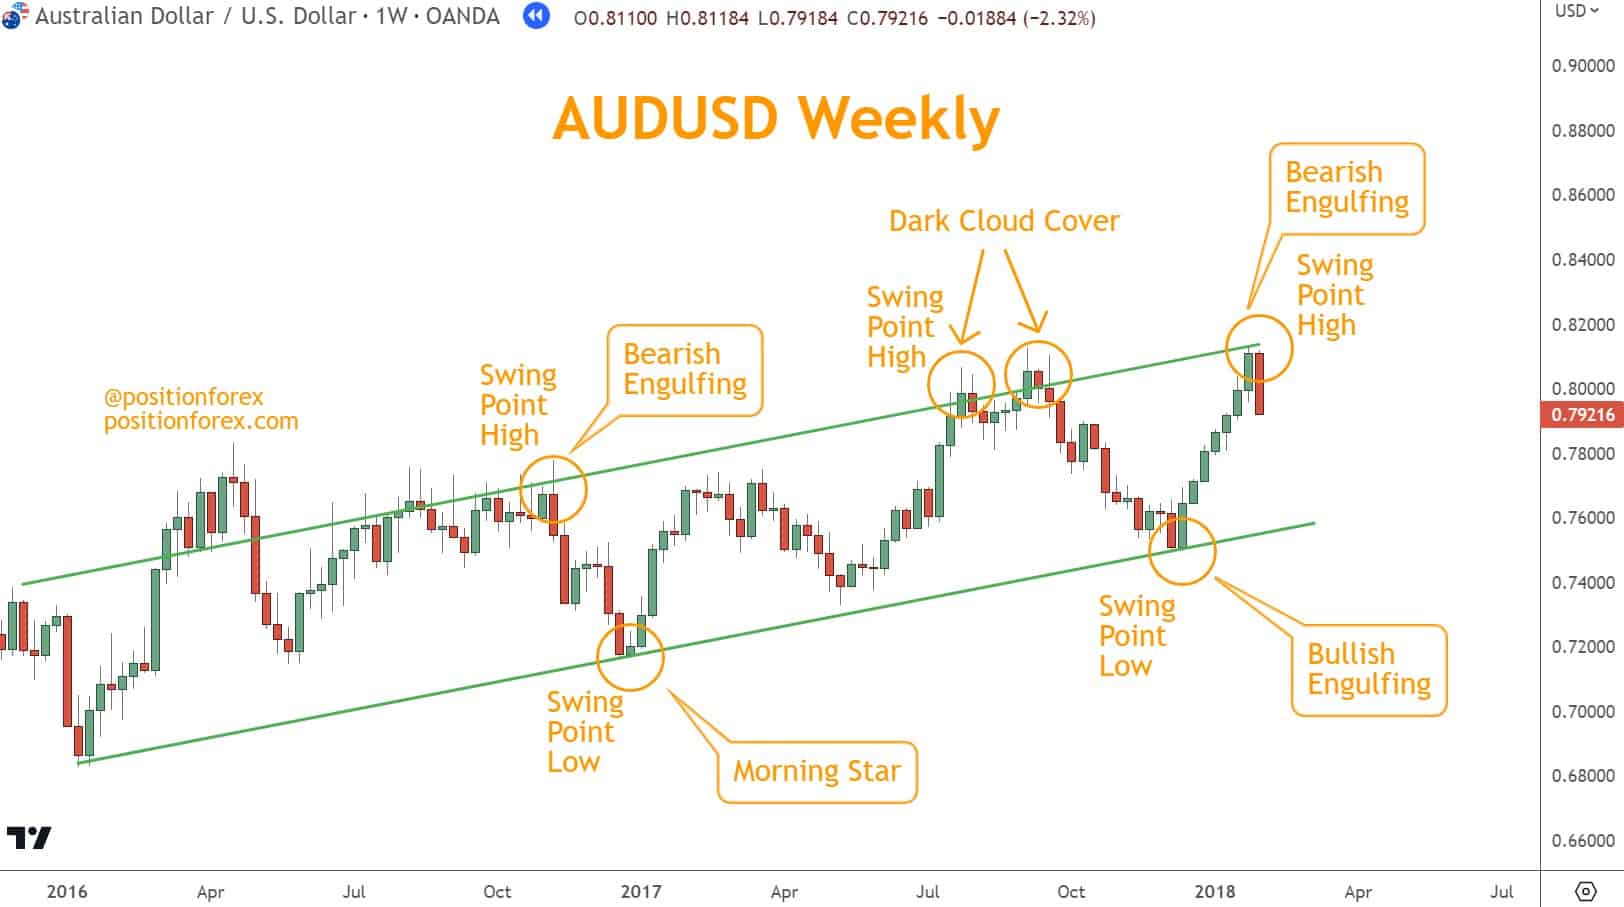
Swing Points are individual highs and lows that create the broader structure. Examine the following AUD/USD chart.
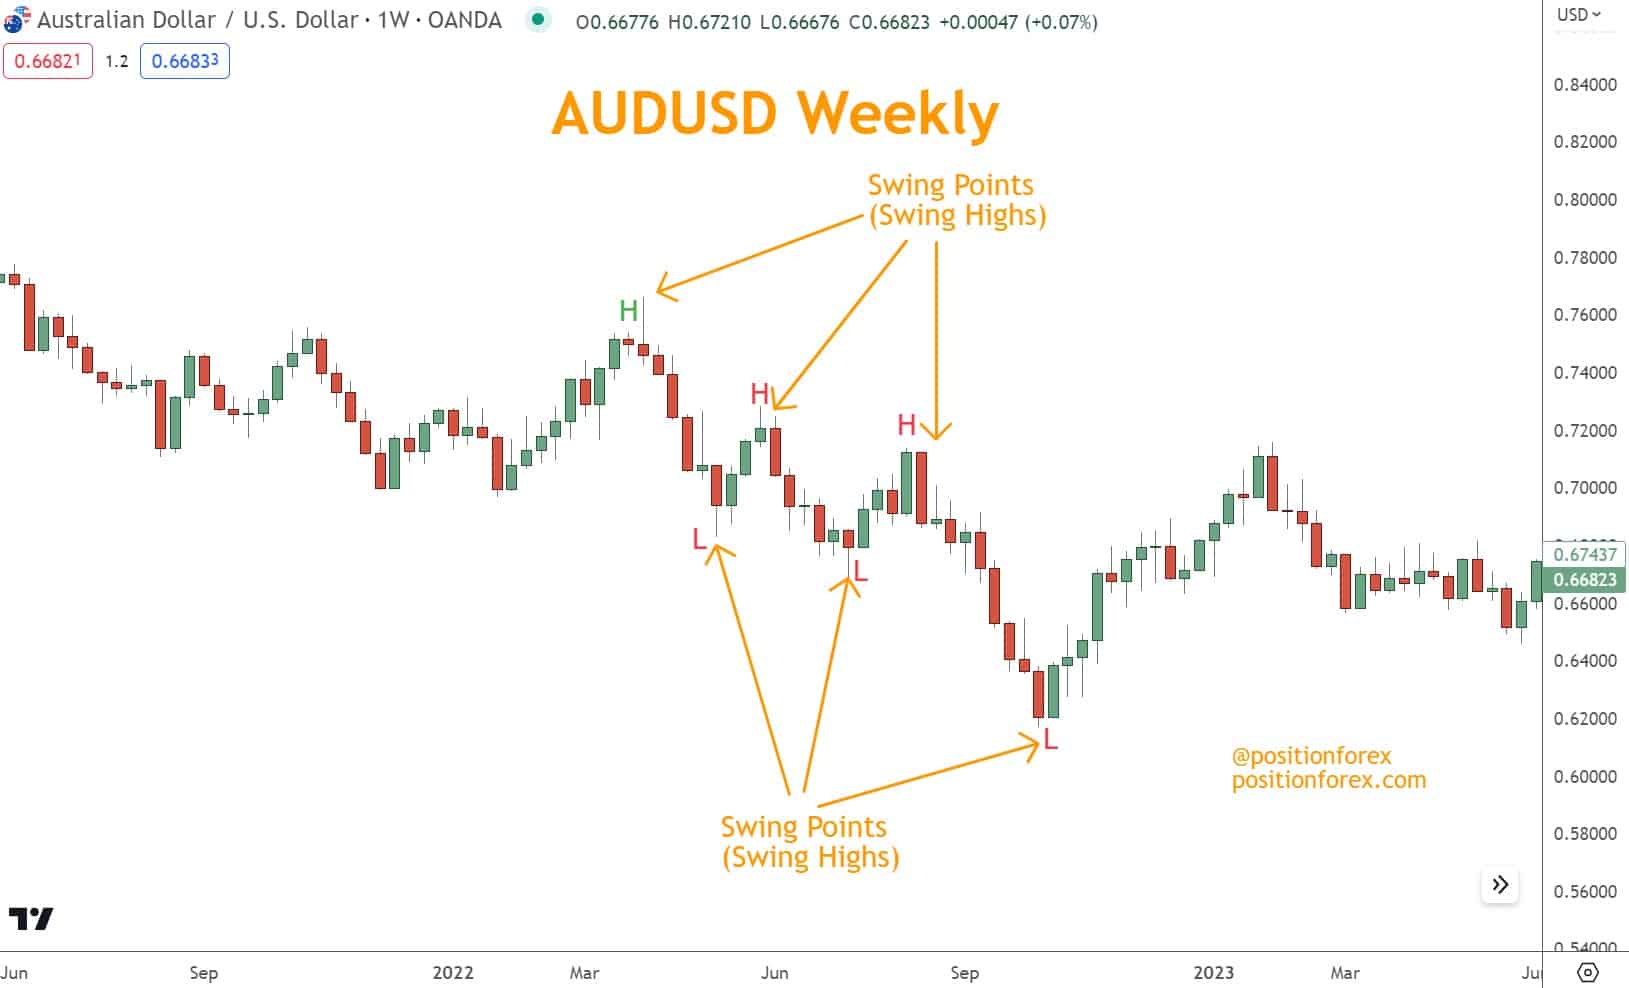
You can use them to:
- Identify the dominant direction
- Mark Support and Resistance
- Spot entry and exit levels
- Time retracements are more accurately
Swing Points are the foundation of market structure trading.
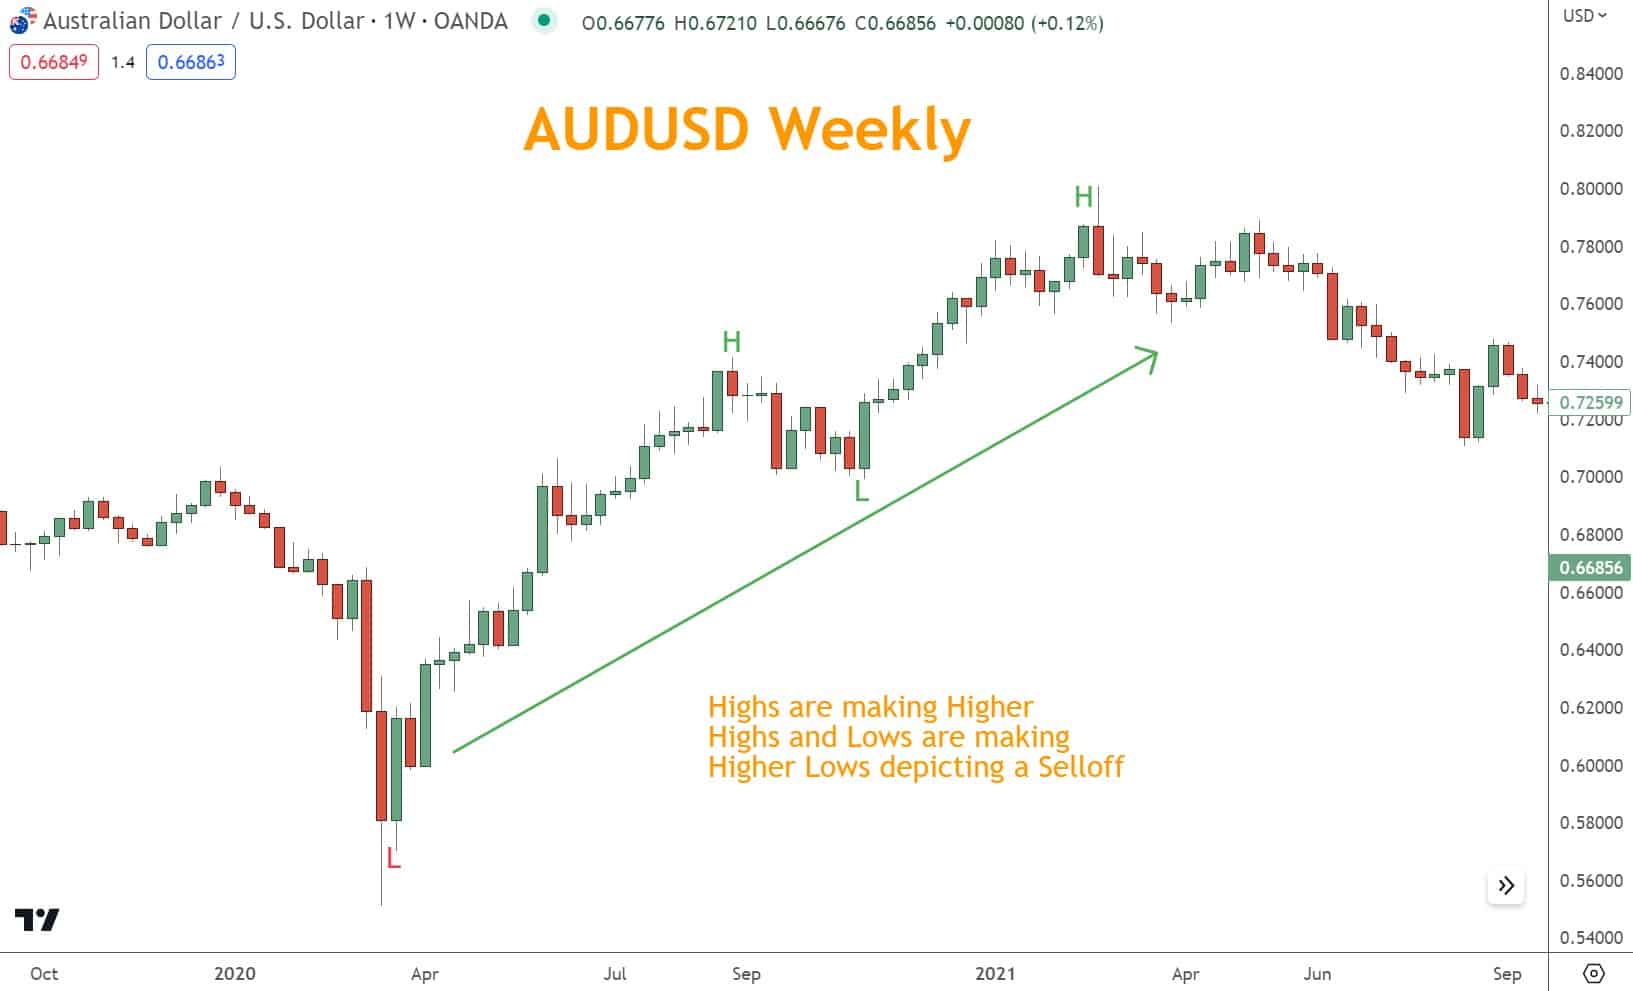
How Swing Points Identify Market Direction
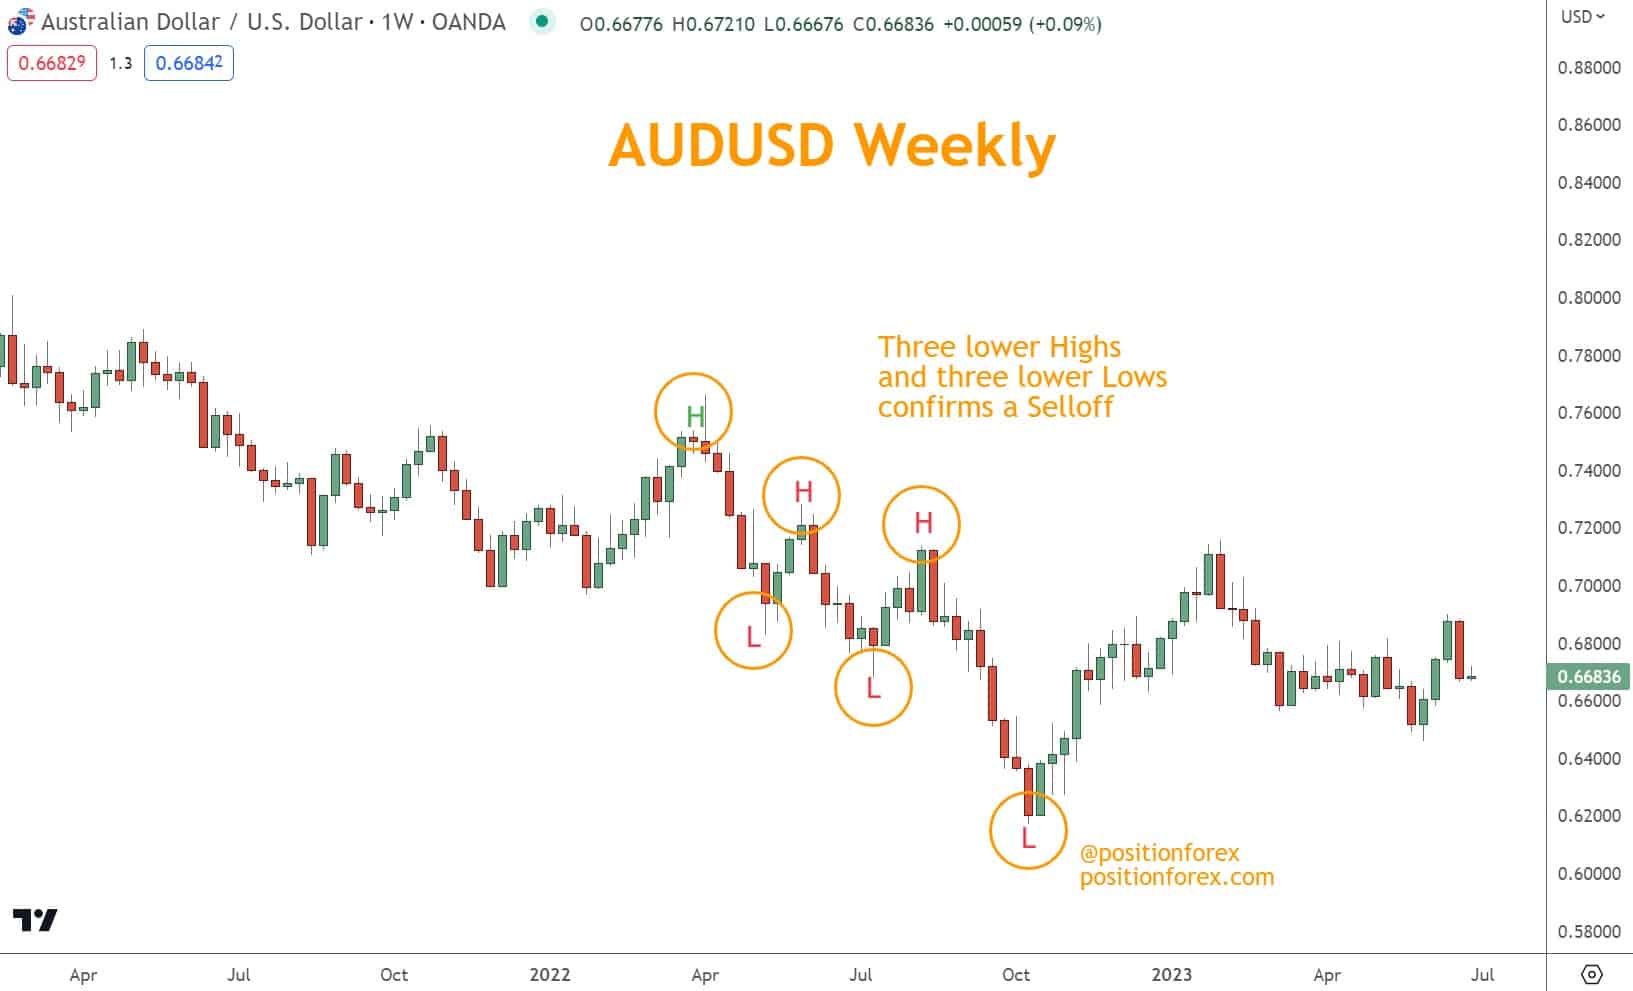
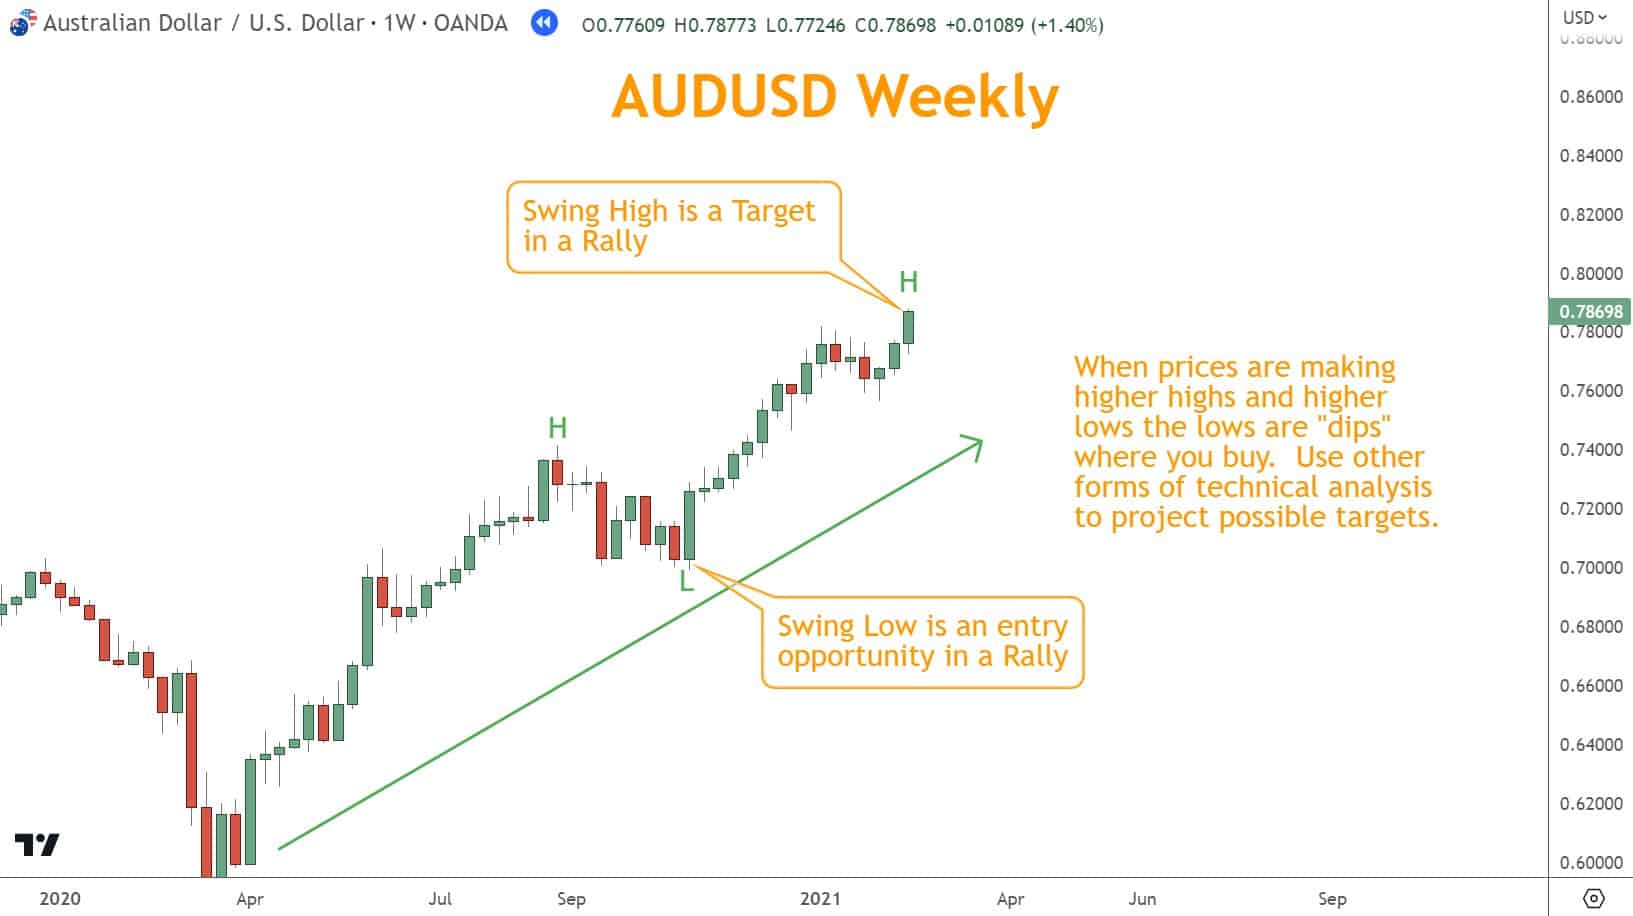
When highs are making higher highs and lows are making higher lows, this is considered a Rally, which is seen in the AUD/USD chart below.
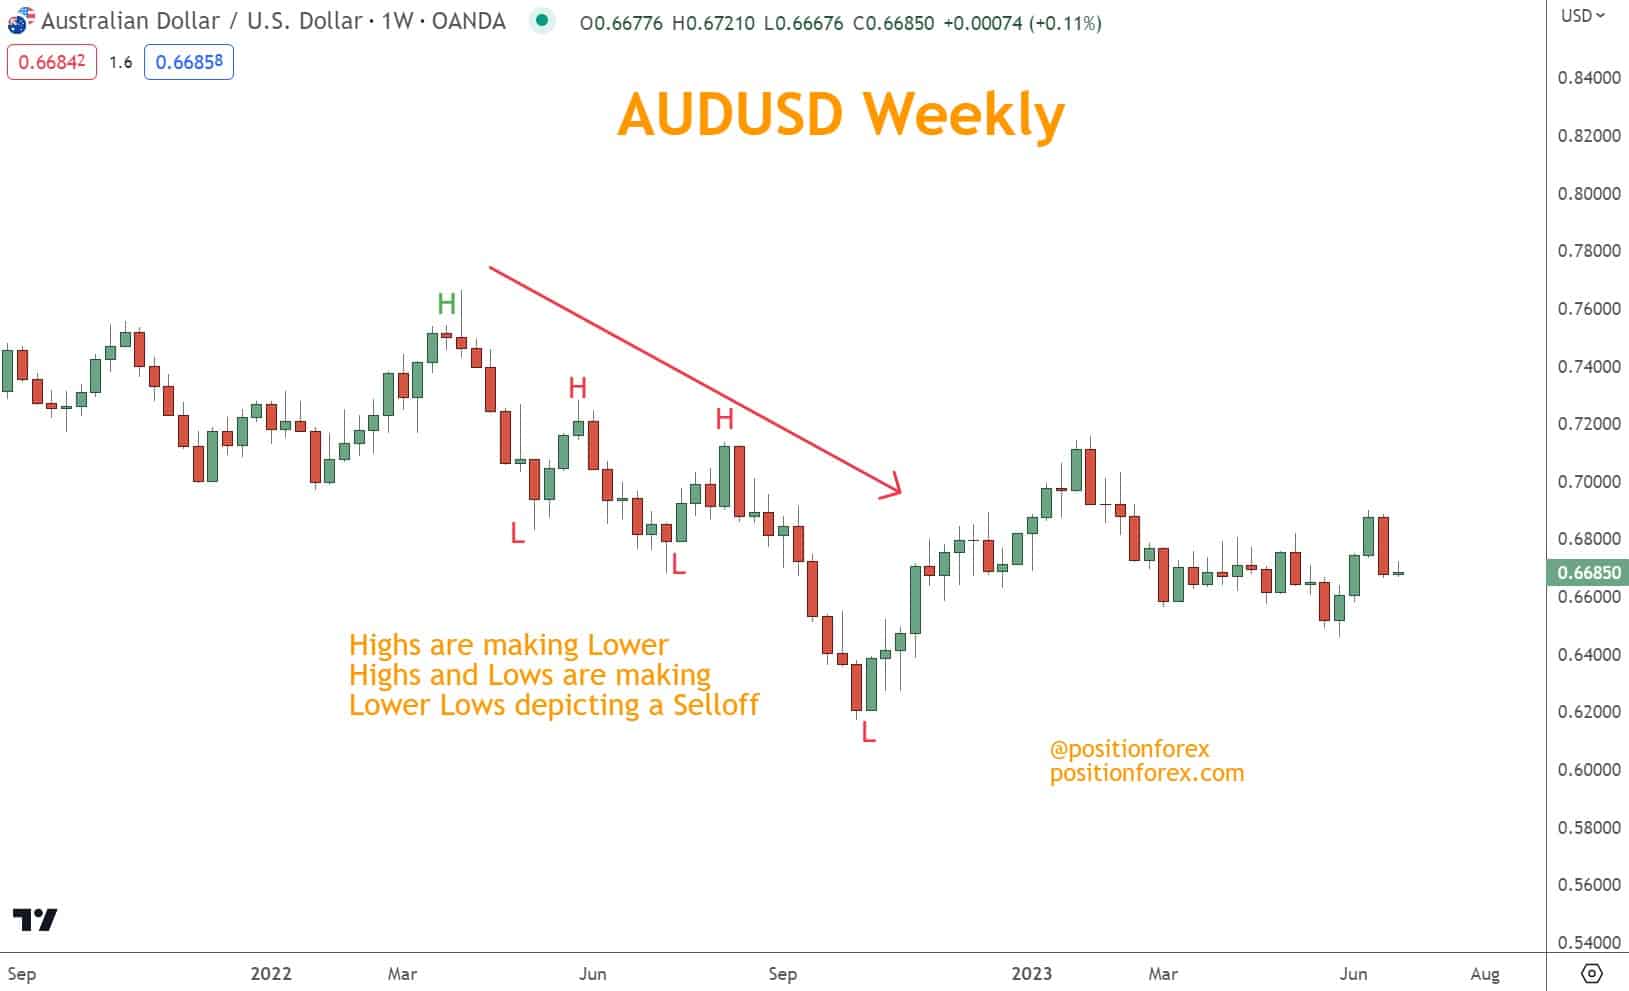
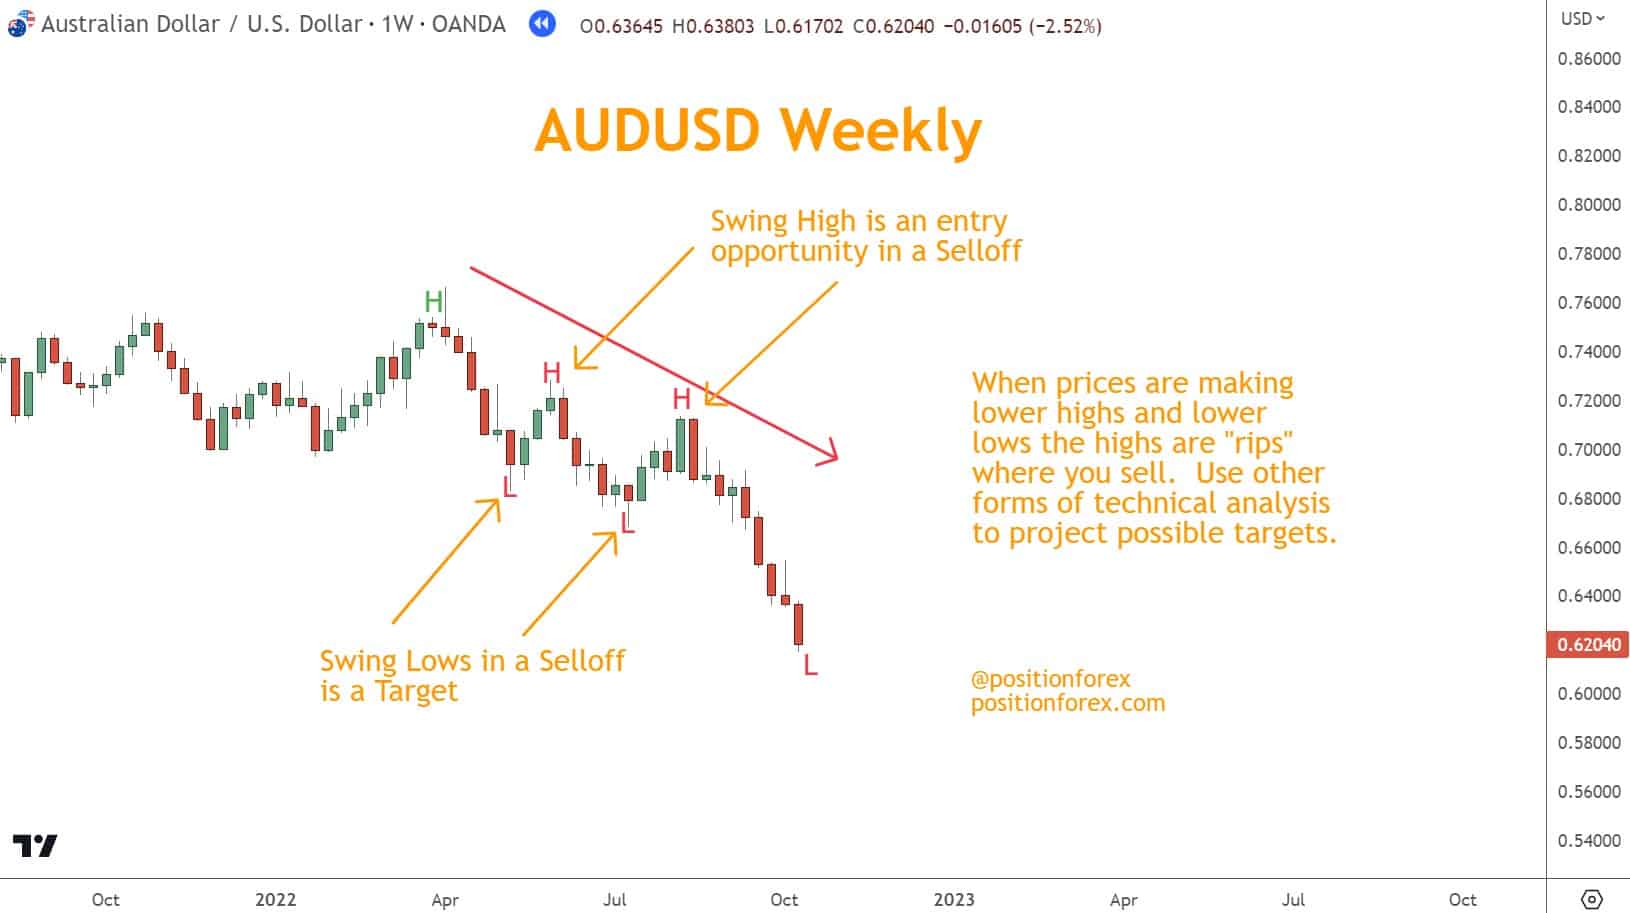
If highs are making new lows and lows are making new lows, this is a selloff, as in the AUD/USD chart below.
If there’s no pattern in the swings, the market is considered neutral (sometimes called ‘sideways’), as illustrated in the AUD/USD chart below.
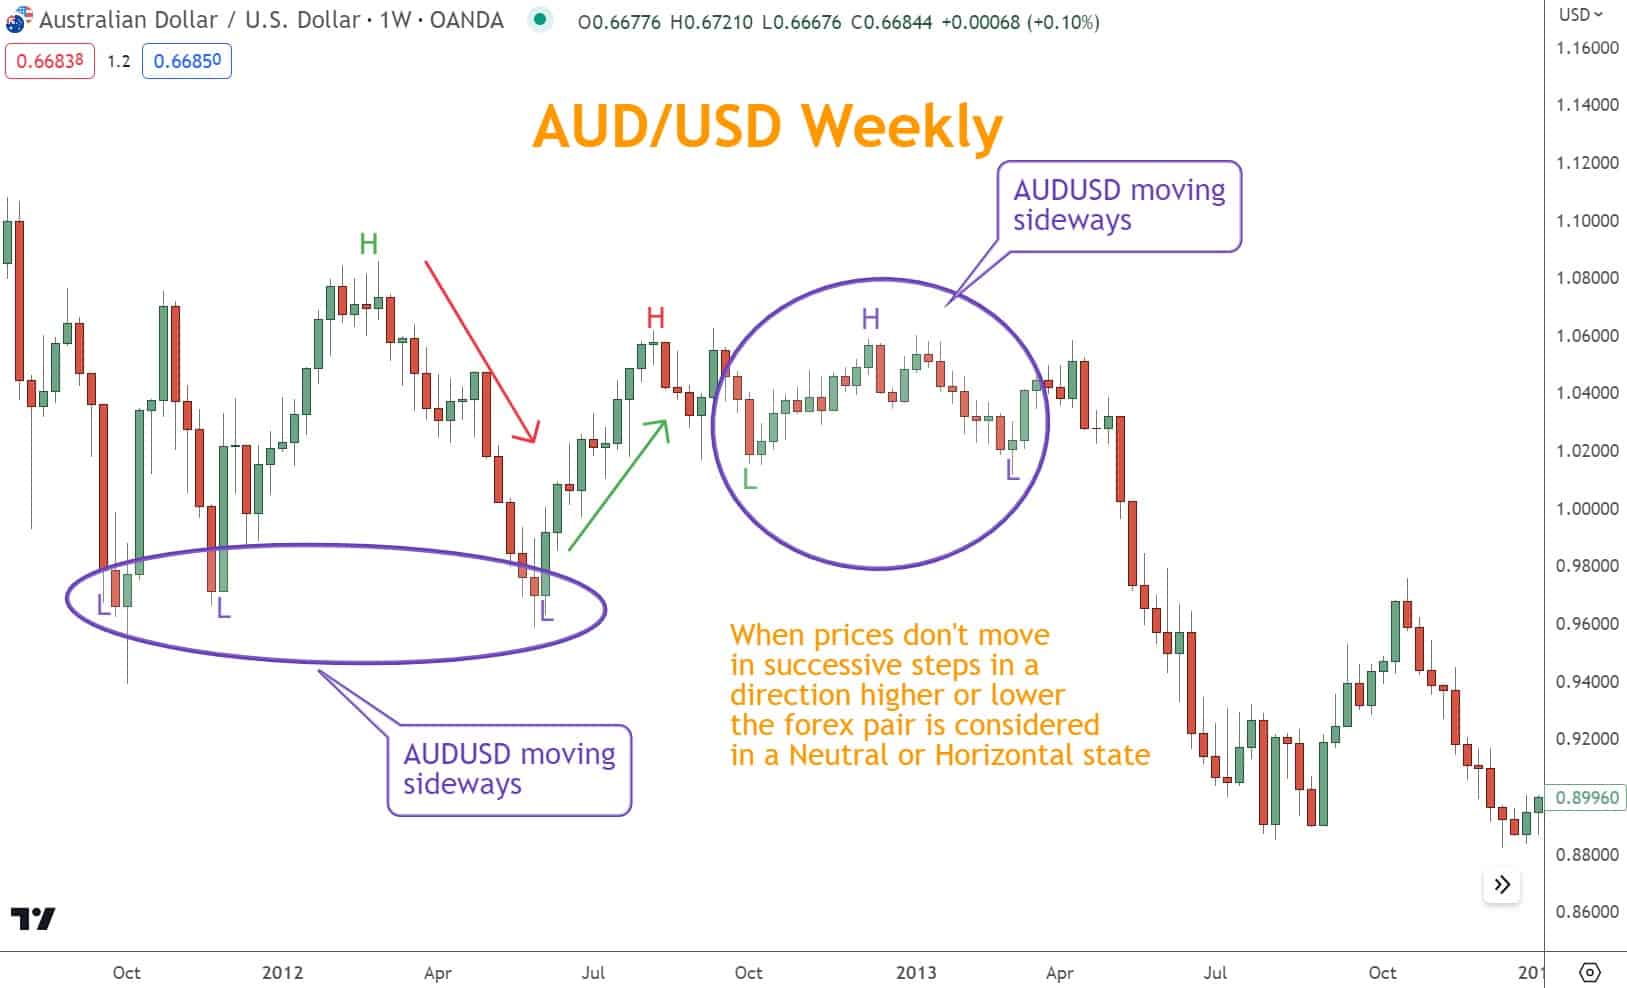
Swing Points are an excellent resource for defining a Rally, Selloff, or Neutral market.
Swing Structure Table
| Market Condition | Definition | Swing Characteristics | Behavior of Price |
|---|---|---|---|
| Rallying (Bullish) | Market moving upward | – Higher Highs (HH) – Higher Lows (HL) | Price climbs in a stair-step pattern |
| Selling Off (Bearish) | Market moving downward | – Lower Highs (LH) – Lower Lows (LL) | Price declines in a stair-step pattern |
| Neutral (Sideways) | No clear direction | – Swings do not form a consistent pattern | Price oscillates between Support & Resistance |
Direction is the cornerstone of trading decisions—swing structure gives it to you instantly.
How Swing Points Improve Risk Management
Swing Points align naturally with stops and targets:
- Long trades: Stop goes below the recent Swing Low
- Short trades: Stop goes above the recent Swing High
- Targets align with the upcoming structure or support/resistance zones
When combined with confirmation tools, swing-based stops and targets significantly improve consistency.
How to Trade Swing Lows
Swing Lows offer long opportunities in bullish or neutral conditions.
New lows will present entry opportunities on rallies if you want to trade with an instrument’s direction.
When a higher low forms, traders can enter long positions and set a stop loss below the recent low.
Profit targets can be set at the next high point or resistance level.
How to Trade Swing Lows: Table Overview
| Scenario | Meaning | Typical Trade Setup | Notes |
|---|---|---|---|
| 1. Higher Lows in a Rally | Buyers remain in control; price confirms a Rally | Entry: When price reverses upward Stop: Below the Swing Low Target: Next Swing High or Resistance | Ideal “with-trend” opportunity; high probability setup |
| 2. Swing Lows at Support | Multiple lows at the same level confirm strong Support | Entry: On reversal off Support Stop: Below the established Support level Target: Next Resistance or Swing High | Classic “buy the dip” technique; strong confirmation |
| 3. Swing Lows in Neutral Markets | Range-bound price; lows form at bottom of the channel | Entry: At the range bottom after confirmation Stop: Below the range low Target: Top of the range | Higher risk due to weak momentum—always confirm with candlesticks or entum indicators |
How to Trade Swing Highs
Swing Highs offer short opportunities in bearish or neutral conditions.
If you want to trade with an instrument’s direction, highs will present entry opportunities on selloffs.
When a lower high forms, traders can enter short positions and set a stop loss above the recent low.
Profit targets can be set at the next low point or resistance level.
How to Trade Swing Highs: Table Overview
| Scenario | Meaning | Typical Trade Setup | Notes |
|---|---|---|---|
| 1. Lower Highs in a Selloff | Confirms sellers remain in control; Selloff is continuing | Entry: When price reverses downward Stop: Above the recent Swing High Target: Next Swing Low or Support | Ideal “with-trend” short setup; strong momentum advantage |
| 2. Swing Highs at Resistance | Multiple highs at the same level confirm strong Resistance | Entry: On reversal from Resistance Stop: Above the established Resistance level Target: Next Swing Low or Support | Classic “sell the rip”; excellent when paired with confirmation |
| 3. Swing Highs in Neutral Markets | Price oscillates inside a range; highs form at the top of the channel | Entry: At the range top after confirmation Stop: Above the range high Target: Bottom of the range | Higher risk due to weak momentum—confirm with candlesticks or momentum indicators |
Swing Points Are Technical Analysis Too
Swing structure becomes much more reliable when combined with:
- Momentum indicators (RSI, TSI, Stochastic)
- Japanese Candlesticks (Hammer, Shooting Star, Engulfing)
- Chart Patterns (Wedges, Flags, Rectangles)
These techniques all identify reversals or continuation points—perfect complements to swings.
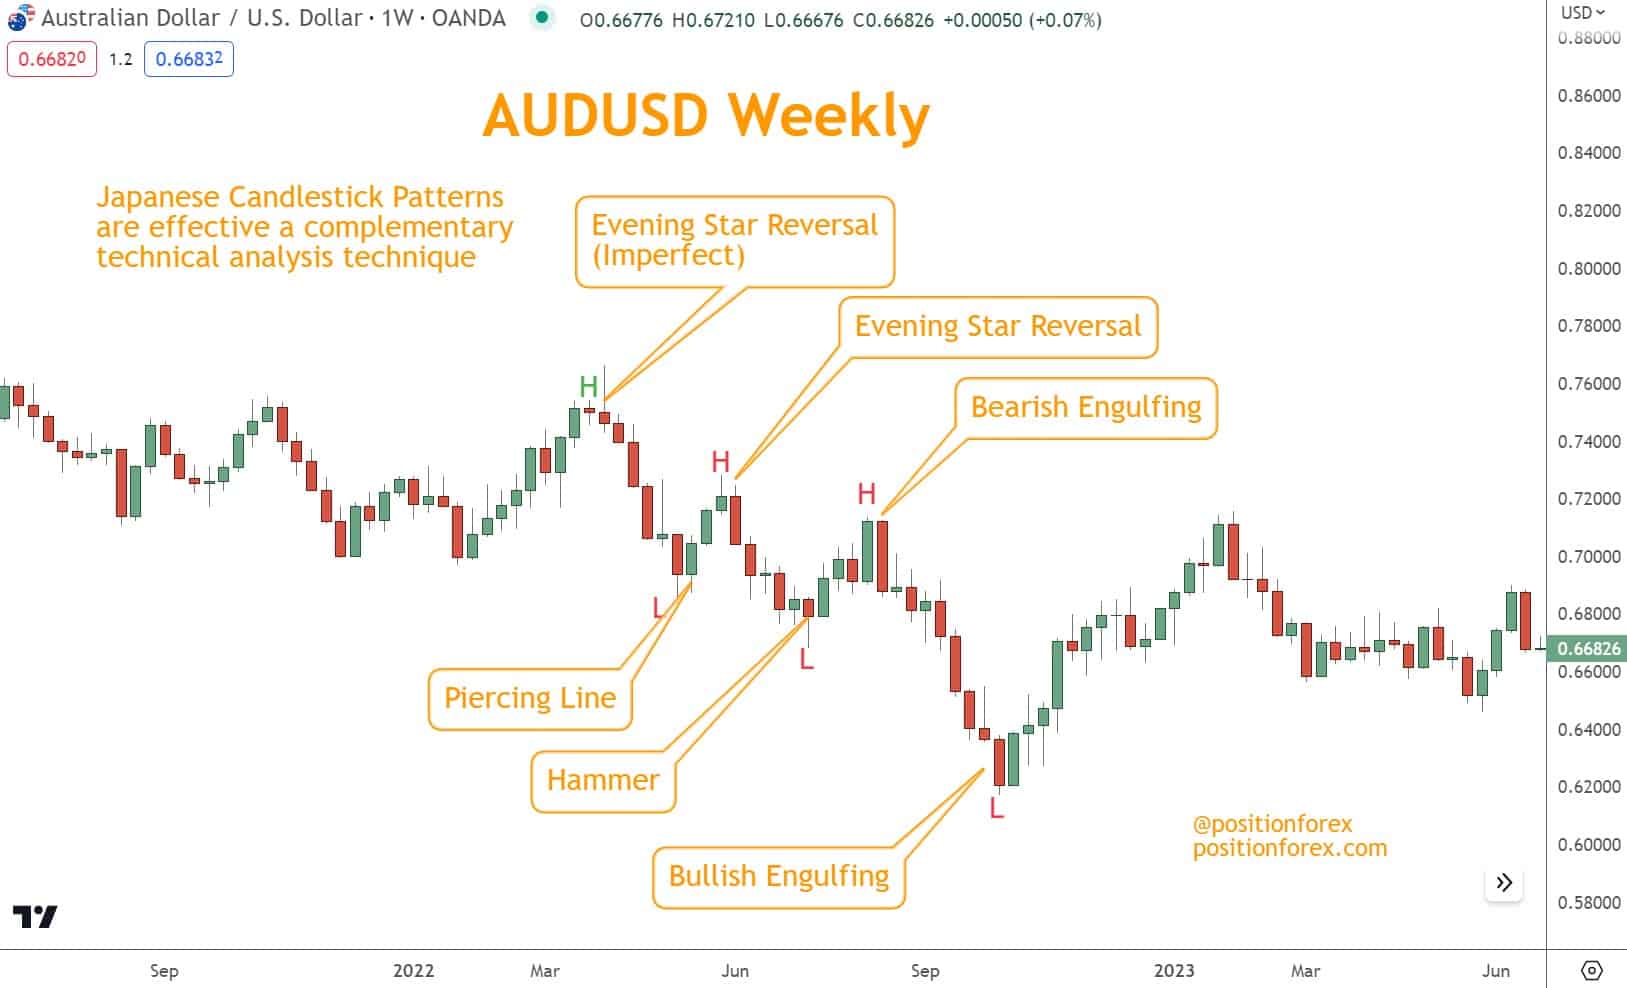
Using Candlestick Patterns with Swing Points
Candlestick Patterns offer valuable insights into potential direction changes in the Forex market.
Combined with Swing Point analysis, you can identify trading setups by identifying bullish or bearish signals like Hammers or Shooting Stars.
Candlesticks provide psychological context:
- Hammer at a Swing Low: Strong Bullish reversal
- Shooting Star at a Swing High: Strong Bearish reversal
- Engulfing patterns: High-probability reversals
Always confirm with structure before entering a trade.
Using Chart Patterns with Swing Points
Traders looking to use Chart Patterns with swings in Forex trading can identify opportunities by watching Chart Patterns develop.
Wedges or Flags are examples of Chart Patterns easily combined with labeled swings to help determine signals for buying or selling.
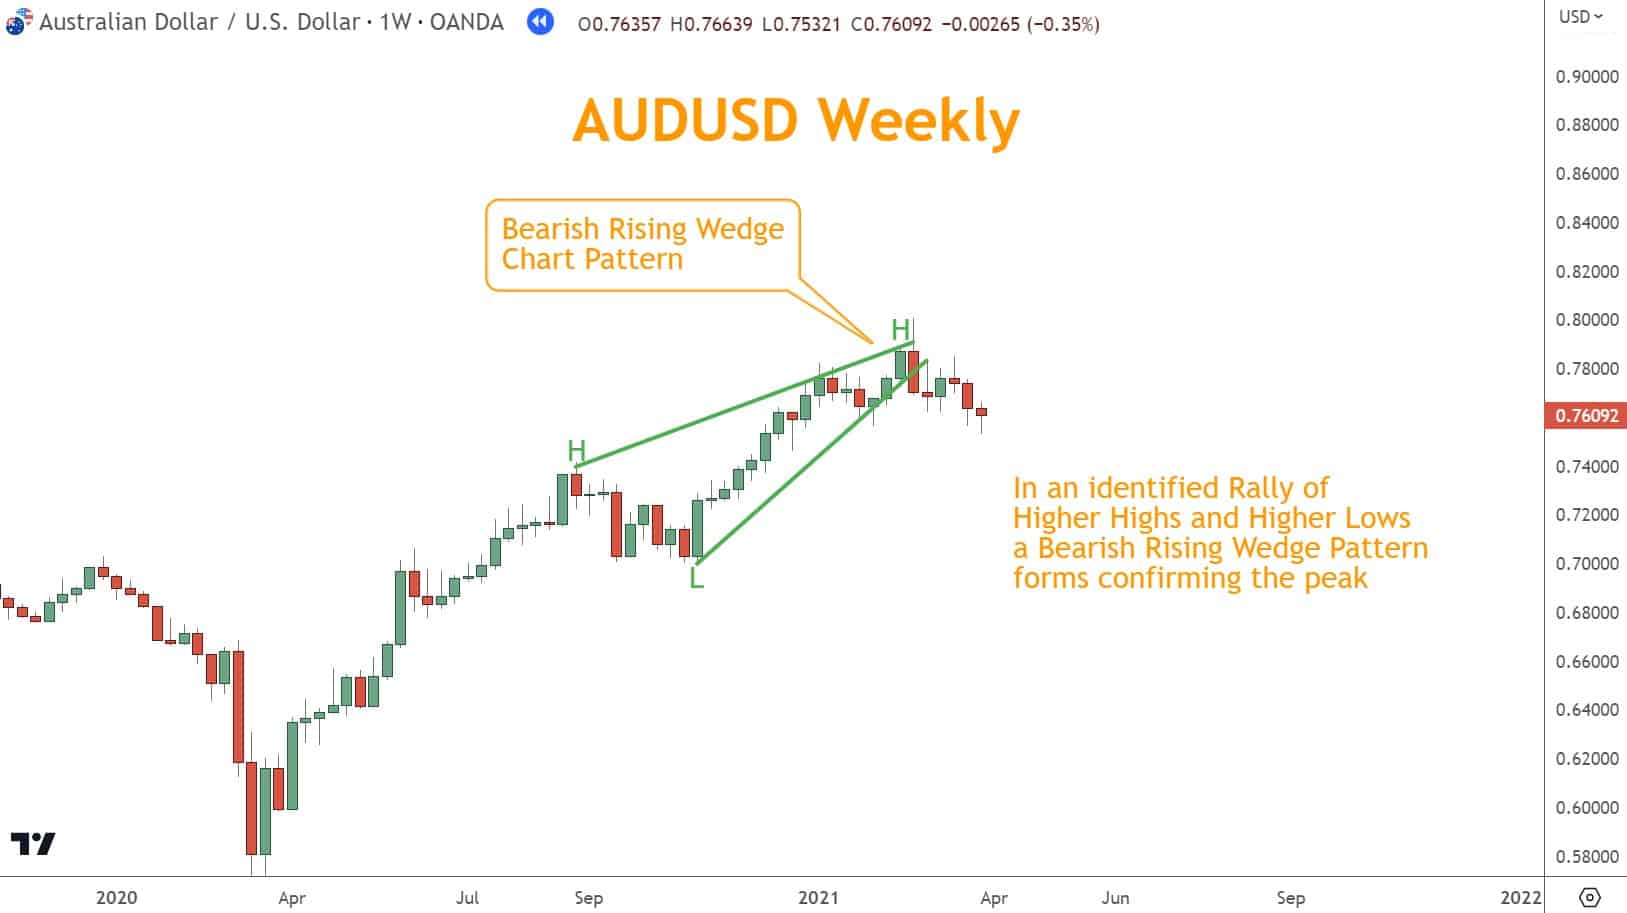
Chart Patterns often form between Swing Points:
- Wedges
- Flags
- Triangles
- Rectangles
When the pattern structure matches the swing structure, the probability increases dramatically.
Using Momentum Indicators to Confirm Swing Points
Traders can use momentum indicators such as the RSI or TSI to confirm entry and exit areas for trades.
Using peaks and troughs with these indicators increases the probability of a successful trade.
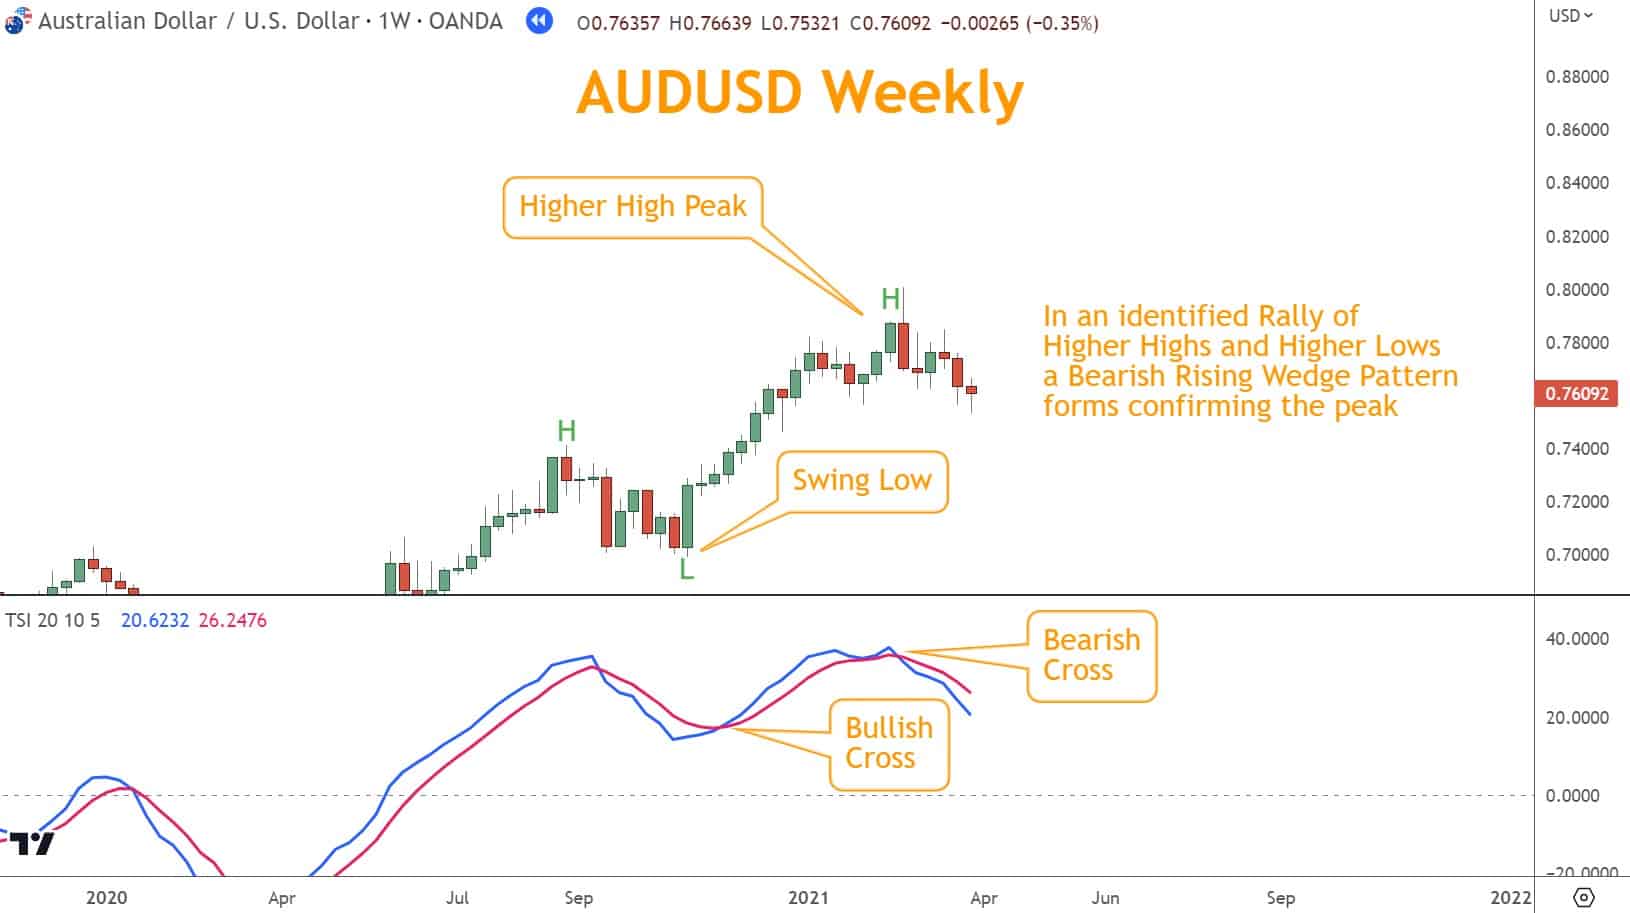
Momentum validates the strength of a swing:
- Bullish divergence at a Swing Low = reversal likely
- Bearish divergence at a Swing High = selloff likely
- Confirmation strengthens entries and protects against false signals
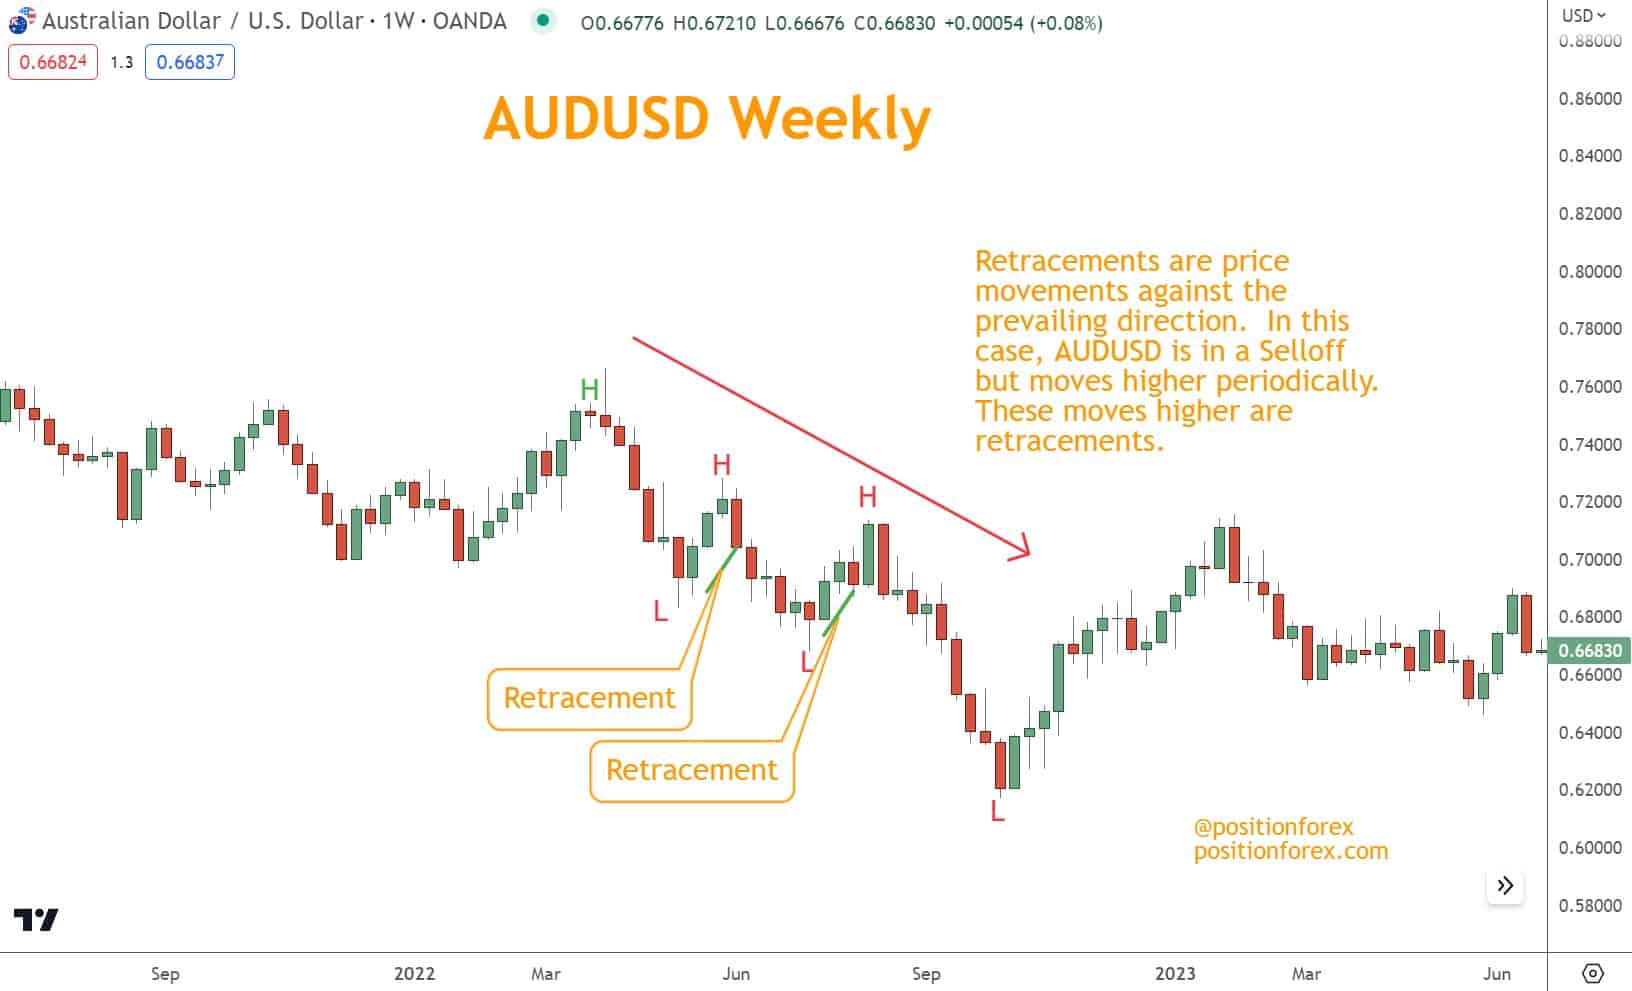
What Are Retracements?
Retracements are the ideal trading strategy swings will offer. During either a confirmed rally or selloff, you can find high-probability trade setups when prices temporarily move against a rally or selloff.
Traders analyze previous price movements to identify retracements effectively and efficiently, thereby determining critical Support and resistance levels.
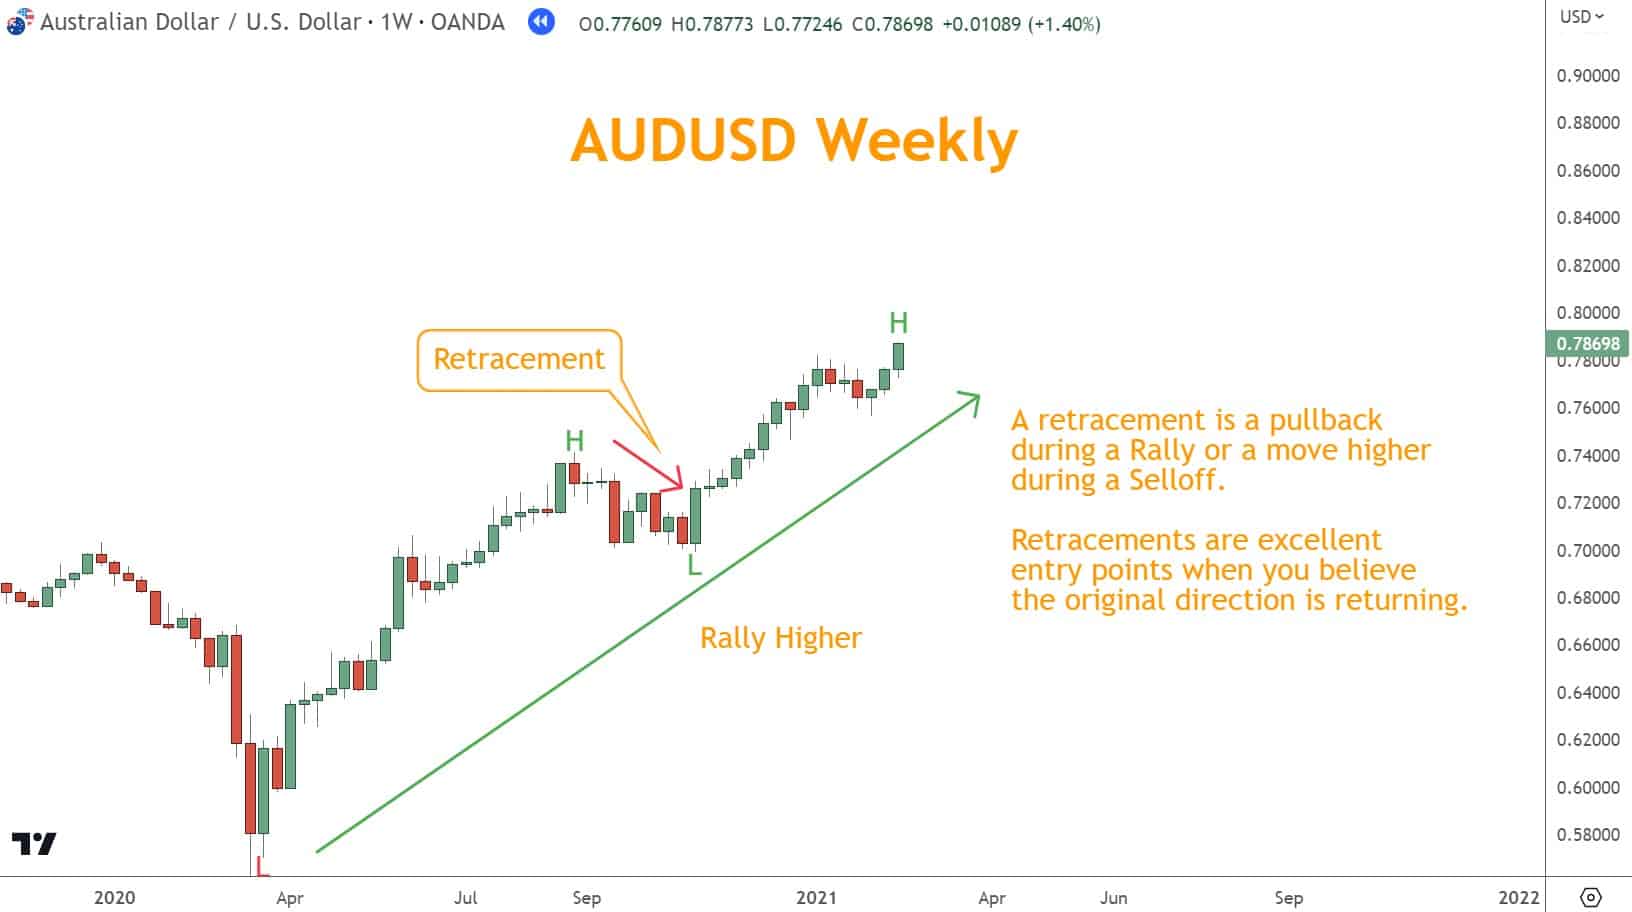
Retracements are temporary moves against the trend—ideal entry zones.
Swings help you pinpoint where retracements should occur so you can:
- Enter with the trend
- Place stops below/above structure
- Target natural structure levels
Retracement trading is one of the most profitable swing-based strategies.
What’s the Next Step?
Start practicing real-time structure reading:
- Pick a chart
- Mark Swing Highs and Swing Lows
- Identify whether the market is rallying, selling off, or neutral
- Look for retracements into structure
- Confirm with momentum, candlesticks, or chart patterns
- Build your stop and target levels around swing structure
Need a structured method?
Start with the Six Basics of Chart Analysis—free on PositionForex.com. You’ll also receive Forex Forecast every Sunday, including:
- Trade ideas
- Real trade case studies
- Videos and educational guides
- New article alerts
- Webinars
- Exclusive tools

All are completely free.
Frequently Asked Questions
What are Swing Highs and Swing Lows in trading?
They are turning points in price. Swing Highs identify peaks; Swing Lows identify troughs. Together, they reveal market structure, direction, and opportunities.
What are the three essential rules for trading swing points?
- Have a system for identifying peaks and troughs
- Determine the market’s direction before opening a trade
- Use complementary indicators for confirmation
What indicators should I combine with Swing Points?
Momentum (RSI, TSI), candlesticks (Hammer, Engulfing), and chart patterns (Wedges, Flags). These tools confirm swing-based signals.
Can Swing Points identify Support and Resistance?
Yes. Multiple highs at the same level form resistance; multiple lows form support.
Are swing-based trades suitable for beginners?
Yes. Swing structure is clear, logical, and easier to interpret than many advanced strategies.
5-Question Quiz
1. What structure defines a Selloff in swing analysis?
A. Higher Highs and Higher Lows
B. No clear pattern
C. Lower Highs and Lower Lows
D. Equal Highs and Lows
2. Where is the ideal Stop placement for a long trade based on a Swing Low?
A. Above the Swing High
B. Inside the consolidation zone
C. Below the recent Swing Low
D. At the midpoint of the retracement
3. Which combination provides the strongest confirmation of a Swing High reversal?
A. A random large candle
B. Bullish Engulfing at resistance
C. Divergence alone
D. Shooting Star + Bearish momentum divergence
4. What makes retracements valuable for traders?
A. They always signal a trend reversal
B. They show when price is moving sideways
C. They offer entry opportunities with the trend at lower risk
D. They confirm that a trend has ended
5. Swing Points are most useful for which of the following?
A. Predicting economic news outcomes
B. Identifying structure, direction, and natural Stop/Target placements
C. Determining broker spreads
D. Measuring long-term volatility cycles
Answer Key
1 — C
2 — C
3 — D
4 — C
5 — B
Conclusion
Swing Highs and Swing Lows give you the most transparent window into market structure.
They show where the market is moving, where reversals form, and where the highest-probability entries exist. When combined with Candlesticks, Momentum, and Chart Patterns, swings help remove guesswork from your analysis.
Mastering structure is one of the simplest and most effective ways to improve your trading—and it gives you an edge that lasts.
Forex Trading Disclosure Statement
Risk Warning:
Forex trading involves significant risk and may not be suitable for all investors. The leveraged nature of Forex trading can work both for and against you, leading to substantial gains or losses. Before trading Forex, you should carefully consider your financial objectives, experience level, and risk tolerance. It is possible to lose more than your initial investment, and you should only trade with money you can afford to lose.
Market Risks and Volatility:
Forex markets are influenced by global economic, political, and social events, which can result in unpredictable price movements. High market volatility can lead to sudden and substantial changes in currency values, potentially causing losses that exceed your initial deposit.
Leverage Risks:
Leverage amplifies both potential gains and potential losses. While leverage can increase profitability, it also increases the risk of significant losses, including the loss of your entire trading capital.
Trading Tools and Technology Risks:
Forex trading platforms, including those offered by brokers, are subject to technology risks, such as system failures, latency issues, and potential errors in price feeds. Traders should be aware that these risks can impact the execution of trades and trading outcomes.
No Guarantee of Profitability:
Past performance in Forex trading is not indicative of future results. There is no guarantee that you will achieve profits or avoid losses when trading Forex. Market conditions and individual trading strategies vary, and no trading system can eliminate the inherent risks of Forex trading.
Educational Purposes Only:
Any information provided about Forex trading, including strategies, analysis, or market commentary, is for educational purposes only and should not be considered financial advice. Consult a qualified financial advisor or tax professional before making any trading decisions.
Regulatory Compliance:
Forex trading is regulated differently in various jurisdictions. Ensure that you are trading with a licensed and compliant broker in your country of residence.
Responsibility:
You are solely responsible for your trading decisions and the associated risks. It is your duty to understand the terms and conditions of Forex trading, including margin requirements, stop-losses, and other risk management tools.
Acknowledgment:
By engaging in Forex trading, you acknowledge that you have read, understood, and accepted this disclosure statement. You accept full responsibility for the outcomes of your trading decisions and agree to trade at your own risk.