
Hammer and Hanging Man patterns are two of the most common and useful single-candle Japanese Candlestick patterns every trader should recognize.
These patterns appear frequently on Forex charts and can signal potential trend reversals when used correctly.
In this guide, you’ll learn what they are, how to identify them, and three actionable tips to trade them with higher accuracy.
TL;DR – Hammer & Hanging Man Essentials
- Hammer: Appears at the bottom of a selloff and signals a potential Bullish reversal.
- Hanging Man: Appears at the top of a rally and signals a potential Bearish reversal.
- Both patterns require confirmation from another candle, momentum indicators, or support/resistance.
- Use context (trend, news, price structure) before trading either pattern.
- Always combine them with additional tools for better accuracy.
Table of Contents
- TL;DR – Hammer & Hanging Man Essentials
- Learn the Basics of These Patterns
- Identifying the Hammer Pattern in Forex Trading
- Trading This Bullish Pattern Unlocks a New Perspective
- Identifying the Hanging Man Pattern
- Trading This Pattern Can Change Your Views
- Three Tips for Trading Hammer and Hanging Man Patterns
- Quiz: Hammer & Hanging Man Mastery
- What’s the Next Step?
- Frequently Asked Questions
- Forex Trading Disclosure Statement
Learn the Basics of These Patterns
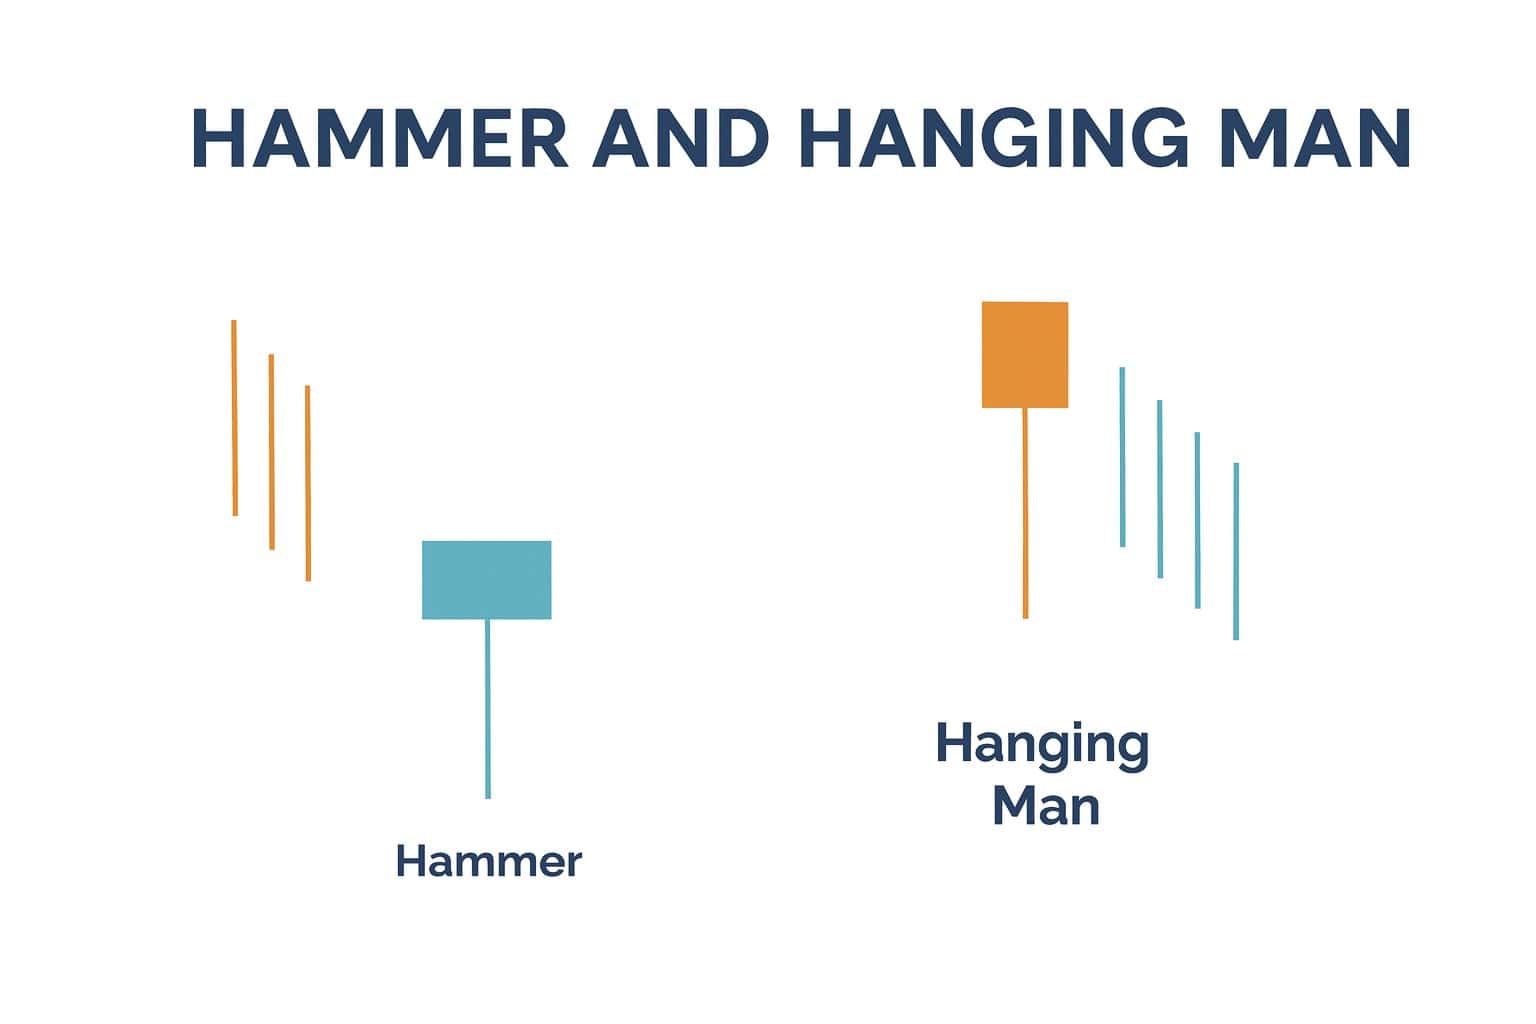
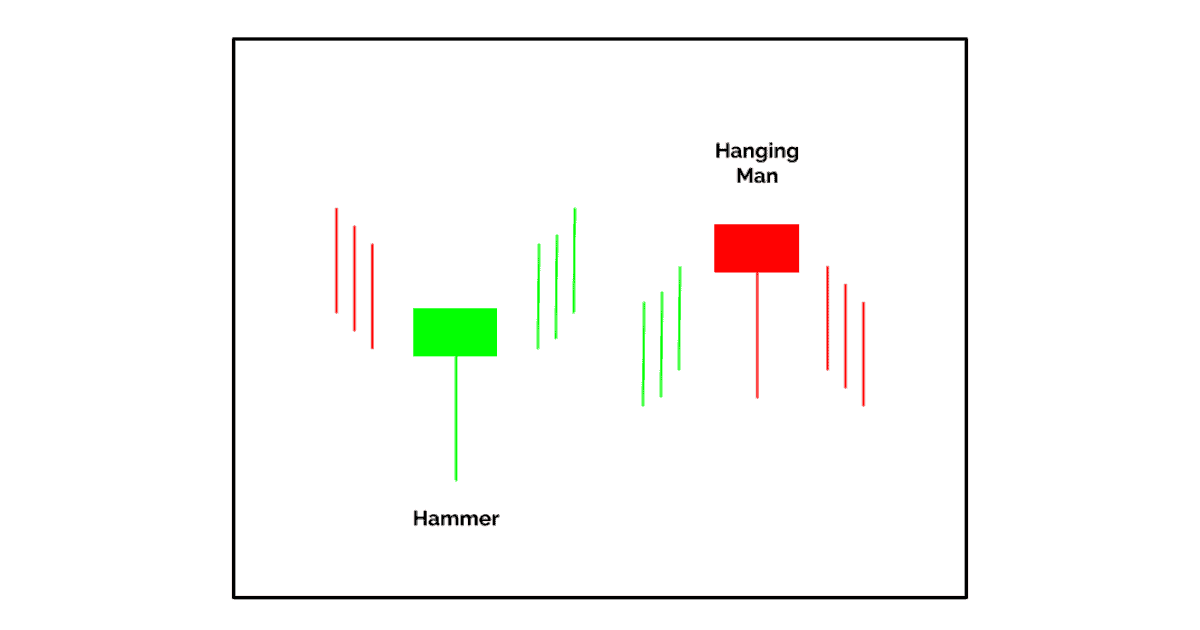
Hammer and Hanging Man patterns are widely used to identify potential trend reversals. Although they look similar, their meaning depends on where they appear in the trend.
Key characteristics
- Hammer:
- Small body
- Long lower shadow
- Forms at the bottom of a selloff
- Signals a potential Rally
- Small body
- Hanging Man:
- Small body
- Long lower shadow
- Forms at the top of a rally
- Signals a potential Selloff
- Small body
An idealized illustration of these two patterns is below.
How to use them
- Always wait for confirmation before trading
- Set clear entry, exit, and stop-loss levels
- Combine them with:
- Momentum indicators
- Chart Patterns
- Support and Resistance
- Momentum indicators
This combination strengthens your analysis and helps validate reversal signals.
Identifying the Hammer Pattern in Forex Trading
The Hammer is a Bullish reversal pattern that shows sellers may be losing strength.
How to identify it
- Small real body near the top of the candle
- Long lower shadow
- Little to no upper shadow
- Appears after a downtrend or Selloff
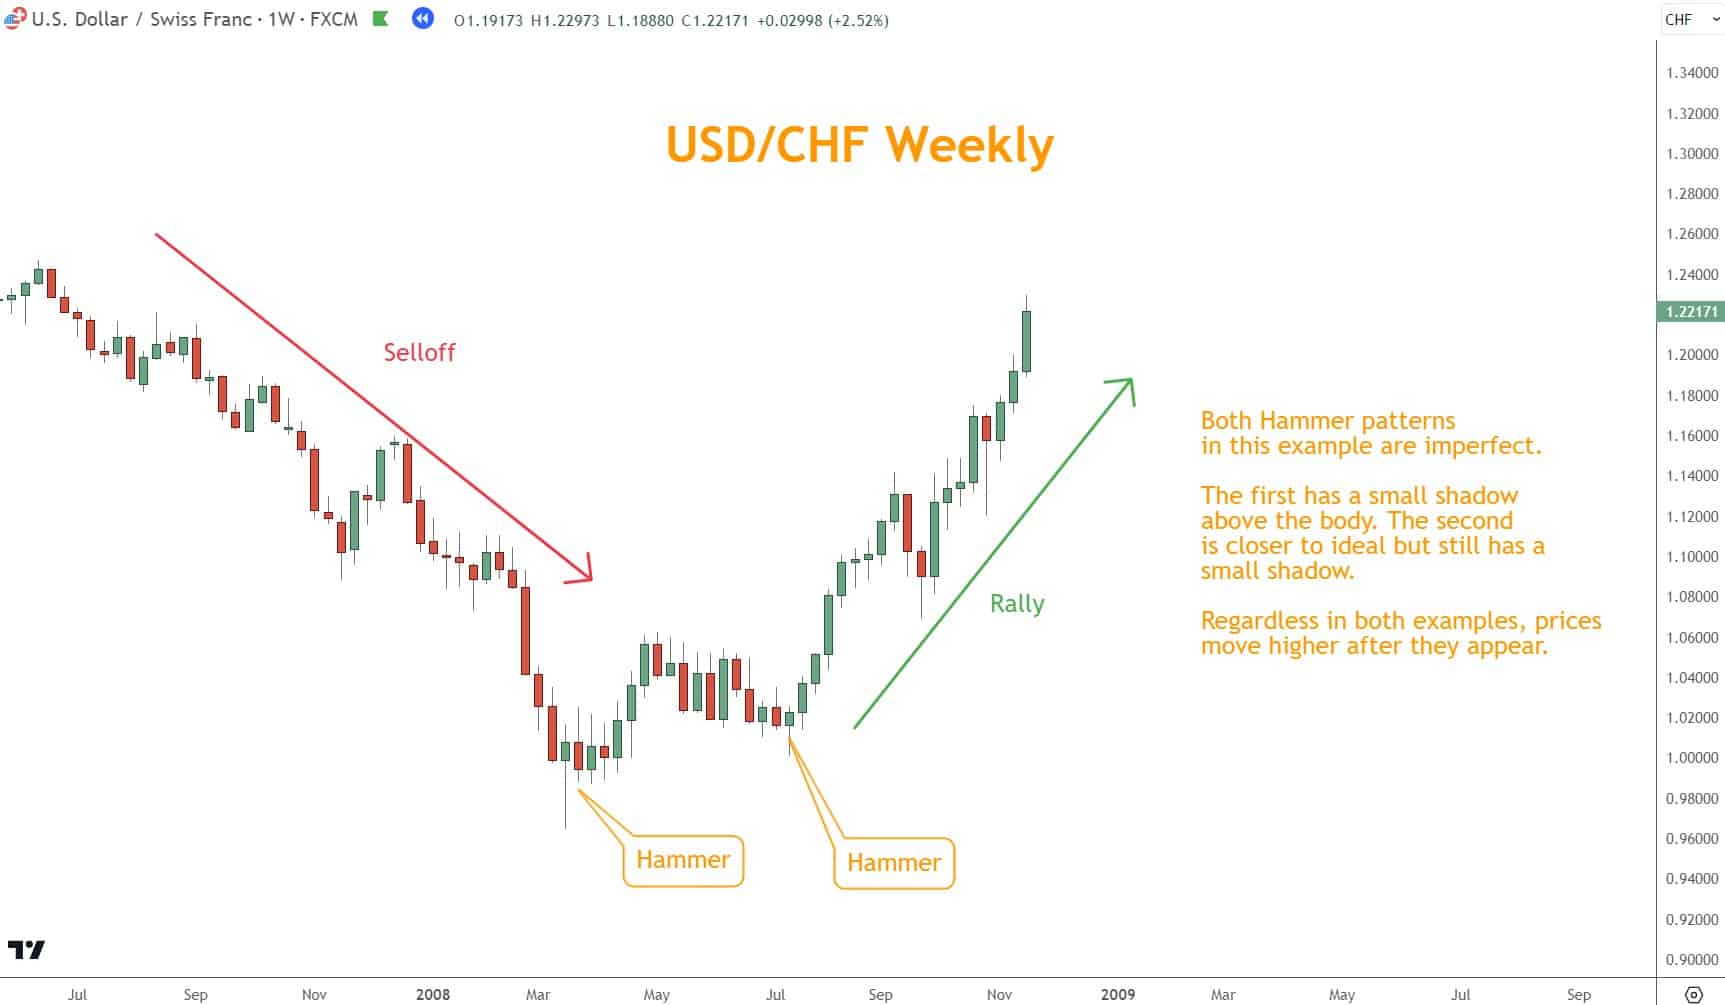
In the USD/CHF example below, the first Hammer reversal triggers a bullish bounce, and after a brief consolidation, another Hammer triggers a larger rally.
What it means
- Selling pressure may be exhausted
- Buyers are stepping in
- A potential Rally may form
Traders often place stop-losses below the pattern’s low and use nearby Support or swing levels for profit targets.
Trading This Bullish Pattern Unlocks a New Perspective
Trading the Hammer requires confirmation to avoid false signals.
Confirmation methods
- A Bullish candle closing above the Hammer
- Break above a minor Resistance level
- Momentum indicator turning upward
- Chart Pattern confluence
Protecting your trade with proper risk management—especially stop-loss placement—is essential.
Looking for a Strategy?
Download the Six Basics of Chart Analysis and sign up for Forex Forecast to learn a bottom-up approach to analyzing Forex markets and weekly market updates.
Identifying the Hanging Man Pattern
The Hanging Man is the Bearish counterpart to the Hammer.
How to identify it
- Small real body
- Long lower shadow
- Appears after a Rally or uptrend
- Signals a potential Selloff
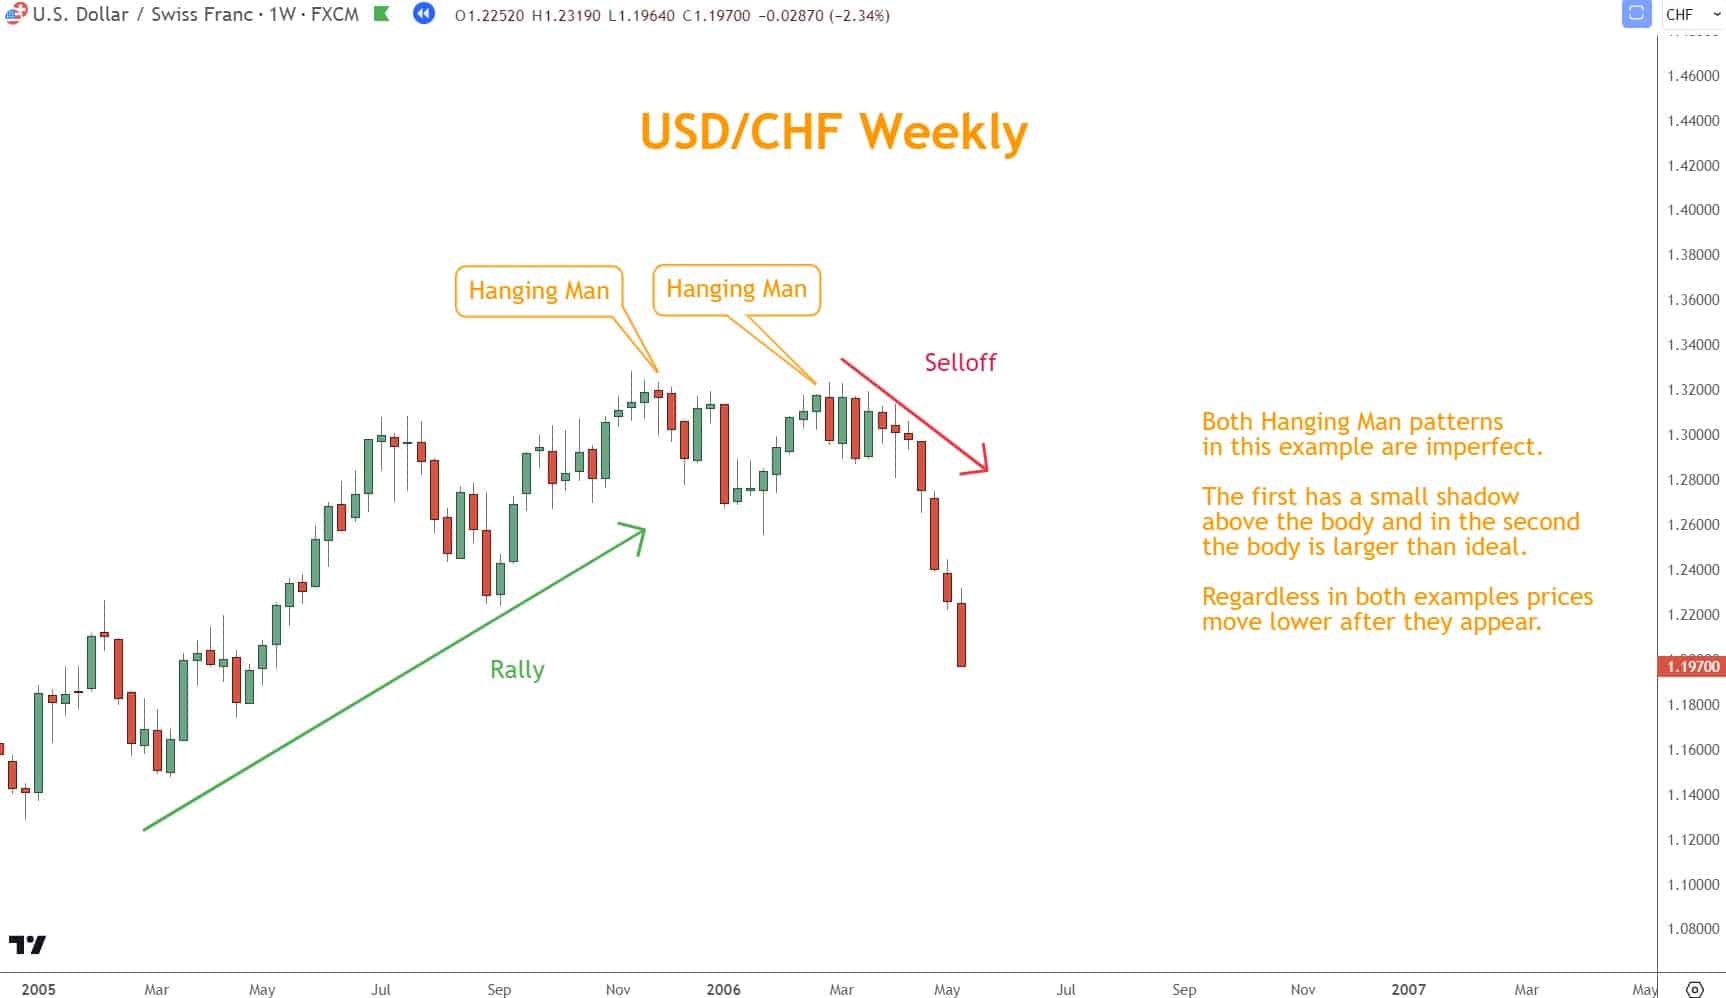
In the USD/CHF example below, the first Hanging Man triggers an initial selloff. After the short selloff and bounce, the second Hanging Man leads to a deeper selloff.
What it means
- Buyers pushed the price up, but sellers regained control
- Selling pressure may be increasing
- A downturn may follow
Stop losses are commonly placed above the pattern’s high.
Trading This Pattern Can Change Your Views
The Hanging Man suggests a possible Bearish reversal, but only when validated by additional evidence.
Confirmation methods
- A Bearish candle closing lower the next session
- Break below recent support
- Bearish Momentum crossover
- Confluence with a bearish Chart Pattern
Because this pattern appears at the top of a Rally, confirmation becomes even more important.
Three Tips for Trading Hammer and Hanging Man Patterns
These three principles drastically improve accuracy when trading Hammer or Hanging Man patterns.
1. You Need to Identify the Context First
Candlestick patterns must be evaluated in context.
- Hammer: Only valid at the bottom of a Selloff
- Hanging Man: Only valid at the top of a Rally
- Consider:
- Trend direction
- News and economic events
- Market sentiment
- Historical price behavior
- Trend direction
In the USD/CHF example below, the two Hammer patterns at the bottom of the selloff foreshadow the rally that follows.
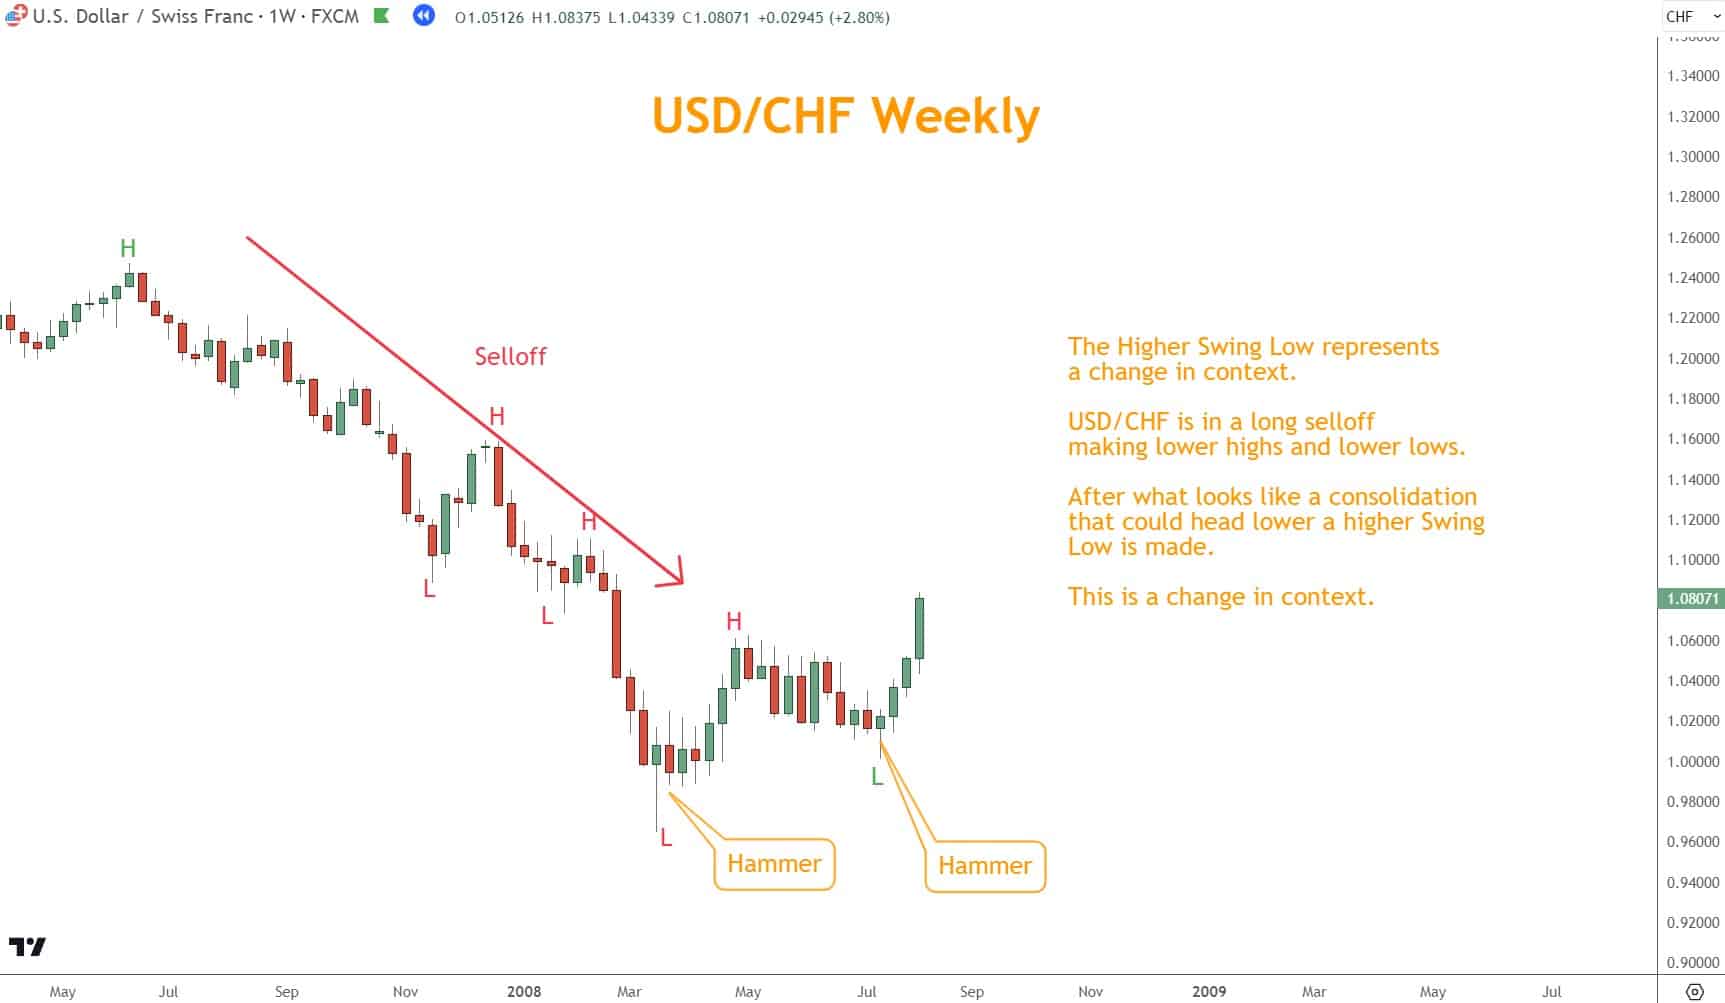
Correct context dramatically increases the probability that the pattern signals a true reversal.
2. Incorporate Other Indicators
Supplementing these patterns with confirmation tools is essential.
Effective supporting indicators include:
- Momentum indicators (TSI, RSI, Stochastic)
- Chart Patterns (Double Bottom, Wedges, Flags)
- Support & Resistance zones
In the USD/CHF example below, the TSI momentum indicator turns higher after the first Hammer candle and extends after the second.
Two support levels prevent prices from falling further, with prices bouncing at 0.9925 and 1.0300, respectively. There is also a broken bearish channel, with its last candle a Hammer.
These coinciding indicators reinforce the reversal and provide complementary confirmation to the Hammer candlestick pattern.
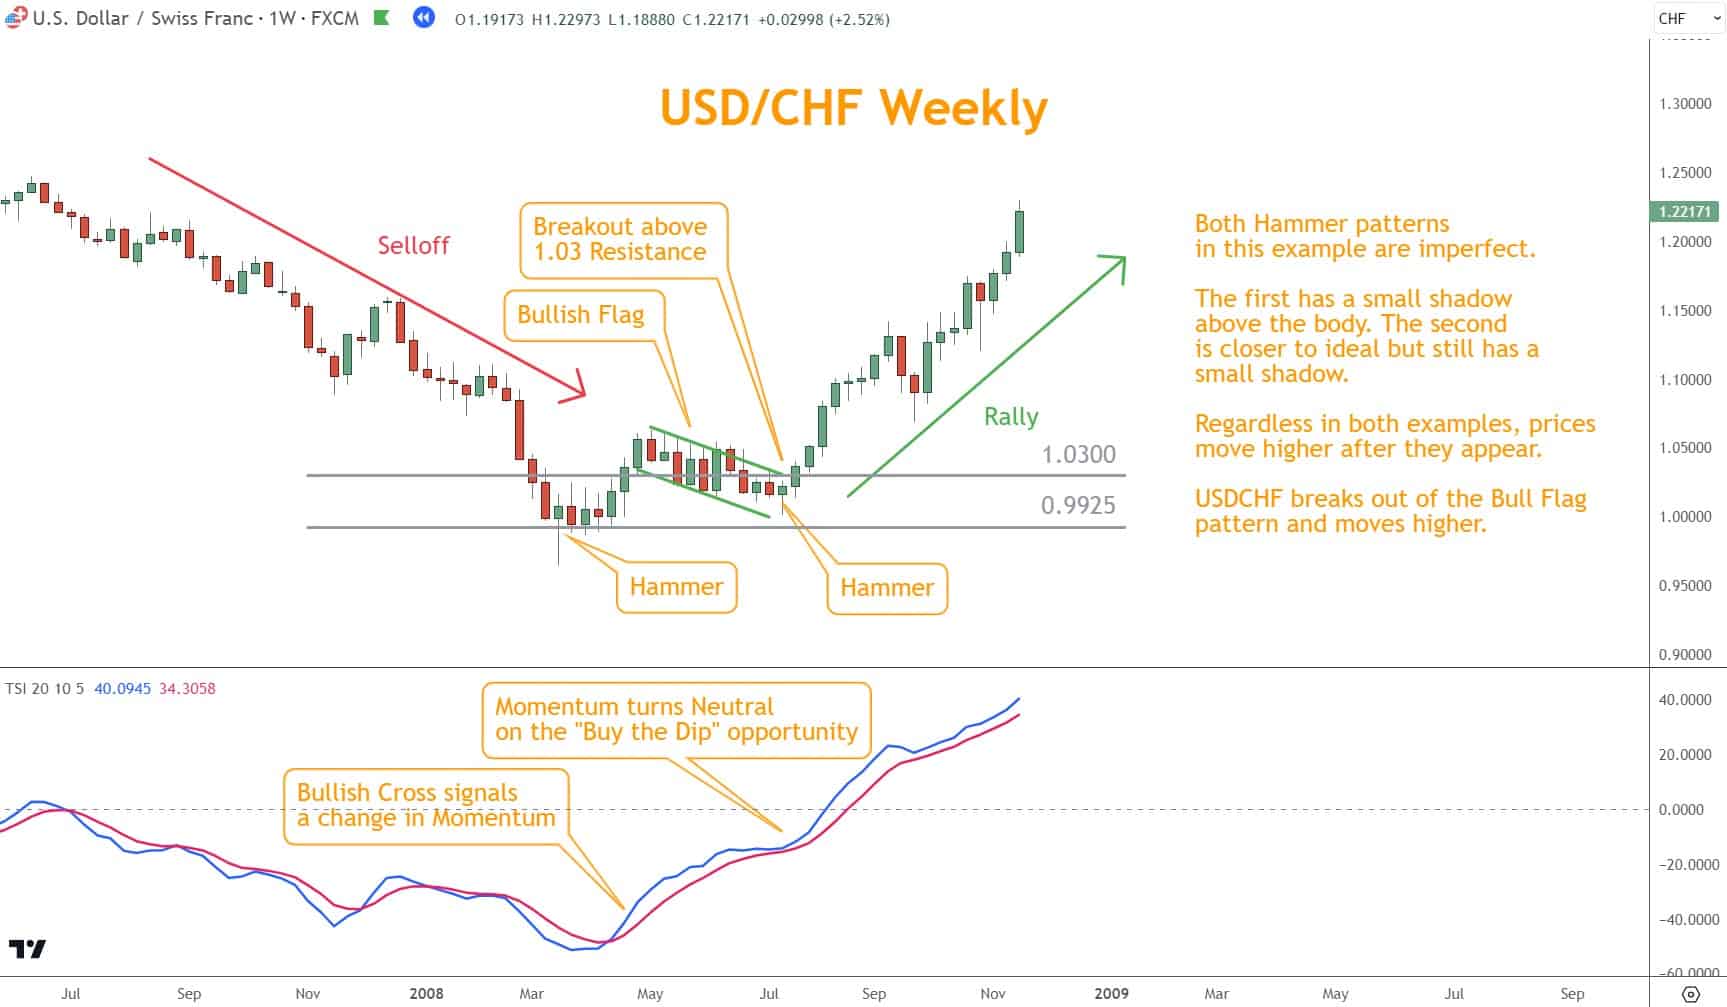
When multiple signals align, the setup becomes far more reliable.
3. Wait for Confirmation
Never trade a Hammer or Hanging Man without validation.
Confirmation examples
- Opposite-color candle closing beyond the pattern
- Momentum crossover
- Breakout from a Chart Pattern (Wedge, Flag, Double Bottom)
- Break of a key Support/Resistance level
Confirmation reduces false signals and improves trade quality.
Quiz: Hammer & Hanging Man Mastery
1. Where is the Hammer pattern considered valid?
a. At the top of a Rally
b. In the middle of consolidation
c. At the bottom of a Selloff
d. After a major news release
2. What does a Hanging Man pattern typically signal?
a. Trend continuation
b. Bullish reversal
c. No market significance
d. Potential Bearish reversal
3. What is the most important step before trading either pattern?
a. Enter immediately
b. Wait for confirmation
c. Ignore other indicators
d. Only use lower timeframes
4. Which indicator can help confirm these candlestick patterns?
a. TSI
b. Weather reports
c. Moving Averages from stocks only
d. None of the above
5. Which of the following improves trading accuracy?
a. Ignoring context
b. Trading only one candlestick pattern
c. Using multiple indicators for confluence
d. Avoiding stop-losses
Answer Key
- c
- d
- b
- a
- c
What’s the Next Step?
Open your chart and look for Hammer and Hanging Man patterns.
Then:
- Combine them with Momentum indicators
- Add Chart Pattern analysis
- Evaluate Support and Resistance
- Confirm before entering
If you need a structured process, download the Six Basics of Chart Analysis.

When you do, you’ll also begin receiving Forex Forecast every Sunday, including trade ideas, analysis, education, videos, case studies, and updates.
Frequently Asked Questions
What mistakes should I avoid when trading these patterns?
Avoid relying solely on the pattern, skipping confirmation, ignoring market context, failing to set stop-losses, and overtrading.
What other patterns should I study?
Doji, Shooting Star, Inverted Hammer, and Spinning Top patterns are valuable additional one-candle signals.
Forex Trading Disclosure Statement
Risk Warning:
Forex trading involves significant risk and may not be suitable for all investors. You may lose more than your initial investment. Only trade with money you can afford to lose.
Market Risks and Volatility:
Currency prices move based on global events, economic data, and geopolitical changes. Volatility can cause sudden, unexpected losses.
Leverage Risks:
Leverage increases both potential gains and potential losses. Use it cautiously.
Technology Risks:
Trading platforms can experience outages, delays, or pricing errors that affect trades.
No Guaranteed Results:
Past performance does not guarantee future outcomes. No strategy eliminates all risk.
Educational Purpose Only:
The information provided is for education, not financial advice. Consult a licensed professional before trading.
Responsibility:
You are responsible for your own trading decisions and risk management.