
Understanding how to read a Forex chart is essential for successful trading.
Forex charts provide a visual roadmap of price movement, allowing traders to spot trends, confirm setups, and make informed decisions. Whether you’re just starting or looking to refine your skills, chart reading is a foundational ability every trader must master.
TL;DR – Read Forex Charts Like a Pro
This article walks you through the essentials of chart reading and five advanced analysis methods:
- Trend Analysis: Identify upward, downward, or sideways movement
- Support and Resistance: Recognize price floors and ceilings
- Momentum Analysis: Gauge the strength of price moves using RSI and MACD
- Japanese Candlesticks: Spot patterns that signal reversals or continuations
- Chart Patterns: Recognize formations like Flags, Triangles, and Head-and-Shoulders
It also includes practical tips for improving your chart-reading skills and optimizing your trading process.
Quick Reference Table – 5 Core Chart Analysis Techniques
| Technique | What to Look For | How It Helps Traders |
| Trend Analysis | Moving Averages, Higher highs/lows (uptrend), lower highs/lows (downtrend) | Reveals market direction and timing for entries |
| Support & Resistance | Previous highs/lows, sideways ranges | Helps set entry, exit, and stop levels |
| Momentum Indicators | TSI divergences or confirmations | Confirms or contradicts trend strength |
| Candlestick Patterns | Harami, Engulfing, Doji, Hammer, etc. | Adds price-action confirmation |
| Chart Patterns | Bull Flags, Triangles, Head-and-Shoulders | Identifies reversal or continuation setups |
Table of Contents
- TL;DR – Read Forex Charts Like a Pro
- Quick Reference Table – 5 Core Chart Analysis Techniques
- What Is a Forex Chart?
- How to Read a Forex Chart Basics
- Components of a Forex Chart
- 1. Trend Analysis
- 2. Support and Resistance Levels
- 3. Momentum Analysis
- 4. Japanese Candlesticks
- 5. Chart Patterns
- Practical Tips for Reading Forex Charts
- Conclusion
- What’s the Next Step?
- Frequently Asked Questions
- Forex Trading Disclosure Statement
What Is a Forex Chart?
A Forex chart is a visual representation of a currency pair’s price movements over time.
It reflects the relationship between two currencies, such as EUR/USD, on various timeframes. Charts are essential for analyzing historical price behavior and projecting future moves.
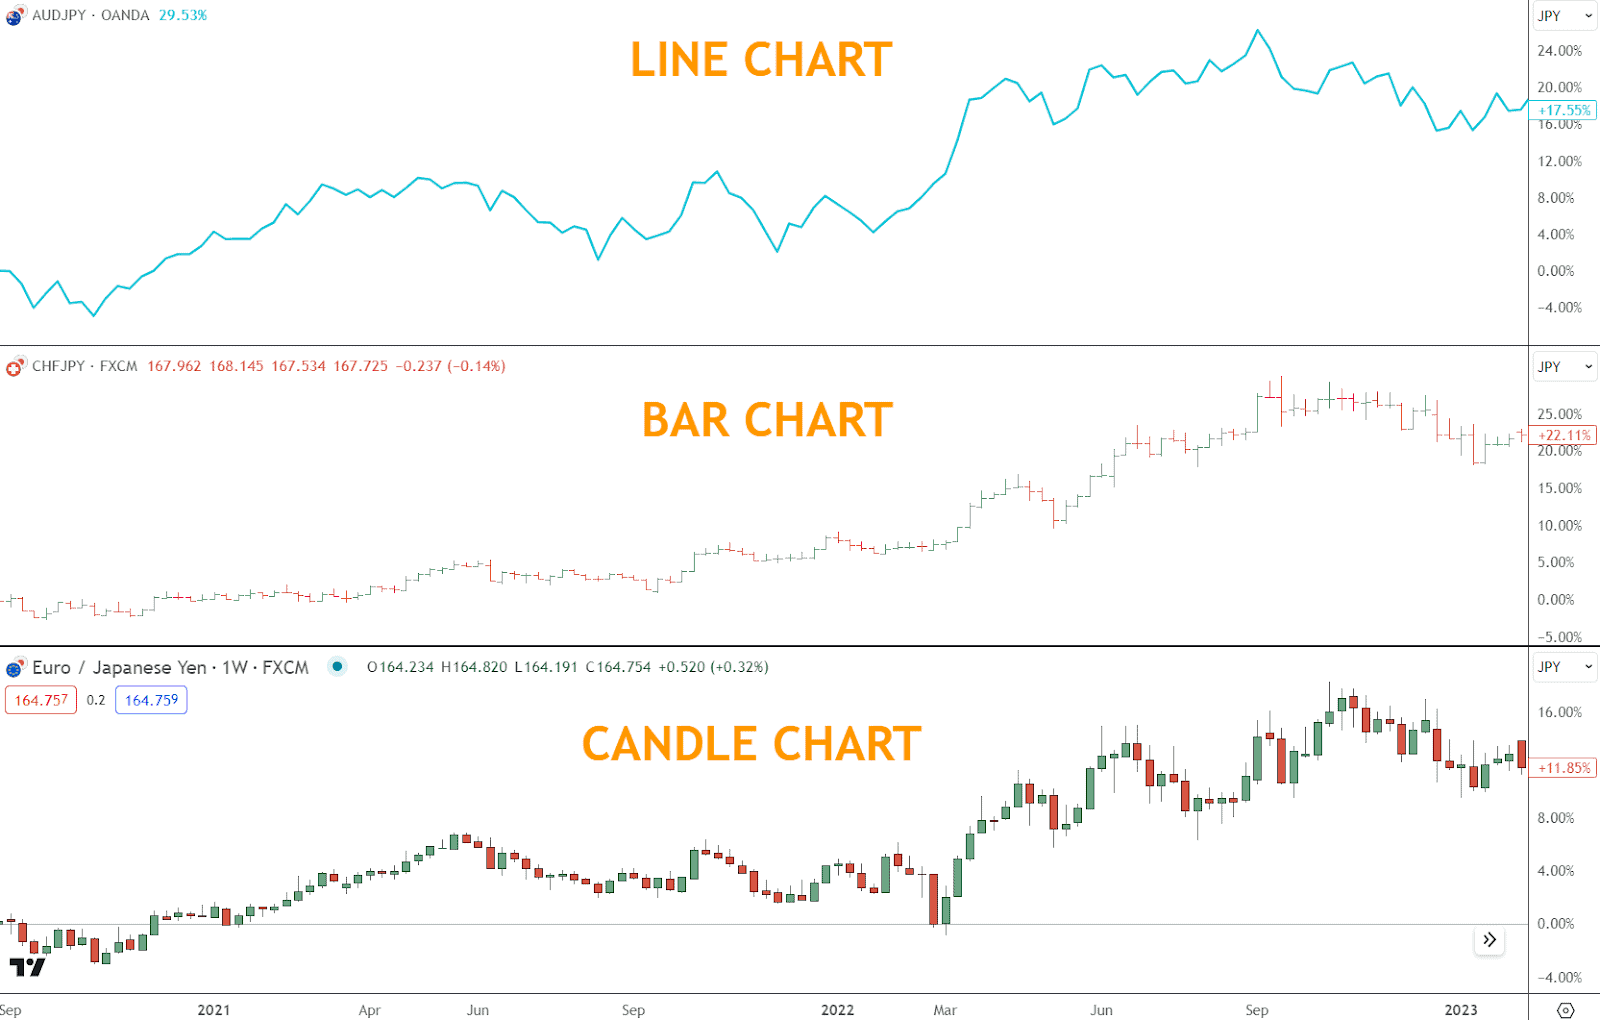
Most common Forex chart types:
- Line Charts: Connect closing prices for a simplified view
- Bar Charts: Display high, low, open, and close for each period
- Candlestick Charts: Present the same data as bar charts, but in a more visual and intuitive format
How to Read a Forex Chart Basics
Before diving into technical analysis, you must understand two key chart elements:
- Currency Pairs: Forex trades always involve a pair (e.g., EUR/USD). The first is the base currency; the second is the quote currency.
- Timeframes: Charts display price data across various intervals (1 minute, hourly, daily, weekly). Timeframes provide unique insights based on your trading horizon.
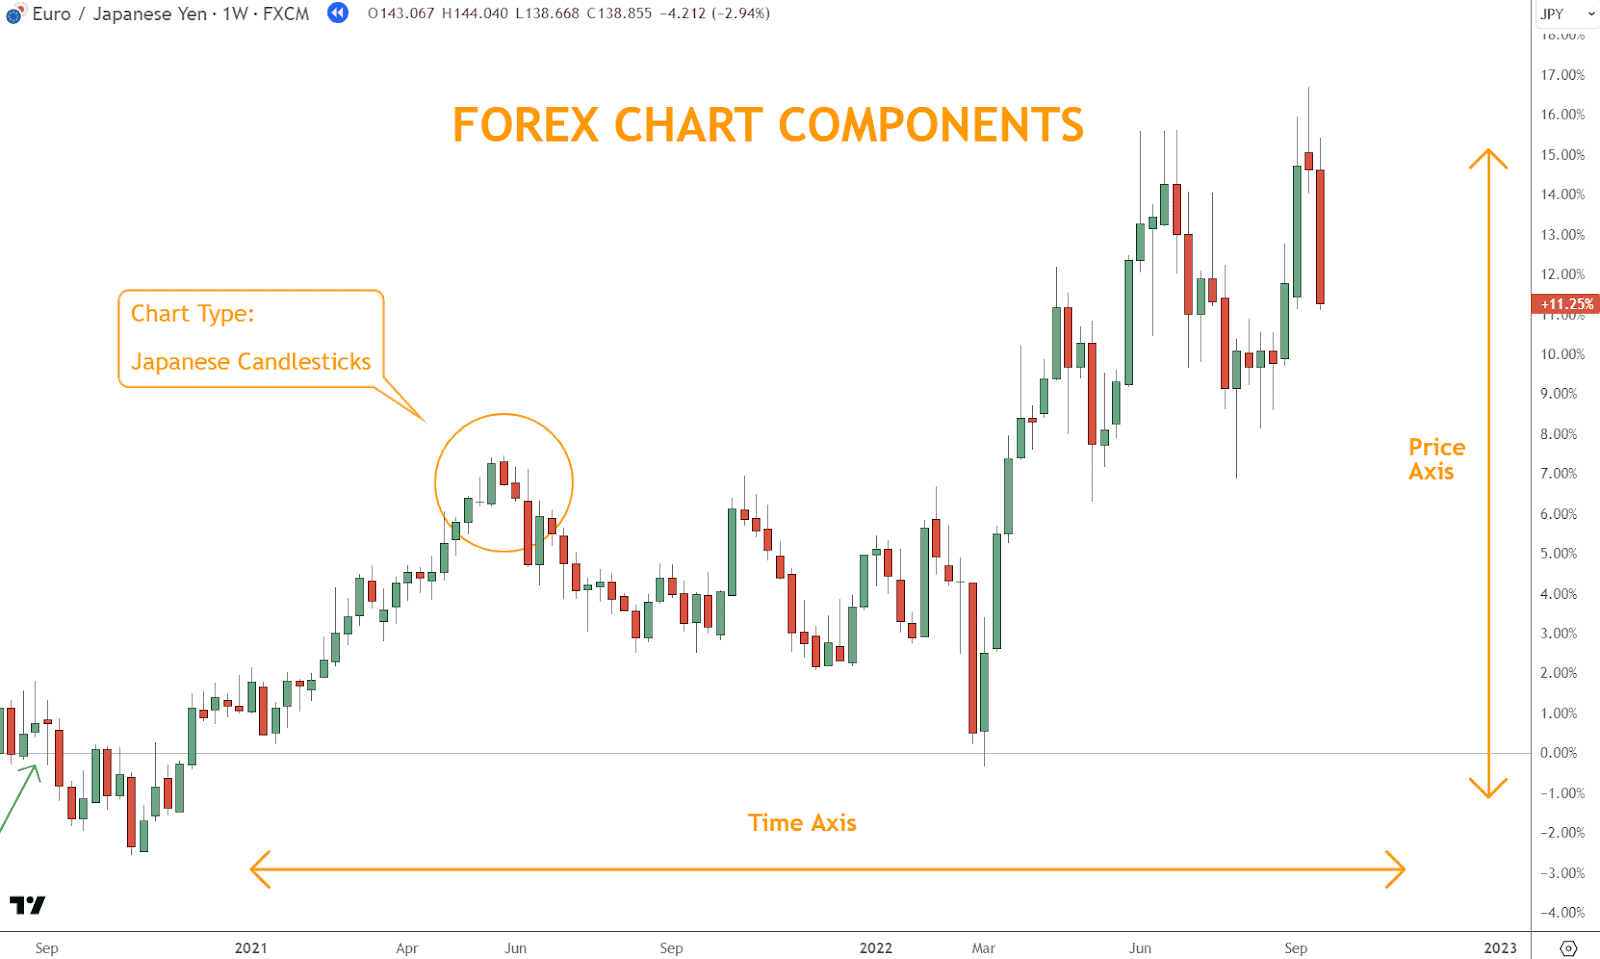
Components of a Forex Chart
Every Forex chart has three essential elements:
1. Price Axis (Vertical)
Located on the right-hand side, it represents the price of the currency pair.
2. Time Axis (Horizontal)
Displayed across the bottom, this axis marks time intervals. The most recent data appears on the right.
3. Chart Type
Choose between line, bar, or candlestick formats. Candlestick charts are preferred for their visual clarity and pattern recognition.
1. Trend Analysis
Trend analysis reveals the direction of price over time and helps traders align with momentum.
Identifying Trends
- Uptrend: Higher highs and higher lows or rising moving average
- Downtrend: Lower highs and lower lows or falling moving average
- Sideways: Price bounces between fixed highs and lows or sideways moving average
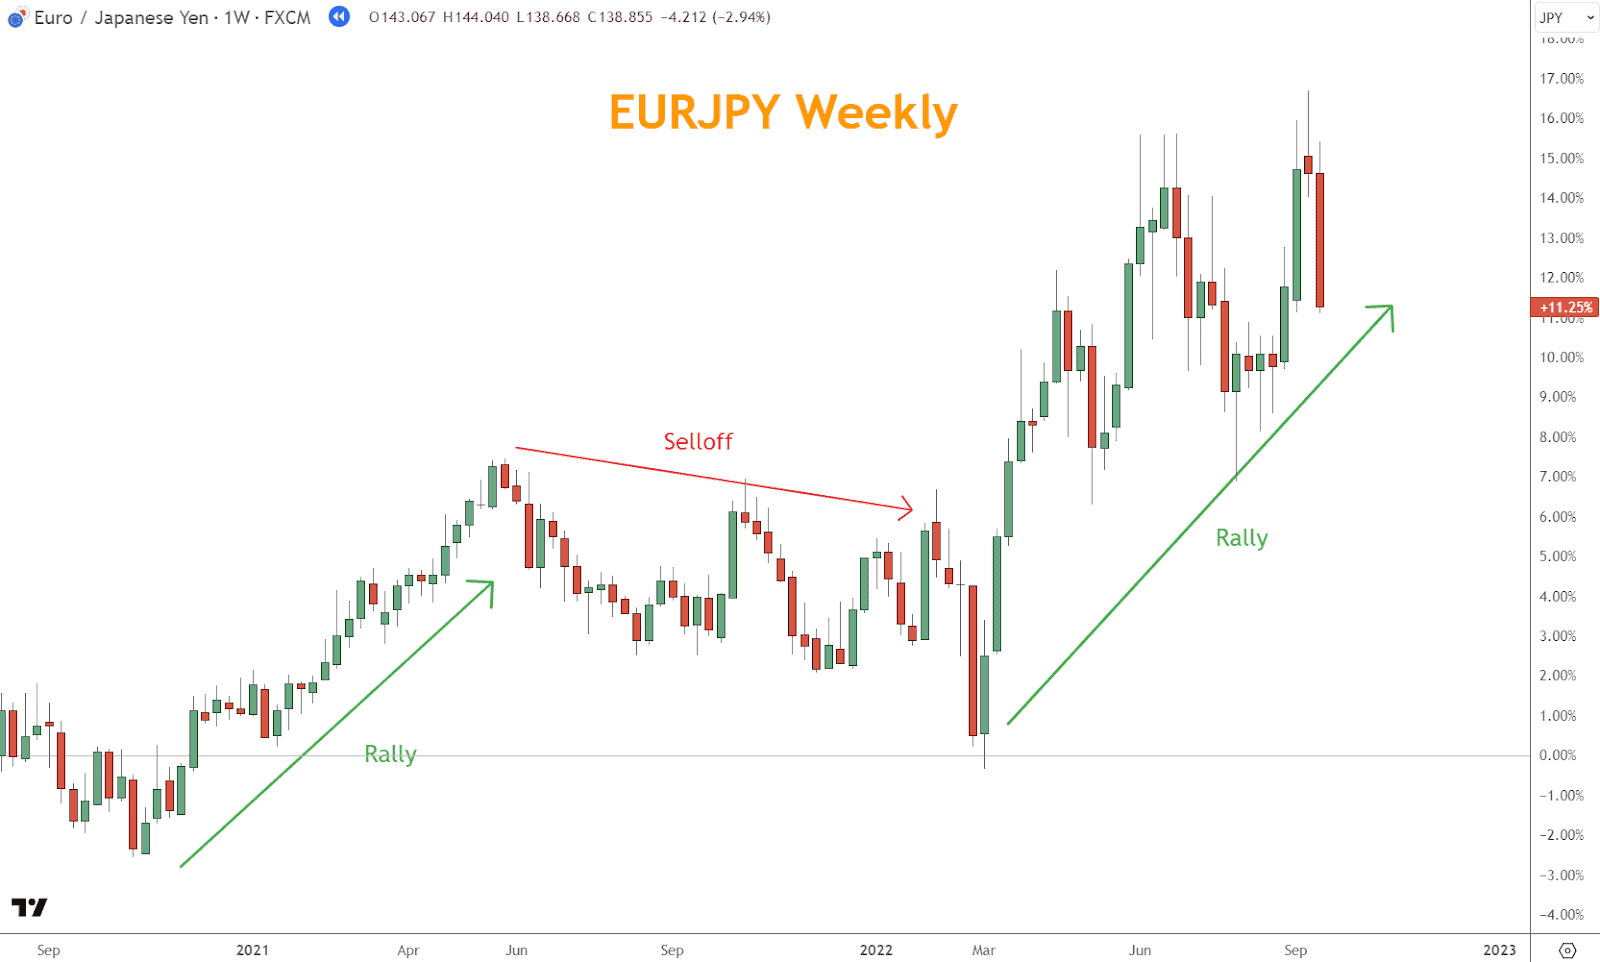
Using Channel Lines
Draw diagonal lines (trendlines) connecting swing points:
- Uptrend: Draw beneath price action
- Downtrend: Draw above price action
Trendlines help traders determine strength, reversals, and ideal entry/exit zones.
Example: A chart with two rallies and one selloff illustrates market phases by defining them through broad directional price moves.
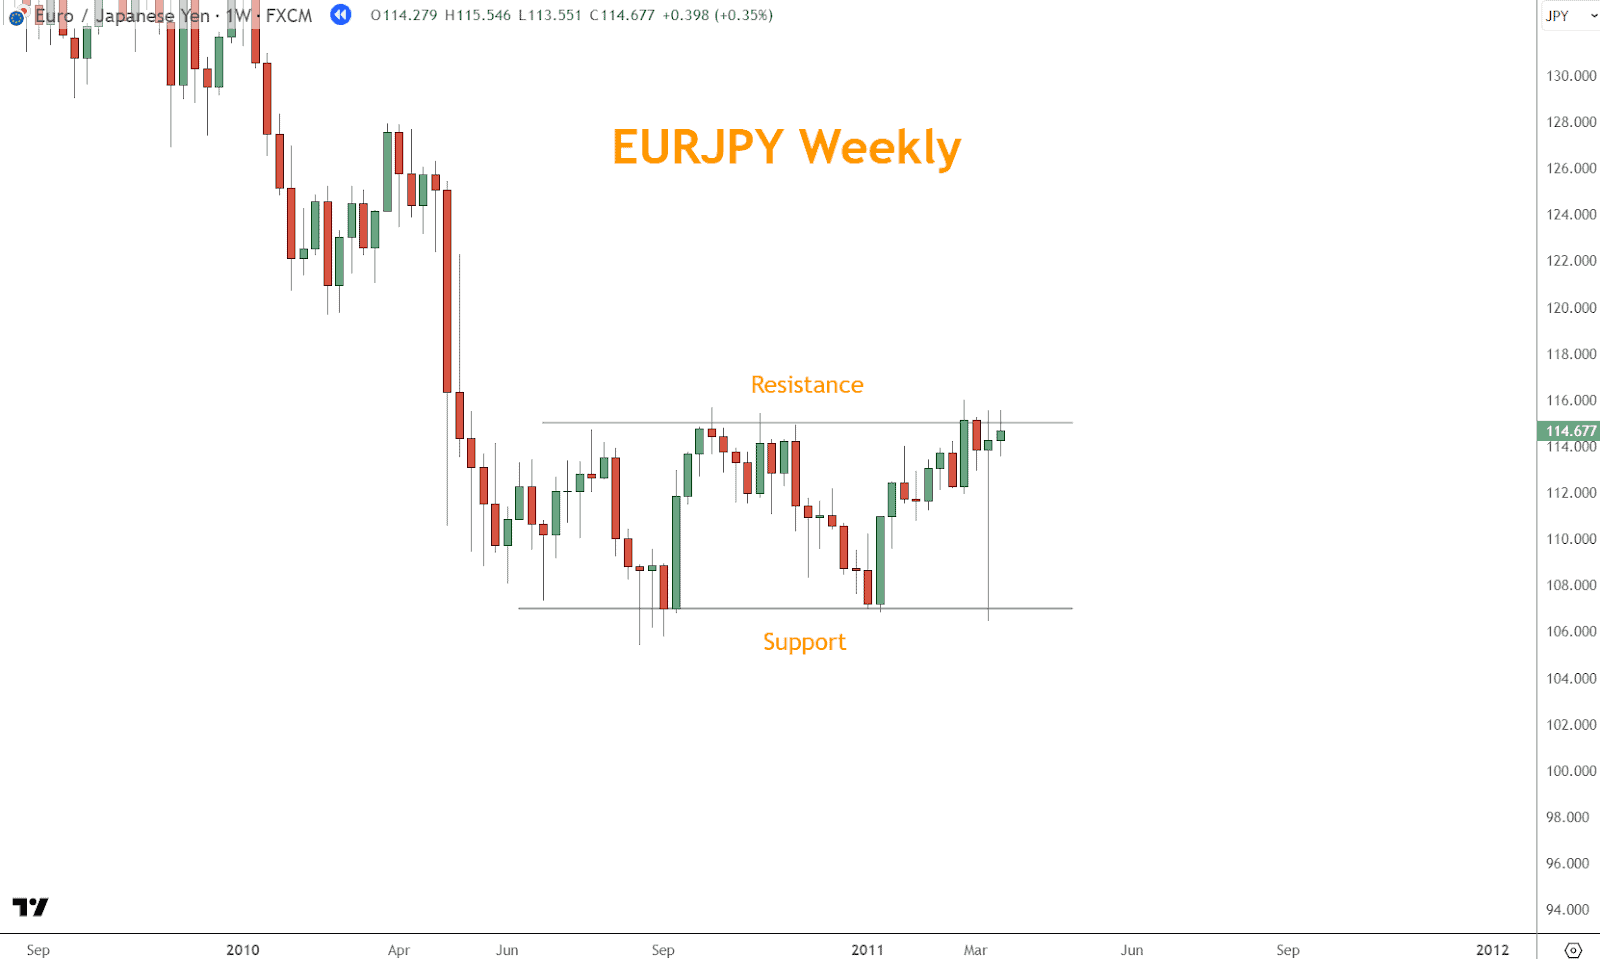
2. Support and Resistance Levels
Support and resistance are horizontal zones where price historically reacts, either bouncing back or breaking through.
What They Mean
- Support: A price floor where buying pressure often overcomes selling
- Resistance: A price ceiling where sellers step in
How to Use Them
- Set stop-losses and take-profit levels
- Trade breakouts or reversals depending on price reaction
Example: A sideways range on the chart defines the resistance (top) and support (bottom) levels during a period of consolidation.
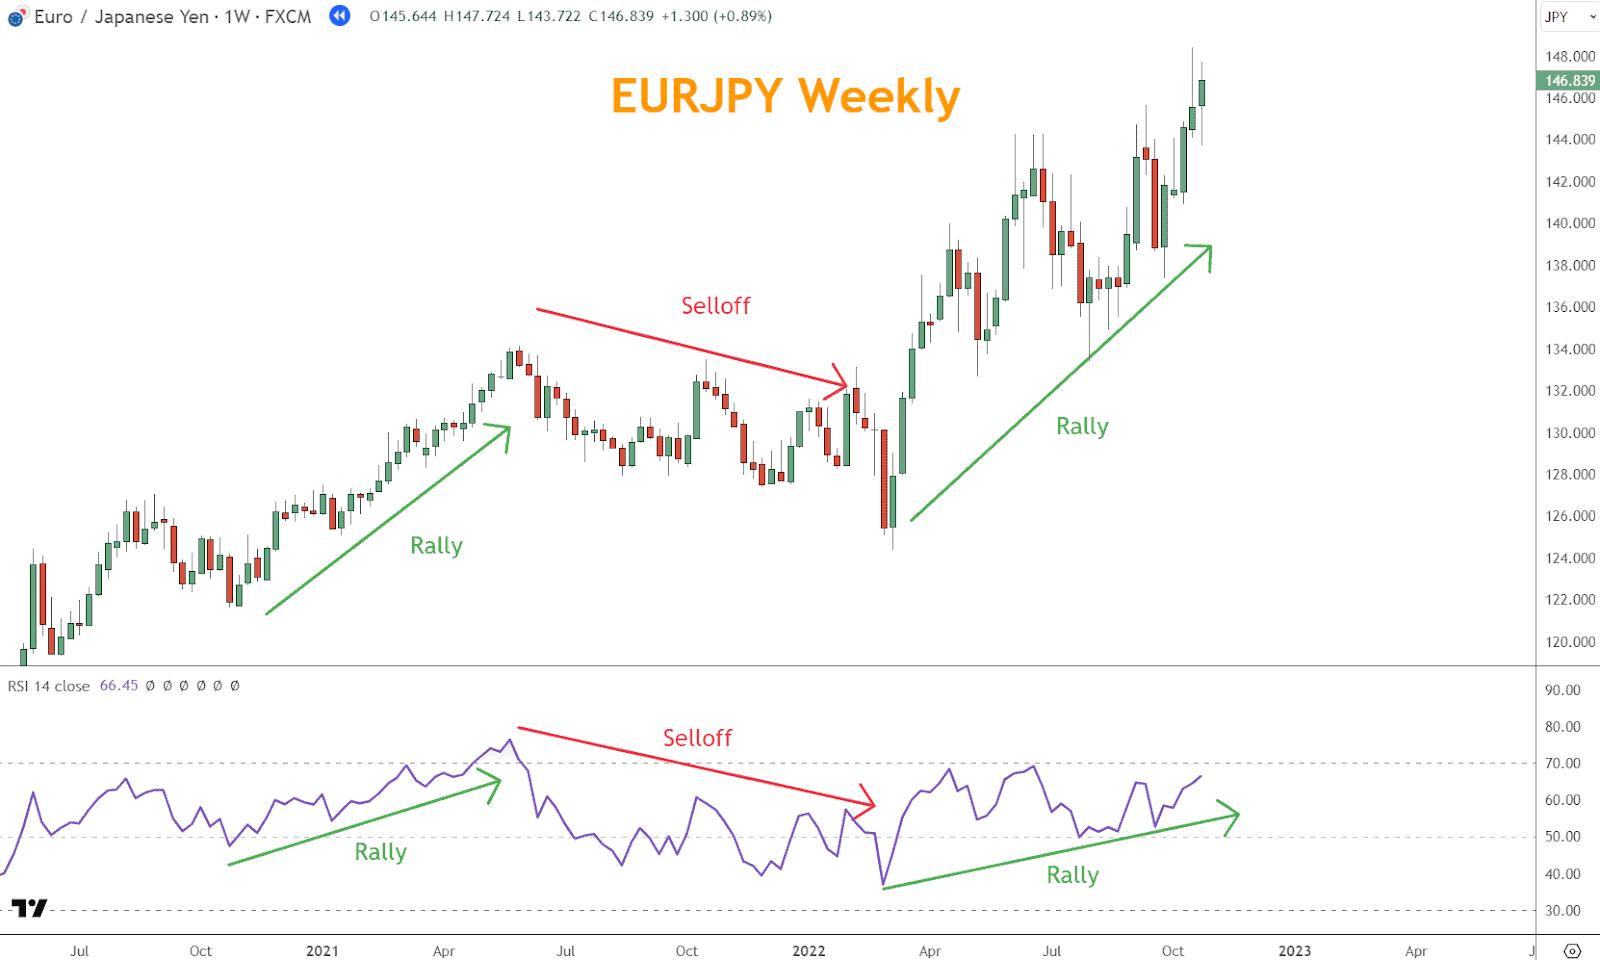
3. Momentum Analysis
Momentum analysis gauges the strength of a price move.
Key Indicators
- RSI (Relative Strength Index): Detects overbought/oversold conditions and divergences
- MACD (Moving Average Convergence Divergence): Measures price trend shifts
How to Use Momentum
- Confirm trend direction
- Spot early trend weakening or strengthening
Example: In EURJPY, a rising RSI aligns with bullish price action. When the price declines, the RSI also falls, confirming the trend.
Looking for a Strategy?
Download the Six Basics of Chart Analysis and sign up for Forex Forecast to learn a bottom-up approach to analyzing Forex markets and weekly market updates.
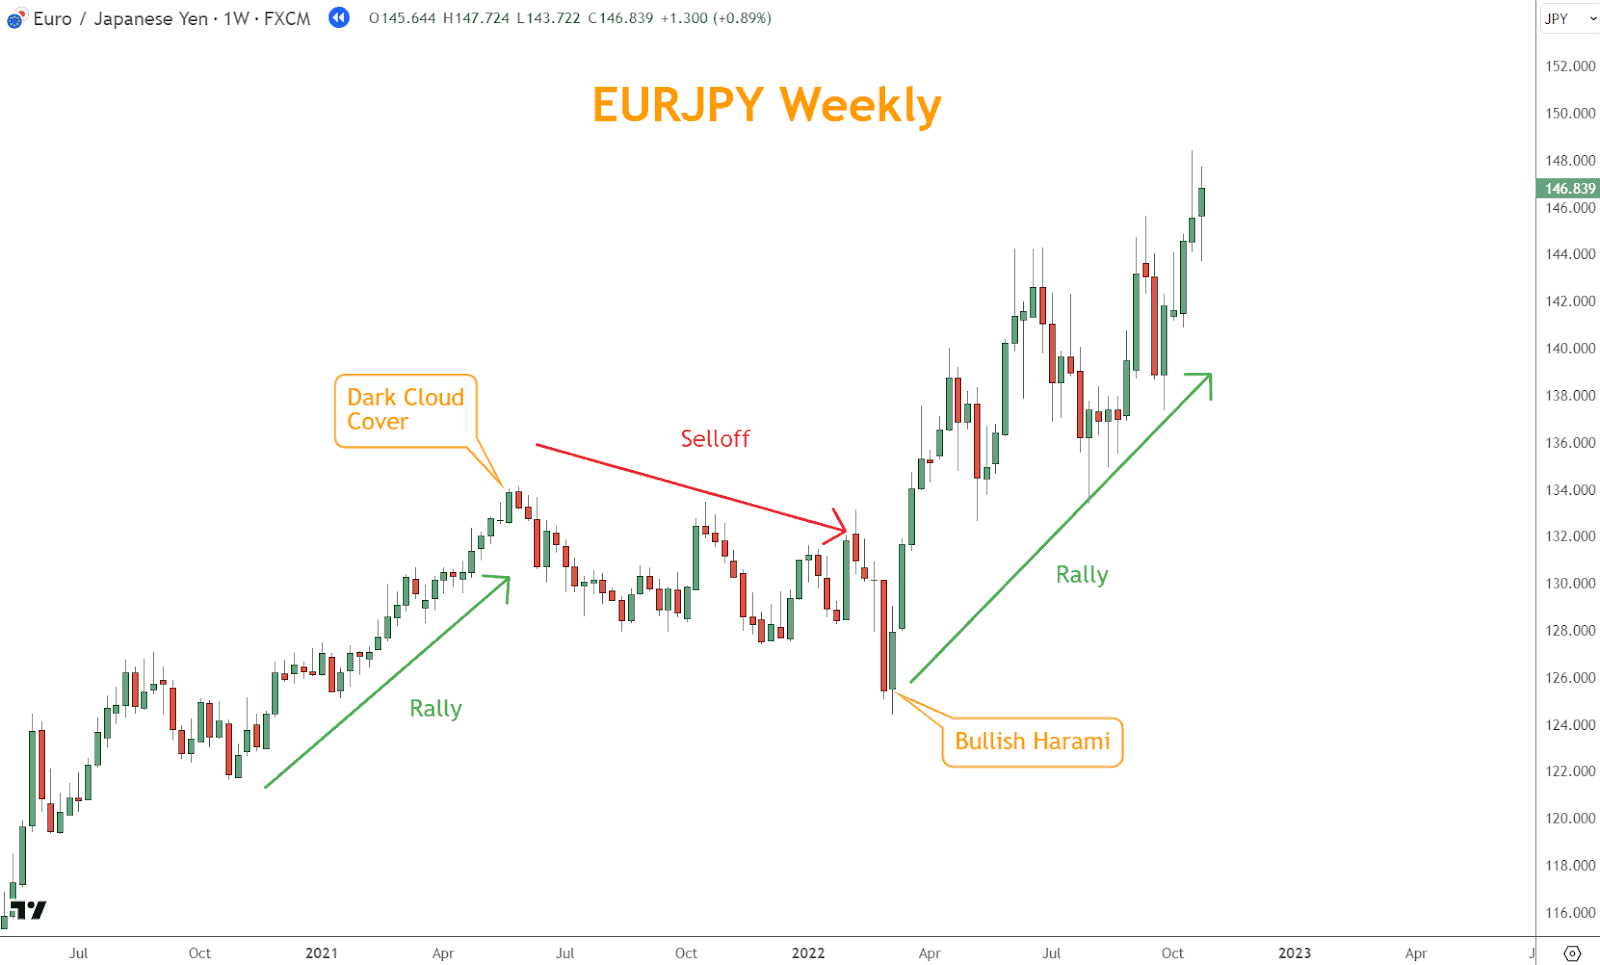
4. Japanese Candlesticks
Candlestick patterns provide insight into market sentiment and price action within each time period.
What to Look For
- Bullish Candles: Price closed higher (green/white)
- Bearish Candles: Price closed lower (red/black)
Patterns to Know
- Engulfing
- Doji
- Hammer
- Shooting Star
- Harami
Why They Matter
Patterns confirm reversals, trend continuations, or indecision points.
Example: A Dark Cloud Cover pattern marks a selloff, followed by a Bullish Harami, signaling the resumption of the rally.
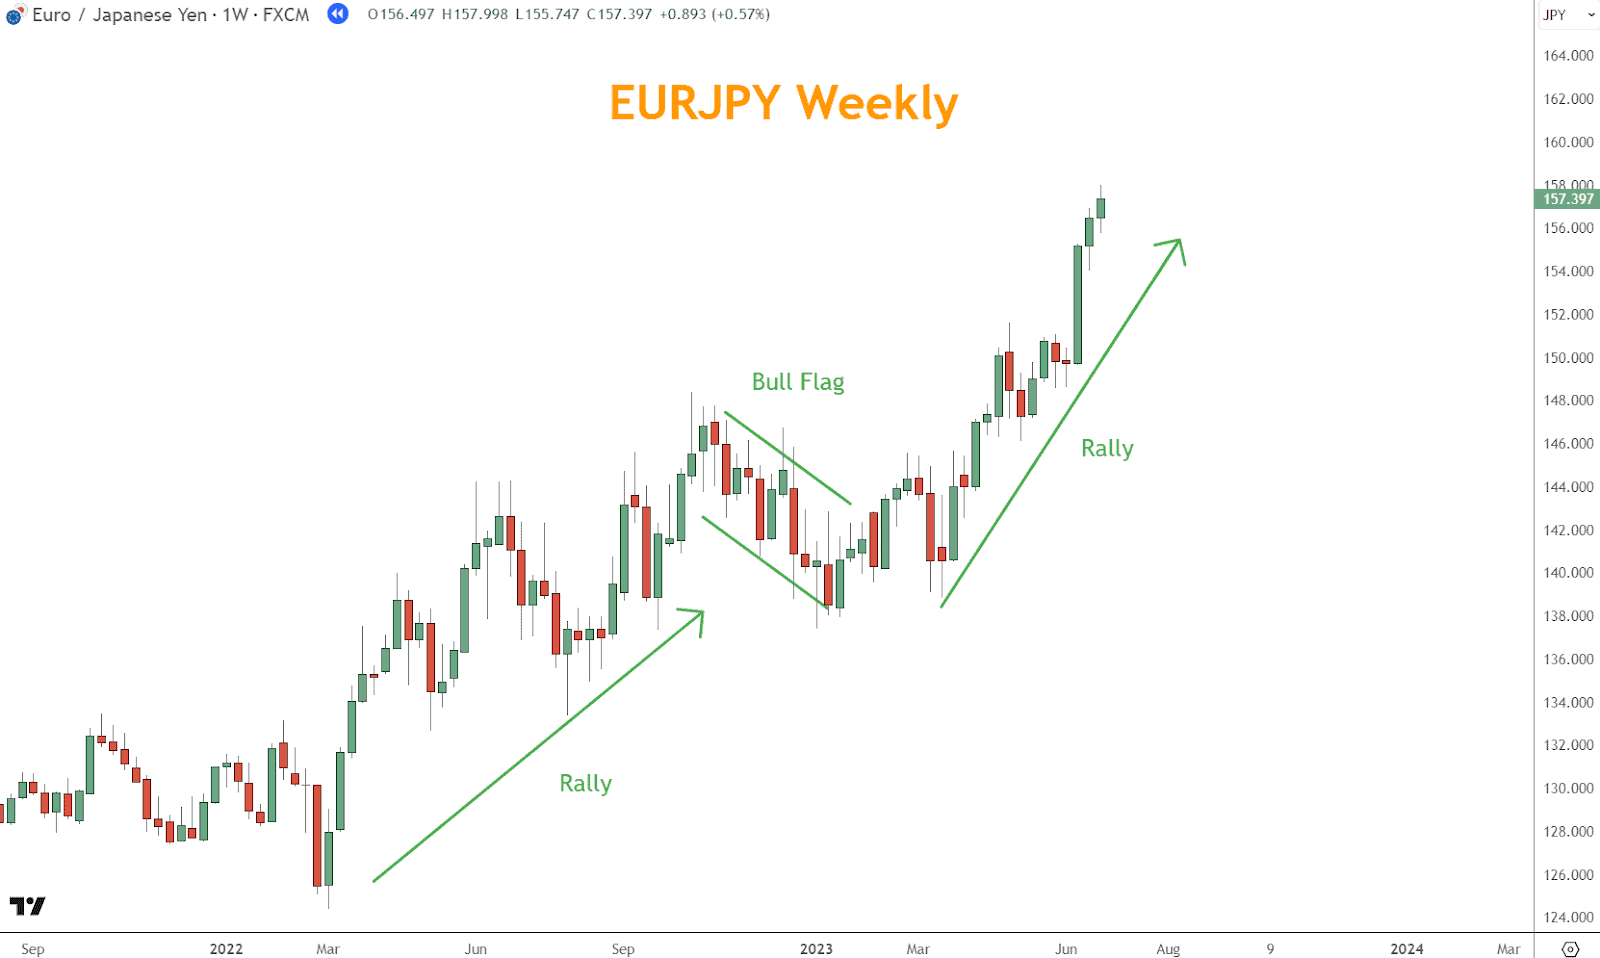
5. Chart Patterns
Chart patterns offer insight into crowd behavior and price structure.
Common Patterns
- Triangles: Continuation or reversal
- Head and Shoulders: Reversal
- Double Top/Bottom: Reversal
- Flags/Pennants: Consolidation before continuation
Using Chart Patterns
Recognizing patterns helps you anticipate price moves and adjust strategies accordingly.
Example: A Bull Flag pattern separates two rallies, signaling temporary consolidation in a bullish trend.
Practical Tips for Reading Forex Charts
Here are five ways to improve how you read a Forex chart analysis workflow:
1. Choose the Right Chart Type
Select a visual format that suits your strategy and keeps the chart uncluttered.
2. Select the Right Timeframe
Match the chart timeframe to your trading style:
- Scalping: 1–5 minutes
- Swing Trading: Daily
- Position Trading: Weekly or Monthly
3. Customize Your Chart
Adjust colors, line thickness, and background to enhance clarity and personal comfort.
4. Use Indicators Sparingly
Avoid overcrowding your chart with indicators. Stick to a few key ones that complement your analysis.
5. Use Drawing Tools
Mark support/resistance, trendlines, or channels to better visualize price behavior.
Review and update your chart setup regularly to stay aligned with market changes and your trading goals.

Conclusion
Reading a Forex chart is a foundational skill that empowers traders to analyze the market with confidence.
By mastering trend analysis, support/resistance, momentum tools, candlestick patterns, and chart formations, you build a reliable process to interpret price action. Combine these tools with practical habits to sharpen your trading edge.
What’s the Next Step?
Evaluate your current chart-reading skills and identify which of the five techniques you can begin using today.
Need a structured approach? Download The Six Basics of Chart Analysis—your free foundation for better technical analysis.
You’ll also receive Forex Forecast, our free weekly newsletter with:
- Trade ideas using the Six Basics
- Real-world case studies
- Educational guides and videos
- Links to new articles and upcoming webinars
Get started today—it’s 100% free.
Download the Six Basics of Chart Analysis and Subscribe to Forex Forecast

What Are the Different Types of Forex Charts?
Line, bar, and candlestick charts are the most common. Each offers unique benefits for visualizing price movement.
Frequently Asked Questions
How Can I Identify Trends on a Forex Chart?
Watch for patterns of higher highs/lows or lower highs/lows. Use trendlines and moving averages to confirm direction.
What Are Support and Resistance Levels, and How Do I Use Them?
Support levels are price floors, and resistance levels are ceilings. Use them to set entry/exit points and plan breakouts or reversals.
How Do I Use Technical Indicators When I Read a Forex Chart?
Technical indicators, such as the LSMA and TSI, help you evaluate momentum and identify potential entry/exit signals. Use a small set to confirm your analysis.
What Are the Best Practices for Reading a Forex Chart?
Start with a single currency pair, stay disciplined, use multiple timeframes, and combine chart reading with economic awareness.
Forex Trading Disclosure Statement
Risk Warning:
Forex trading involves significant risk and may not be suitable for all investors. The leveraged nature of Forex trading can work both for and against you, leading to substantial gains or losses. Before trading Forex, you should carefully consider your financial objectives, experience level, and risk tolerance. It is possible to lose more than your initial investment, and you should only trade with money you can afford to lose.
Market Risks and Volatility:
Forex markets are influenced by global economic, political, and social events, which can result in unpredictable price movements. High market volatility can lead to sudden and substantial changes in currency values, potentially causing losses that exceed your initial deposit.
Leverage Risks:
Leverage amplifies both potential gains and potential losses. While leverage can increase profitability, it also increases the risk of significant losses, including the loss of your entire trading capital.
Trading Tools and Technology Risks:
Forex trading platforms, including those offered by brokers, are subject to technology risks, such as system failures, latency issues, and potential errors in price feeds. Traders should be aware that these risks can impact the execution of trades and trading outcomes.
No Guarantee of Profitability:
Past performance in Forex trading is not indicative of future results. There is no guarantee that you will achieve profits or avoid losses when trading Forex. Market conditions and individual trading strategies vary, and no trading system can eliminate the inherent risks of Forex trading.
Educational Purposes Only:
Any information provided about Forex trading, including strategies, analysis, or market commentary, is for educational purposes only and should not be considered financial advice. Consult a qualified financial advisor or tax professional before making any trading decisions.
Regulatory Compliance:
Forex trading is regulated differently in various jurisdictions. Ensure that you are trading with a licensed and compliant broker in your country of residence.
Responsibility:
You are solely responsible for your trading decisions and the associated risks. You must understand the terms and conditions of Forex trading, including margin requirements, stop-losses, and other risk management tools.
Acknowledgment:
By engaging in Forex trading, you acknowledge that you have read, understood, and accepted this disclosure statement. You assume full responsibility for the outcomes of your trading decisions and agree to trade at your own risk.