
Doji and Spinning Top candlestick patterns are powerful indicators of market indecision. Their correct interpretation can mean the difference between profit and loss.
Originating in 17th-century Japan, these patterns provide visual cues about potential future price movements based on historical action.
In this guide, you’ll learn what these patterns are, how they differ, and how to trade them effectively. We’ll also explore their use with tools like RSI, chart patterns, and support/resistance for more accurate trading decisions.
Quick Reference: Doji vs. Spinning Top
| Pattern | Body Size | Shadows | Market Meaning | Best Use Cases |
| Doji | Very small or none | Can be short or long | Direct balance between buyers and sellers | Potential reversal after strong trend, stop level at extremes |
| Spinning Top | Small (but larger than Doji) | Long upper and lower shadows | Tug-of-war without clear winner | Warning of momentum loss, stop level at extremes |
Table of Contents
- Quick Reference: Doji vs. Spinning Top
- Understanding Candlestick Basics
- The Doji Pattern
- The Spinning Top Pattern
- Comparing Indecision Candle Patterns
- Practical Tips for Trading with These Patterns
- Using Indecision Candles with RSI
- Combining with Chart Patterns
- Combining with Support and Resistance
- Conclusion
- What’s the Next Step?
- Frequently Asked Questions (FAQ)
- Forex Trading Disclosure Statement
Understanding Candlestick Basics
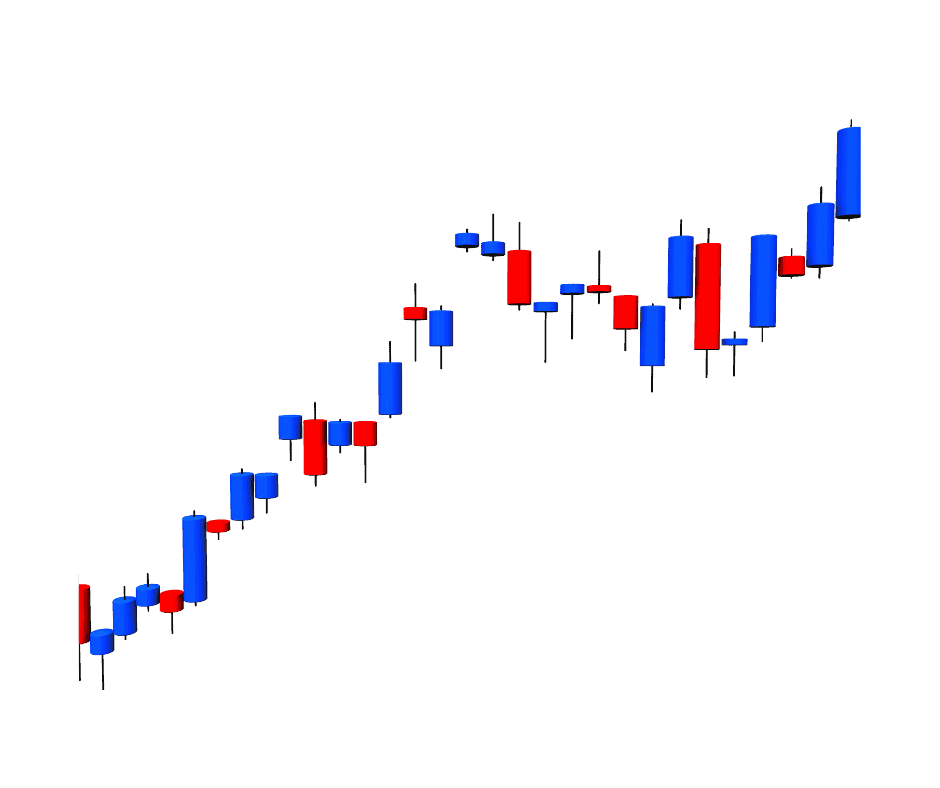
Before diving into specific patterns, it’s essential to understand the foundation of candlestick analysis. Candlesticks visually represent market sentiment within a set time frame.
A candlestick includes:
- Open and close (body height shows the difference).
- High and low (wicks or shadows show extremes).
- Color indicating bullish (close higher than open) or bearish (close lower than open) sentiment.
By studying the shape, size, and placement of candles, you gain insight into market direction and potential shifts in sentiment.
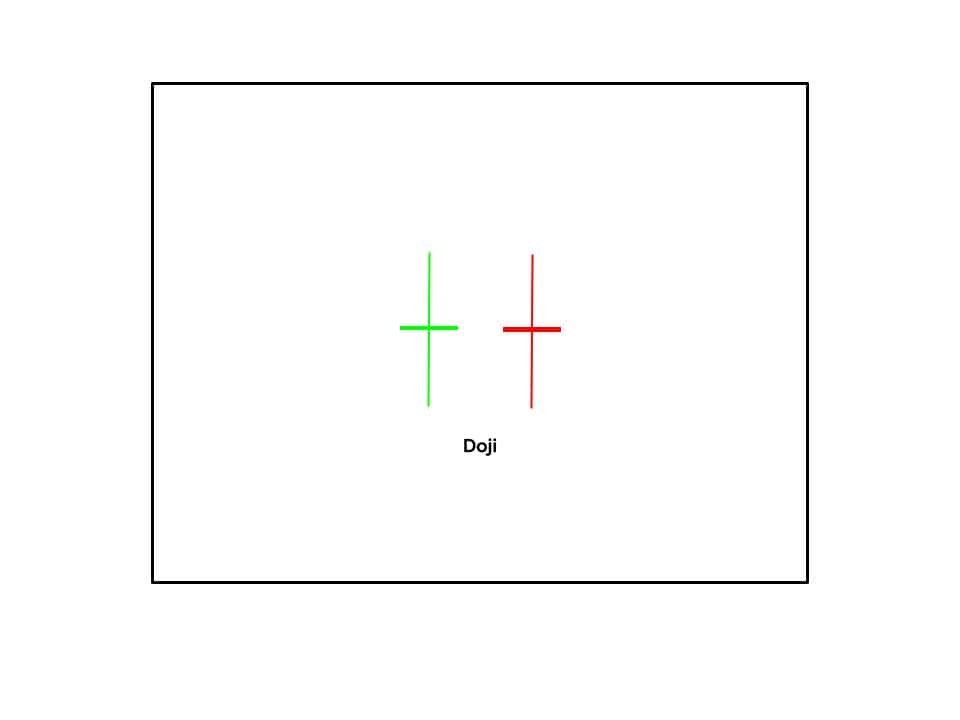
The Doji Pattern
The Doji stands out because it shows almost no difference between the opening and closing price. This reflects a precise balance between buyers and sellers.
Key Types of Doji:
- Neutral Doji – Small shadows, symmetrical indecision.
- Long-Legged Doji – Extended upper and lower shadows.
- Dragonfly Doji – Open/close at the high of the session.
- Gravestone Doji – Open/close at the low of the session.
When it appears after a strong uptrend or downtrend, a Doji can signal a potential trend reversal.
Its significance depends heavily on market context and the candles that follow.
Practical uses:
- Stop level at price extremes.
- Pre-breakout or breakdown signal in consolidations.
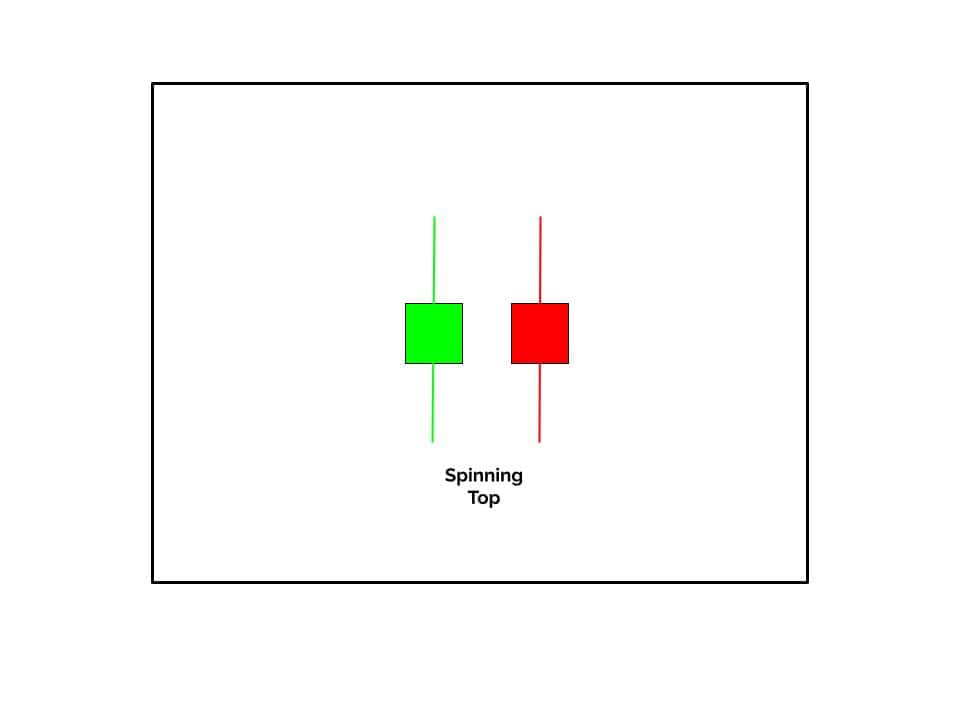
The Spinning Top Pattern
A Spinning Top has a small body with long upper and lower shadows.
It shows that both buyers and sellers were active during the period, but neither gained control.
This pattern signals possible momentum loss and may precede either a continuation or a reversal.
Its significance is greatest when evaluated alongside prior and subsequent candles, as well as other indicators.
Practical uses:
- Stop level at price extremes before rallies or selloffs.
- Early warning for momentum slowdown.
Comparing Indecision Candle Patterns
While both patterns indicate market indecision, their structure and meaning differ.
- Doji: Almost non-existent body; pure equilibrium between buying and selling pressure.
- Spinning Top: Small but visible body; active contest with no clear winner.
Both patterns require contextual analysis — they are most meaningful after strong trends or near significant support/resistance.
Practical Tips for Trading with These Patterns
Trading Doji and Spinning Top patterns is about strategic application, not just recognition.
- In trending markets, they can warn of potential reversals.
- In sideways markets, they often produce less reliable signals due to volatility.
- Indecision candles inside a range may be part of normal noise, making range trading more challenging than trend trading.
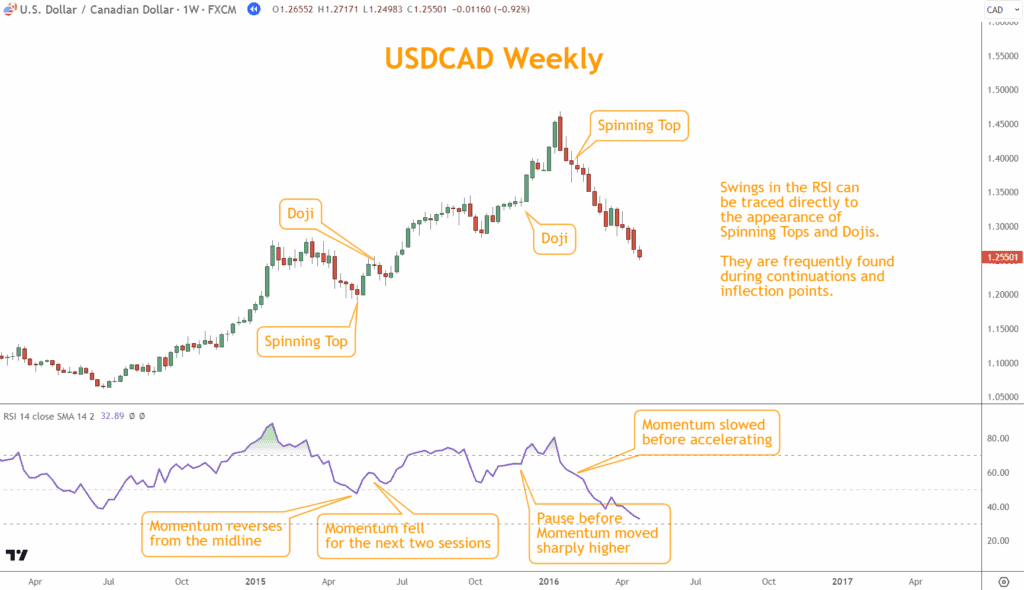
Using Indecision Candles with RSI
The Relative Strength Index (RSI) measures momentum and overbought/oversold conditions.
How to combine with Doji and Spinning Top:
- Doji at RSI > 70 → Bearish reversal signal.
- Spinning Top at RSI < 30 → Bullish reversal signal.
Example:
- April 2015: Spinning Top marks retracement end, RSI at midline — entry signal.
- July 2015: Doji + overbought RSI — take-profit signal.
- January 2016: Spinning Top after reversal + RSI dropping from overbought — bearish entry.
Looking for a Strategy?
Download the Six Basics of Chart Analysis and sign up for Forex Forecast to learn a bottom-up approach to analyzing Forex markets and weekly market updates.
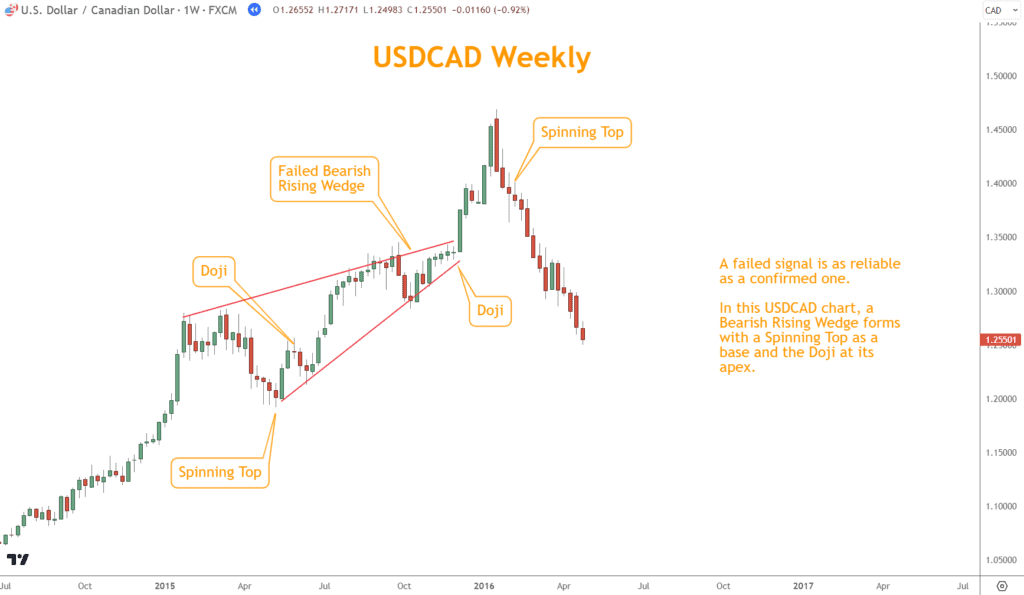
Combining with Chart Patterns
When these candles appear inside larger chart formations (e.g., Rising Wedge, Double Top, Triangle), they can confirm or invalidate the pattern.
Example:
- A Bearish Rising Wedge with a Doji at the apex could indicate a potential breakdown — if it fails, traders may anticipate the rally to continue.
- The Doji’s low can serve as a stop-loss placement for trades in the opposite direction.
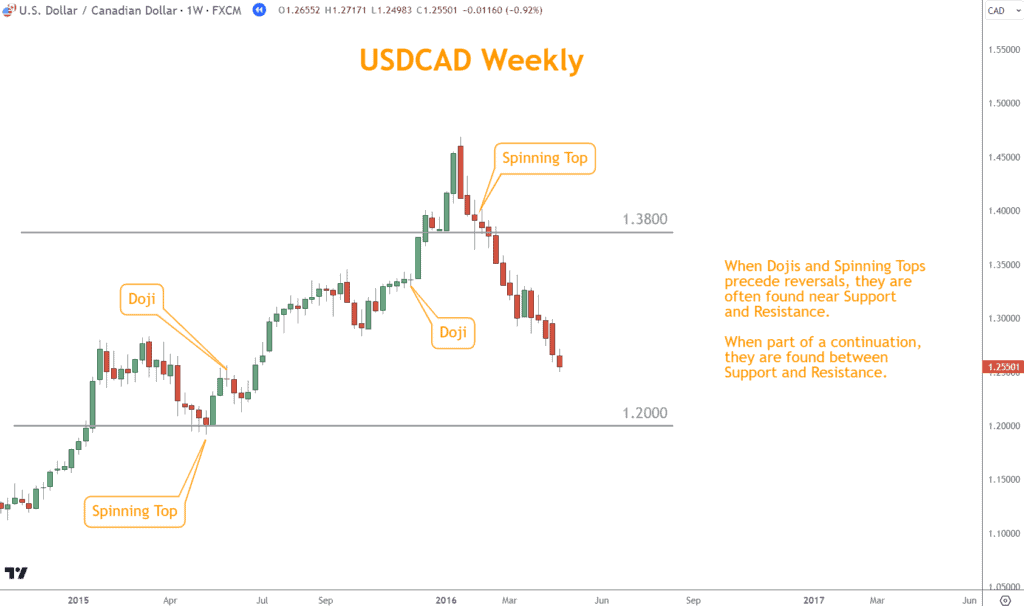
Combining with Support and Resistance
Support and Resistance levels mark key market reaction zones.
When Doji or Spinning Top appears near these levels:
- At resistance after a rally → Possible reversal.
- At support during a selloff → Possible bounce.
Example:
- Spinning Top at 1.2000 support → rally continuation.
- Doji after consolidation → breakout rally.
- Spinning Top before drop under 1.3800 → short setup.
Conclusion
Doji and Spinning Top patterns are essential indicators of market sentiment shifts.
They gain strength when used with momentum indicators, chart patterns, and support/resistance analysis.
Mastering these patterns — and applying them within a structured trading plan — improves decision-making and trade accuracy.
What’s the Next Step?
- Open a chart and mark recent Doji and Spinning Top patterns.
- Compare them with RSI, chart patterns, and support/resistance levels.
- Apply the Six Basics of Chart Analysis for deeper context.
When you sign up for Forex Forecast, you’ll receive:
- Weekly trade ideas.
- The Six Basics of Chart Analysis e-book.
- Educational guides and videos.
- Exclusive Position Forex updates.

Frequently Asked Questions (FAQ)
What is a Doji Candlestick Pattern?
A candlestick with a very small or nonexistent body, indicating nearly equal open and close prices.
How Do These Patterns Differ?
A Doji has almost no body, while a Spinning Top has a small but visible one.
Can I Trade Solely on These Patterns?
Not recommended. Use them with other tools for confirmation.
How Do I Confirm the Validity?
Look for follow-up candles and indicators such as RSI or key support/resistance levels.
Do They Appear Often?
Yes, but they’re most significant when they occur after strong trends or near major levels.
Are False Signals Possible?
Yes — that’s why confirmation is essential.
Forex Trading Disclosure Statement
Risk Warning:
Forex trading involves significant risk and may not be suitable for all investors. The leveraged nature of Forex trading can work both for and against you, leading to substantial gains or losses. Before trading Forex, you should carefully consider your financial objectives, experience level, and risk tolerance. It is possible to lose more than your initial investment, and you should only trade with money you can afford to lose.
Market Risks and Volatility:
Forex markets are influenced by global economic, political, and social events, which can result in unpredictable price movements. High market volatility can lead to sudden and substantial changes in currency values, potentially causing losses that exceed your initial deposit.
Leverage Risks:
Leverage amplifies both potential gains and potential losses. While leverage can increase profitability, it also increases the risk of significant losses, including the loss of your entire trading capital.
Trading Tools and Technology Risks:
Forex trading platforms, including those offered by brokers, are subject to technology risks, such as system failures, latency issues, and potential errors in price feeds. Traders should be aware that these risks can impact the execution of trades and trading outcomes.
No Guarantee of Profitability:
Past performance in Forex trading is not indicative of future results. There is no guarantee that you will achieve profits or avoid losses when trading Forex. Market conditions and individual trading strategies vary, and no trading system can eliminate the inherent risks of Forex trading.
Educational Purposes Only:
Any information provided about Forex trading, including strategies, analysis, or market commentary, is for educational purposes only and should not be considered financial advice. Consult a qualified financial advisor or tax professional before making any trading decisions.
Regulatory Compliance:
Forex trading is regulated differently in various jurisdictions. Ensure that you are trading with a licensed and compliant broker in your country of residence.
Responsibility:
You are solely responsible for your trading decisions and the associated risks. It is your duty to understand the terms and conditions of Forex trading, including margin requirements, stop-losses, and other risk management tools.
Acknowledgment:
By engaging in Forex trading, you acknowledge that you have read, understood, and accepted this disclosure statement. You accept full responsibility for the outcomes of your trading decisions and agree to trade at your own risk.