
Horizontal Support and Resistance play a significant role in predicting reversals in Forex trading.
These price levels serve as invisible “walls” that price struggles to move beyond. Understanding them helps traders make more informed decisions about when to buy or sell.
When combined with technical indicators, these areas become powerful components in your overall trading strategy. This guide explains what these levels are, why they matter, and how to use them effectively.
TL;DR
If you are new to Support and Resistance, here’s what matters most:
- Support is where price tends to stop falling due to increased buying pressure.
- Resistance is where the price tends to stop rising due to increased selling pressure.
- These levels repeat because they reflect past market behavior and trader psychology.
- The best use of Support and Resistance comes when combined with:
- Momentum indicators
- Japanese Candlestick patterns
- Chart Patterns
- Momentum indicators
- Treat these levels as zones, not exact numbers, and confirm them with multiple signals before acting.
What Are Horizontal Support and Resistance Basics?
Support and Resistance form the foundation of technical analysis and are used across all trading styles.
To understand them clearly, keep these key points in mind:
- Support is the price level at which the decline stops because demand increases.
- Resistance is the price level at which the market stops rising because sellers become more active.
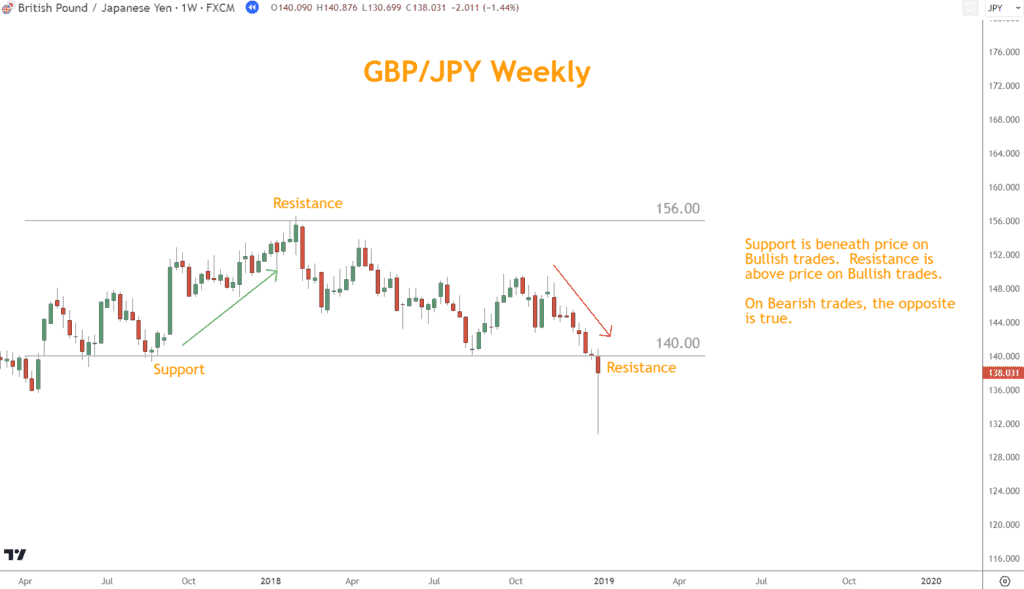
- In long trades, Support sits below the price and Resistance above.
- In short trades, the roles reverse.
- These levels come from historical data showing where market participants previously drove prices to reverse or stall.
Recognizing these areas improves your ability to anticipate turning points and create better trade plans.
How Can I Identify Them?
Identifying Support and Resistance requires both technical skill and price-action awareness. You can spot these levels by evaluating previous reactions on the chart.
Key methods include:
- Historical reaction points: Look for areas where price repeatedly stopped, reversed, or consolidated.
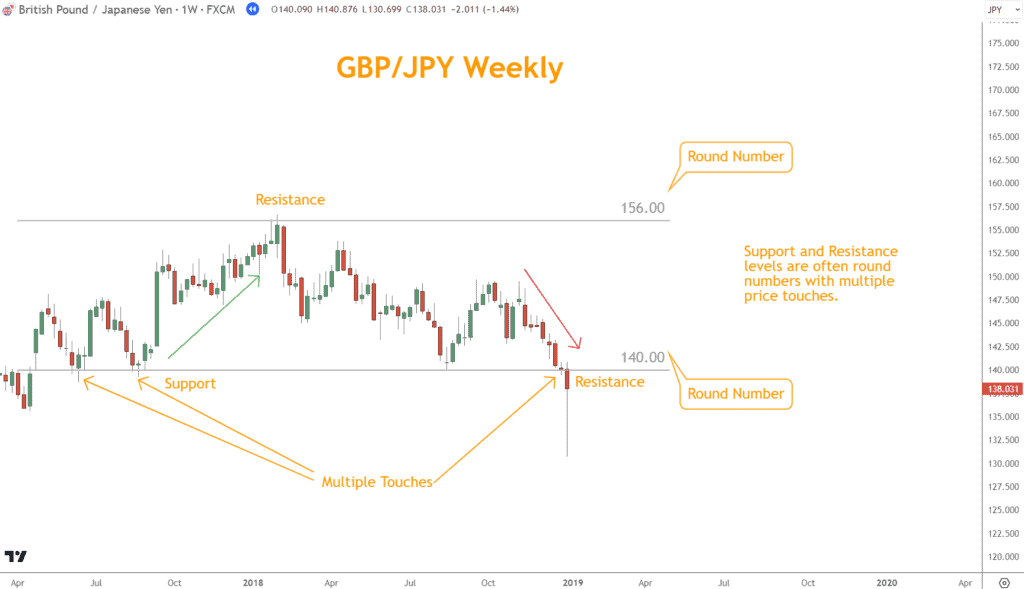
- Round psychological numbers: Prices such as 1.1000 or 150.00 often attract buying or selling interest.
- Repeated tests: Areas that price struggles to break often become major Support or Resistance.
- Wicks and closes: Examine where candles consistently wick into or reject from.
Learning to spot these zones takes practice, but they form the backbone of reliable technical analysis.
How Significant Are These Levels in Forex Trading?
Support and Resistance levels are some of the most widely used tools in currency trading because they provide clarity and structure. They shape trade entries, exits, risk management, and trend assessment.
These levels are significant because:
- They define ideal locations for stop-loss and take-profit placement.
- They offer buying opportunities at Support and selling opportunities at Resistance.
- They reveal the strength or weakness of a market direction by observing reactions near the level.
- They help traders determine whether a trend may continue or reverse.
By learning to judge the significance of a Support or Resistance area, you significantly improve your ability to anticipate future price behavior.
Looking for a Strategy?
Download the Six Basics of Chart Analysis and sign up for Forex Forecast to learn a bottom-up approach to analyzing Forex markets and weekly market updates.
Should You Trade Them Alone?
Relying solely on horizontal Support and Resistance is not advisable because markets often provide misleading or incomplete signals. Combining these levels with additional indicators increases the probability of accurate decisions.
Momentum Indicators
These tools help you identify Bullish or Bearish momentum and Overbought or Oversold conditions:
- Relative Strength Index (RSI)
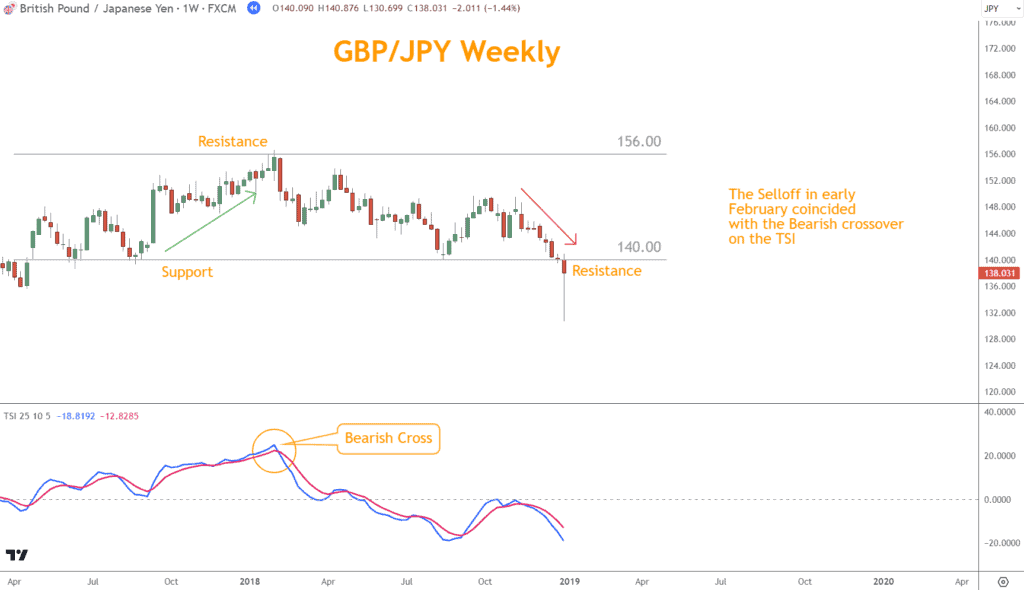
- True Strength Index (TSI)
- Stochastic Oscillator
In the GBP/JPY example below, the rally to 156.00 reverses lower in tandem with the bearish TSI cross.
Japanese Candlesticks
Candlesticks reflect trader psychology and provide visual cues for reversals. Examples include:
- Hammers
- Engulfing patterns
- Morning and Evening Stars
- Shooting Stars
In the following example, the GBP/JPY reversal lower is driven by the bearish One Black Crow candlestick pattern.
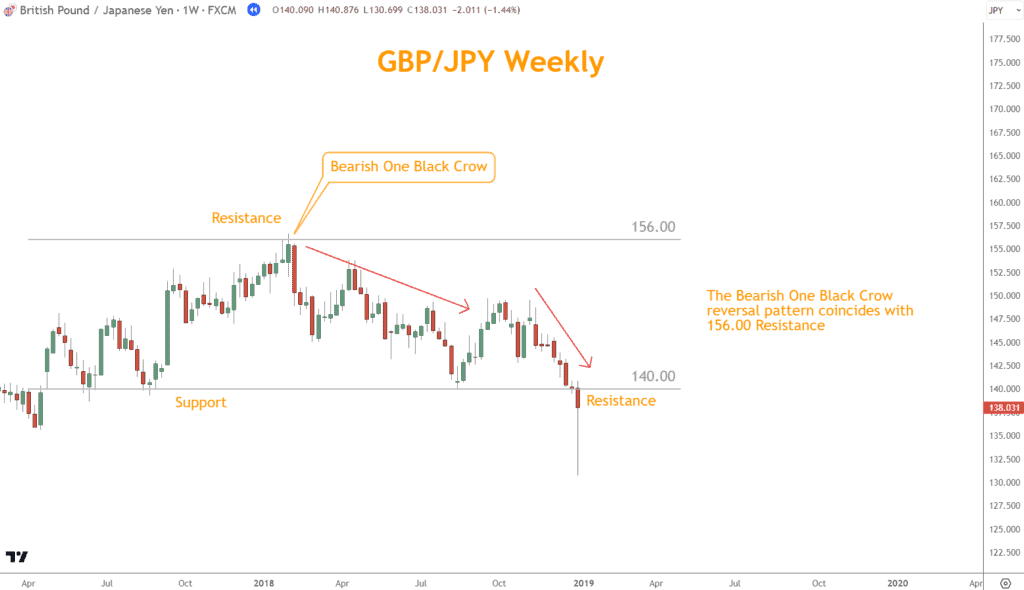
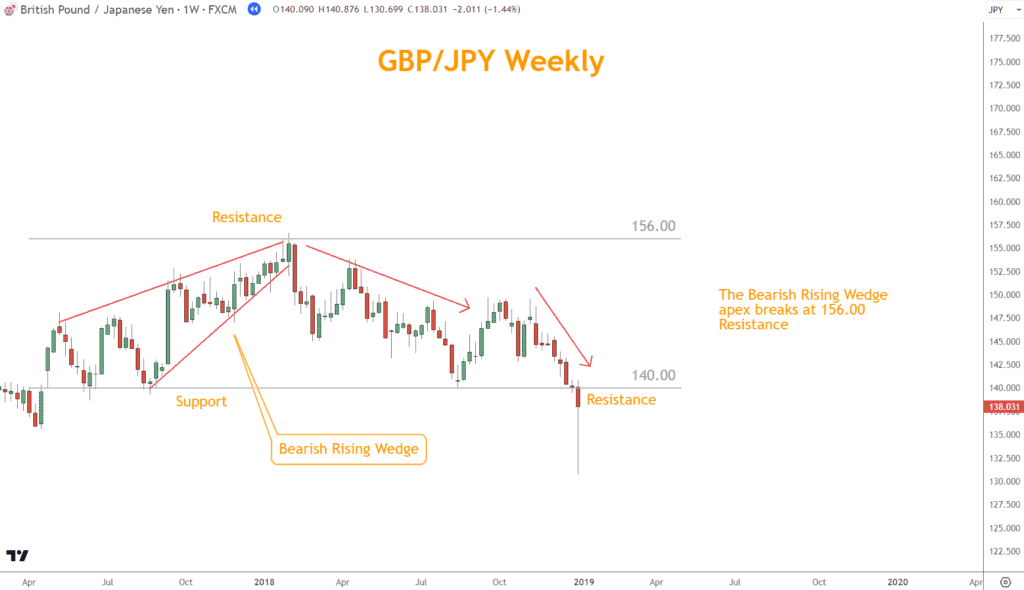
Chart Patterns
These help predict continuation or reversal movements:
- Head and Shoulders
- Triangles
- Wedges
The bearish Rising Wedge pattern in this example peaks and breaks its apex at 156.00 resistance.
Using these tools with Support and Resistance creates a multi-layered analysis that improves accuracy and confidence.
Mastering the Nuances: Tips for Accurate Analysis
Table: Nuances for Accurate Support and Resistance Analysis
| Nuance | What It Means | Why It Helps |
| More tests strengthen a level | The more often a price revisits a level without breaking it, the stronger the level becomes | Indicates a reliable reaction zone |
| Watch for false breakouts | Price may briefly breach a level before reversing | Helps avoid traps and premature entries |
| Look for confluence | Use momentum, candlesticks, and chart patterns near levels | Strengthens confirmation and reduces false signals |
| Avoid single-signal decisions | Never rely on one indicator alone | Improves decision quality through multi-factor validation |
| Treat levels as zones | Levels are rarely exact prices | Prevents errors from overly precise expectations |
Conclusion
Support and Resistance serve as essential guideposts in Forex trading, helping you anticipate where price action may pause, reverse, or break.
By studying these areas, you gain insight into market behavior and the psychology that drives buying and selling.
When combined with indicators like Momentum tools, Candlestick patterns, and Chart Patterns, Support and Resistance become even more powerful. This integrated approach leads to more reliable and informed trading decisions.
Quiz: Test Your Knowledge of Support and Resistance
Questions
- What defines a Support level in Forex trading?
a. A price level where selling pressure increases
b. A price level where price action tends to stop falling due to buying interest
c. A price level used only in short trades
d. A price level created by automated trading systems - Why do round numbers often act as Support or Resistance?
a. They are mathematically easier for algorithms to calculate
b. Traders often place orders near them, creating psychological reaction points
c. They move more slowly than other price levels
d. They cannot be broken by market momentum - Which additional tools help confirm Support and Resistance levels?
a. Moving averages only
b. Fibonacci retracements only
c. Momentum indicators, Japanese Candlesticks, and Chart Patterns
d. Earnings reports and government policy - What does it indicate when a level is tested multiple times without breaking?
a. The level is weakening
b. The level becomes stronger and more reliable
c. It guarantees reversal
d. It means traders should ignore the level - Why should support and resistance be treated as zones instead of exact prices?
a. Because indicators require a margin of error
b. Because price rarely reacts to a single precise number
c. Because brokers require wider price levels
d. Because round numbers do not apply to Forex
Answer Key
- b
- b
- c
- b
- b
What’s the Next Step?
Select a chart and practice identifying Support and Resistance zones using what you learned in this article. Then, add Momentum indicators, Candlestick patterns, and Chart Patterns to see how they interact with these levels.
If you want a structured framework that ties all these tools together, you can download the Six Basics of Chart Analysis for free.
You will also receive Forex Forecast, delivered every Sunday, featuring:
- Trade ideas using the Six Basics
- Case studies from real trades
- Guides and video lessons
- Alerts for new articles and updates
- PositionForex.com updates
- Webinars and exclusive tools

And it is entirely free.
Frequently Asked Questions
What Are Support and Resistance Levels in Forex Trading?
These are horizontal lines on a chart that mark historical price areas where the market struggled to move above or below. They act as barriers and help traders spot reversals or breakouts.
How Do You Identify and Draw Support and Resistance Levels?
Look for repeated historical reversal points.
Use:
- Past price swings
- Round psychological numbers
- Horizontal lines marking reaction zones
These levels should be considered zones rather than fixed prices.
Can Support and Resistance Levels Break? What Does It Mean?
Yes, they can break. When they do:
- A Support break often becomes new resistance
- A Resistance break often becomes new support
These breaks signal shifting market sentiment and may indicate trend continuation or a new directional move.
Forex Trading Disclosure Statement
Risk Warning:
Forex trading involves significant risk and may not be suitable for all investors. The leveraged nature of Forex trading can work both for and against you, leading to substantial gains or losses. Before trading Forex, you should carefully consider your financial objectives, experience level, and risk tolerance. It is possible to lose more than your initial investment, and you should only trade with money you can afford to lose.
Market Risks and Volatility:
Forex markets are influenced by global economic, political, and social events, which can result in unpredictable price movements. High market volatility can lead to sudden and substantial changes in currency values, potentially causing losses that exceed your initial deposit.
Leverage Risks:
Leverage amplifies both potential gains and potential losses. While leverage can increase profitability, it also increases the risk of significant losses, including the loss of your entire trading capital.
Trading Tools and Technology Risks:
Forex trading platforms, including those offered by brokers, are subject to technology risks such as system failures, latency issues, and potential errors in price feeds. Traders should be aware that these risks can impact the execution of trades and trading outcomes.
No Guarantee of Profitability:
Past performance in Forex trading is not indicative of future results. There is no guarantee that you will achieve profits or avoid losses when trading Forex. Market conditions and individual trading strategies vary, and no trading system can eliminate the inherent risks of Forex trading.
Educational Purposes Only:
Any information provided about Forex trading, including strategies, analysis, or market commentary, is for educational purposes only and should not be considered financial advice. Consult a qualified financial advisor or tax professional before making any trading decisions.
Regulatory Compliance:
Forex trading is regulated differently in various jurisdictions. Ensure that you are trading with a licensed and compliant broker in your country of residence.
Responsibility:
You are solely responsible for your trading decisions and the associated risks. It is your duty to understand the terms and conditions of Forex trading, including margin requirements, stop-losses, and other risk management tools.
Acknowledgment:
By engaging in Forex trading, you acknowledge that you have read, understood, and accepted this disclosure statement. You accept full responsibility for the outcomes of your trading decisions and agree to trade at your own risk.