
Forex trend types are usually the first thing traders try to identify on a chart.
And on the surface, that makes sense.
If you can find the trend early, trade in its direction, and exit before it ends, trading should be straightforward. That idea is taught to nearly every beginner—and yet most traders still fail.
The problem isn’t that trends don’t matter.
The problem is how traders define, measure, and trade them.
In this article, you’ll learn:
- Why trend trading fails in practice
- How popular indicators mislead traders
- Why trend direction alone is not tradable information
- A better framework for understanding price direction and momentum
Everything here is based on real market behavior and thousands of trades across multiple market cycles.
TL;DR
- Trends describe direction, not opportunity
- Most trend indicators lag price and produce false signals
- Different tools define trends differently, creating inconsistency
- Momentum matters more than trend labels
- Trend should be observed, not used as a standalone filter
Table of Contents
- TL;DR
- What Is the Relationship Between Trends and Currency Values?
- Why Traders Follow Uptrends and Downtrends
- The Three Forex Trend Types
- Why Trend Rules Break Down
- Why Moving Average Trend Strategies Fail
- MACD and ADX Don’t Fix the Problem
- Channel Lines and Trendlines: Visual, But Late
- Why Multi-Timeframe Trend Filters Still Fail
- Trend vs. Momentum: The Missing Link
- What’s the Next Step?
- Quiz: Test Your Understanding
- Forex Trading Disclosure Statement
What Is the Relationship Between Trends and Currency Values?
Currencies don’t trend randomly. They move because of economic forces, not chart patterns.
A classic example is the relationship between crude oil and the Canadian dollar.
Canada is a major oil exporter. When oil prices rise:
- Export revenues increase
- Capital flows improve
- The Canadian dollar tends to strengthen
When oil prices fall, the opposite occurs.
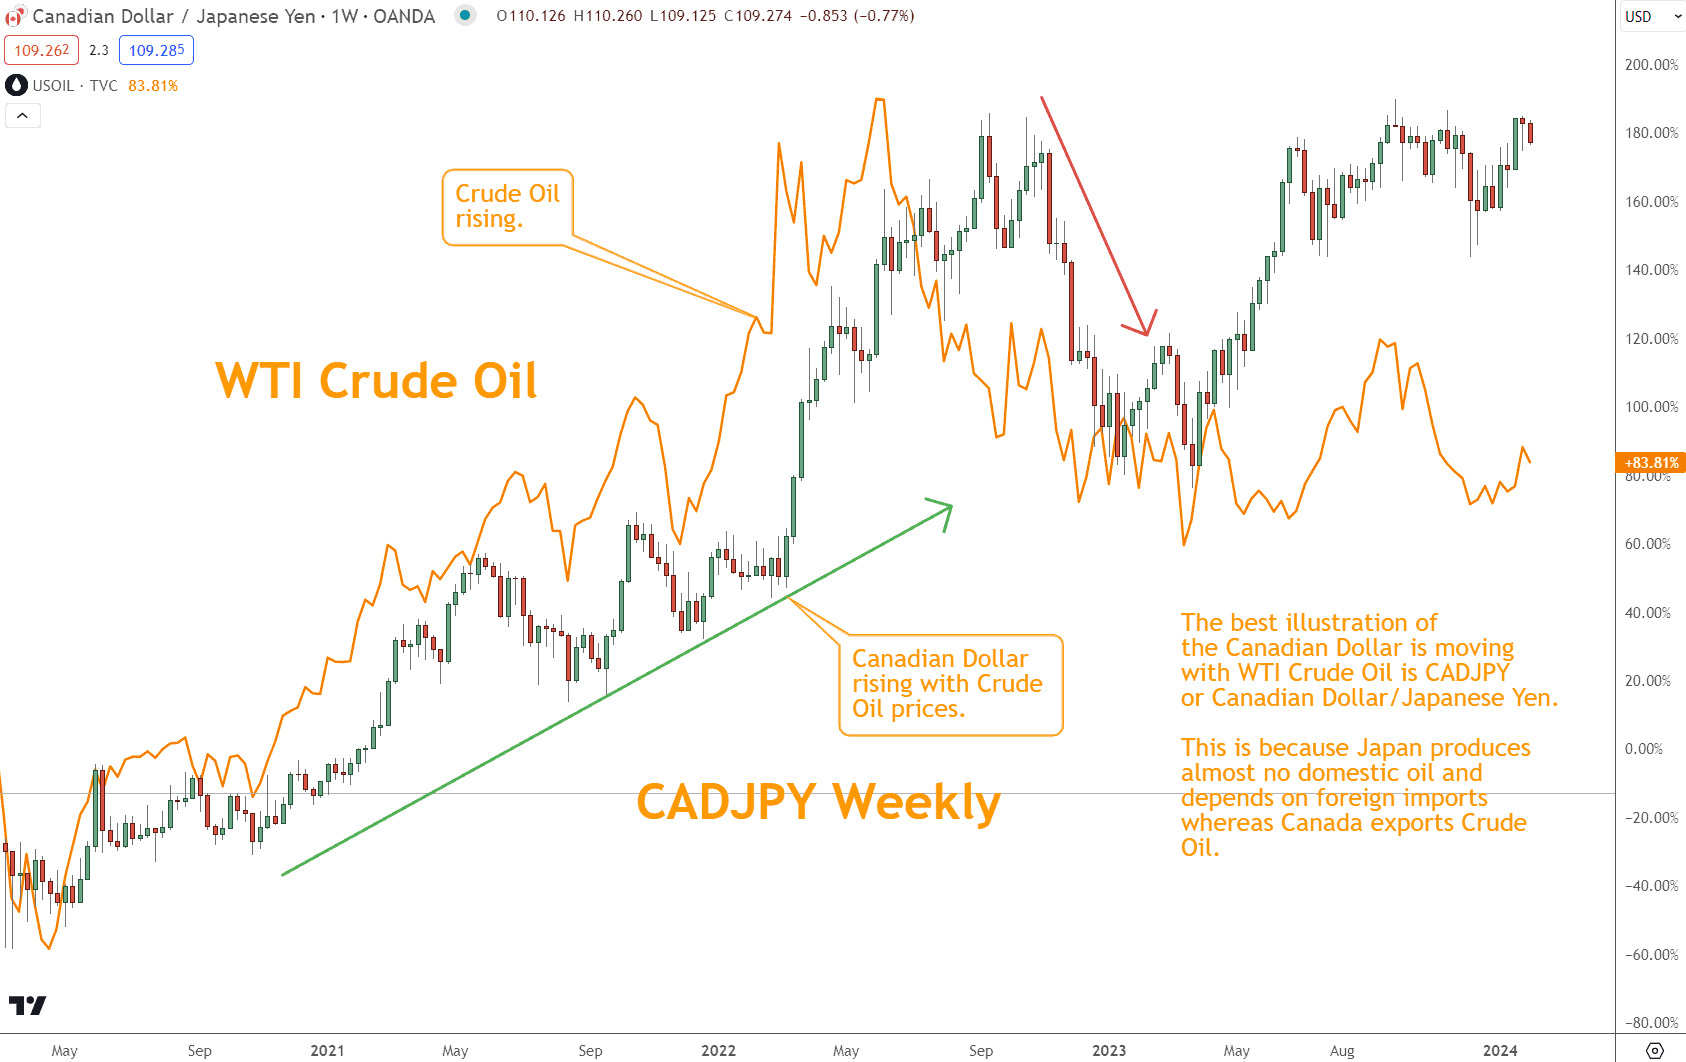
This “petrocurrency” relationship shows why macro drivers create trends, while charts merely reflect them. If you ignore what drives currency values, trend labels become unreliable.
Why Traders Follow Uptrends and Downtrends
The core belief behind trend following is simple:
Find direction → trade with it → avoid countertrend trades
But direction alone doesn’t tell you:
- When to enter
- When momentum is fading
- How long will the trend last
- Whether the move is tradable or exhausted
For example, EUR/JPY rose significantly between 2019 and 2023. On a long-term chart, it appears to be a clean uptrend. But within that period:
- There were deep retracements
- Long consolidations
- Extended drawdowns
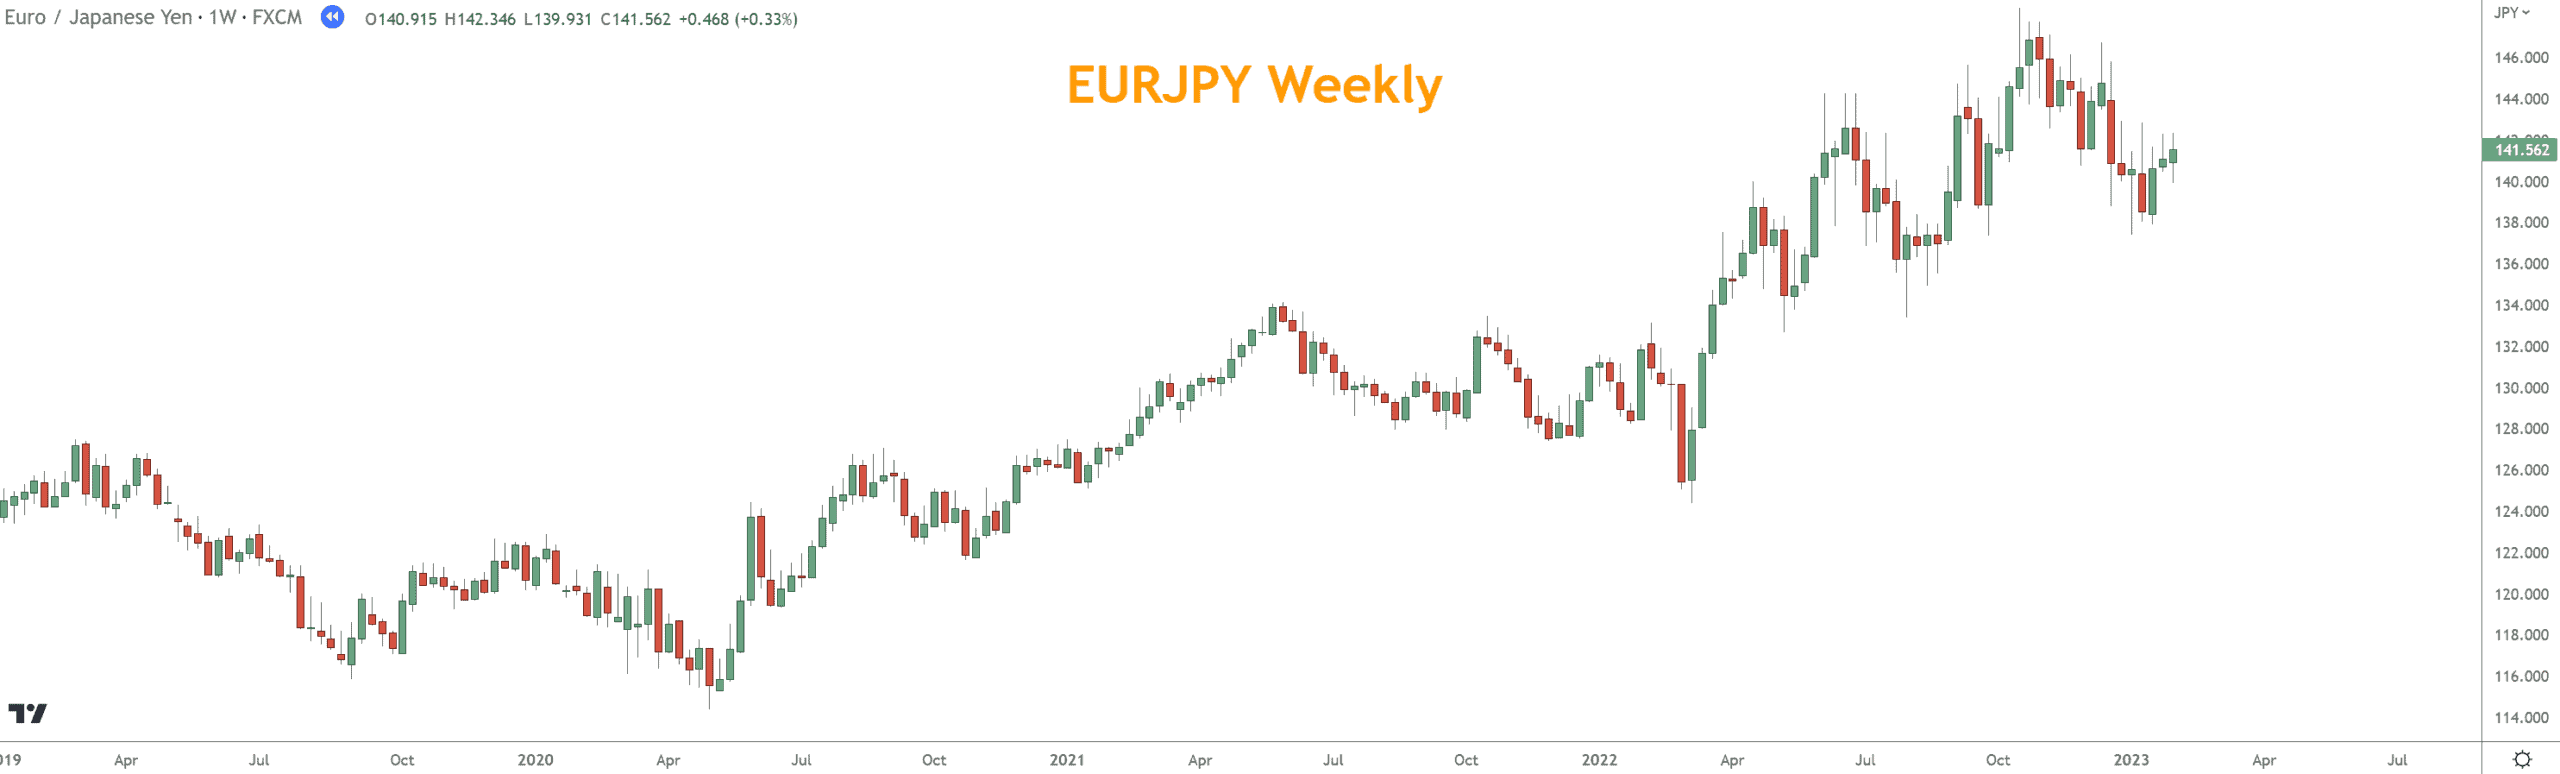
Considering this, how useful is it to know that prices moved higher between January 2019 and January 2023?
If you were wise enough or lucky enough to purchase in January 2019, would you have held through the long consolidation to get the additional 11 months of gains between March 2022 and January 2023?
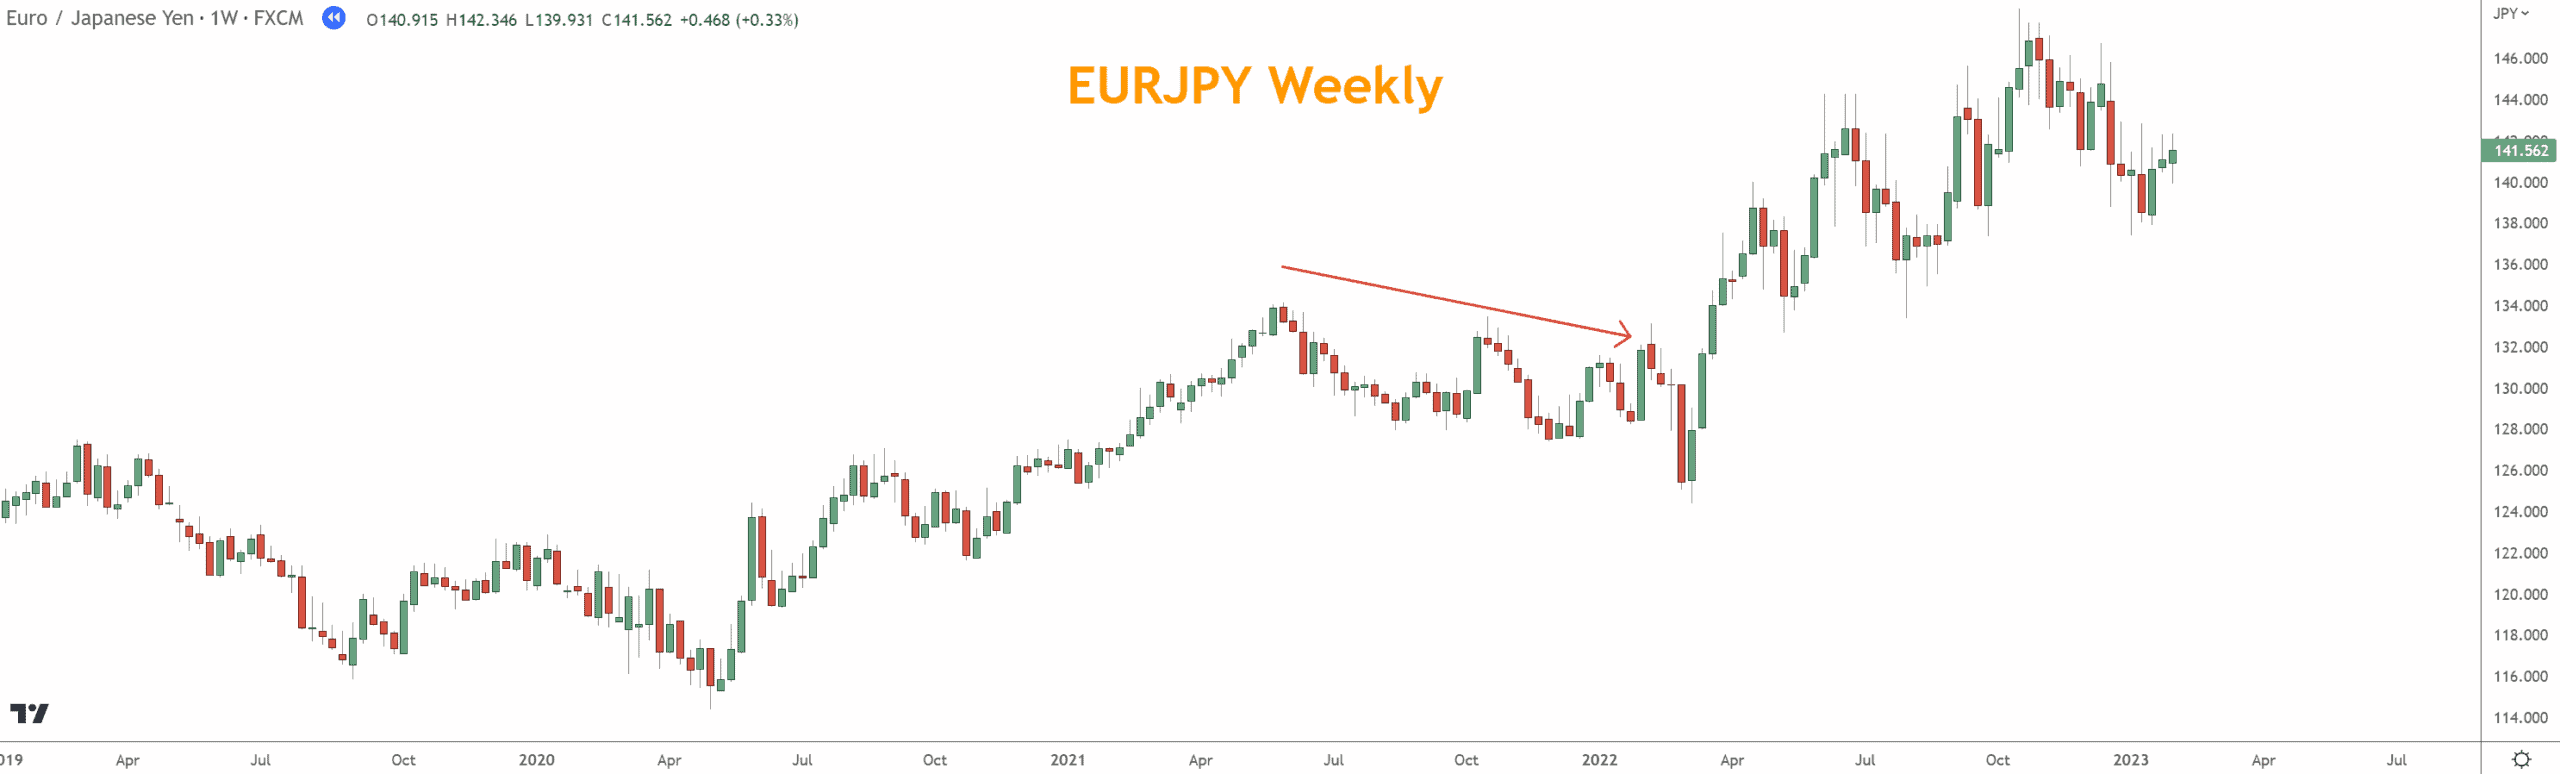
Most traders wouldn’t, and most struggle to identify a trend, trade it, and know what to think of it.
Knowing price “ended higher” doesn’t help you trade the path it took to get there.
Looking for a Strategy?
Download the Six Basics of Chart Analysis and sign up for Forex Forecast to learn a bottom-up approach to analyzing Forex markets and weekly market updates.
The Three Forex Trend Types
All price movement fits into one of three categories:
| Trend Type | Description | Market Condition |
| Bullish | Higher highs and higher lows | Buying pressure dominates |
| Bearish | Lower highs and lower lows | Selling pressure dominates |
| Neutral | Sideways range | Balance between buyers and sellers |
This classification is descriptive, not actionable.
The failure occurs when traders assume: Identifying the trend = having an edge
It doesn’t.
Why Trend Rules Break Down
Most trend strategies fall into two groups:
1. Indicator-Based Rules
- Moving Averages
- MACD
- ADX
These rely on mathematical smoothing, which means:
- Late entries
- Late exits
- Whipsaws during consolidation
2. Visual Techniques
- Swing highs and lows
- Trendlines
- Channel lines
These depend on subjective interpretation, meaning:
- Two traders see different trends
- Rules change after the fact
- Confirmation often comes too late
Both approaches assume the trend will continue simply because it exists.
That assumption is false.
Why Moving Average Trend Strategies Fail
Moving averages are the foundation of most trend systems. They all suffer from the same flaw:
They react to price rather than explain it.
- Short periods = whipsaws
- Long periods = late signals
- Crossovers = confirmation after the move
Even during clear directional markets, MA-based systems often struggle to outperform breakeven once spreads and slippage are included.
Prominent time frames include 20-day, 50-day, and 200-day MA. Let’s look at each and consider whether this is useful for trading.
In this study, we’ll use simple moving averages. You can try exponential, smoothed, and other calculations as an experiment. The problems are the same with all of them.
To stay with weekly charts as position traders, we’ll reduce the charts by a fifth (five-day trading week), so the charts will show a 4-period, 10-period, and 40-period, respectively. But, again, the result is the same.
In this example, the rule is simple. Open a trade when the price closes above the moving average and close it when it closes below the moving average. Only long transactions are attempted.
We’ve zoomed in on the period between 08/03/20 and 02/14/22 to make the chart legible.
I’ve labeled winning open and closing trades with green arrows and losing trades with red arrows.
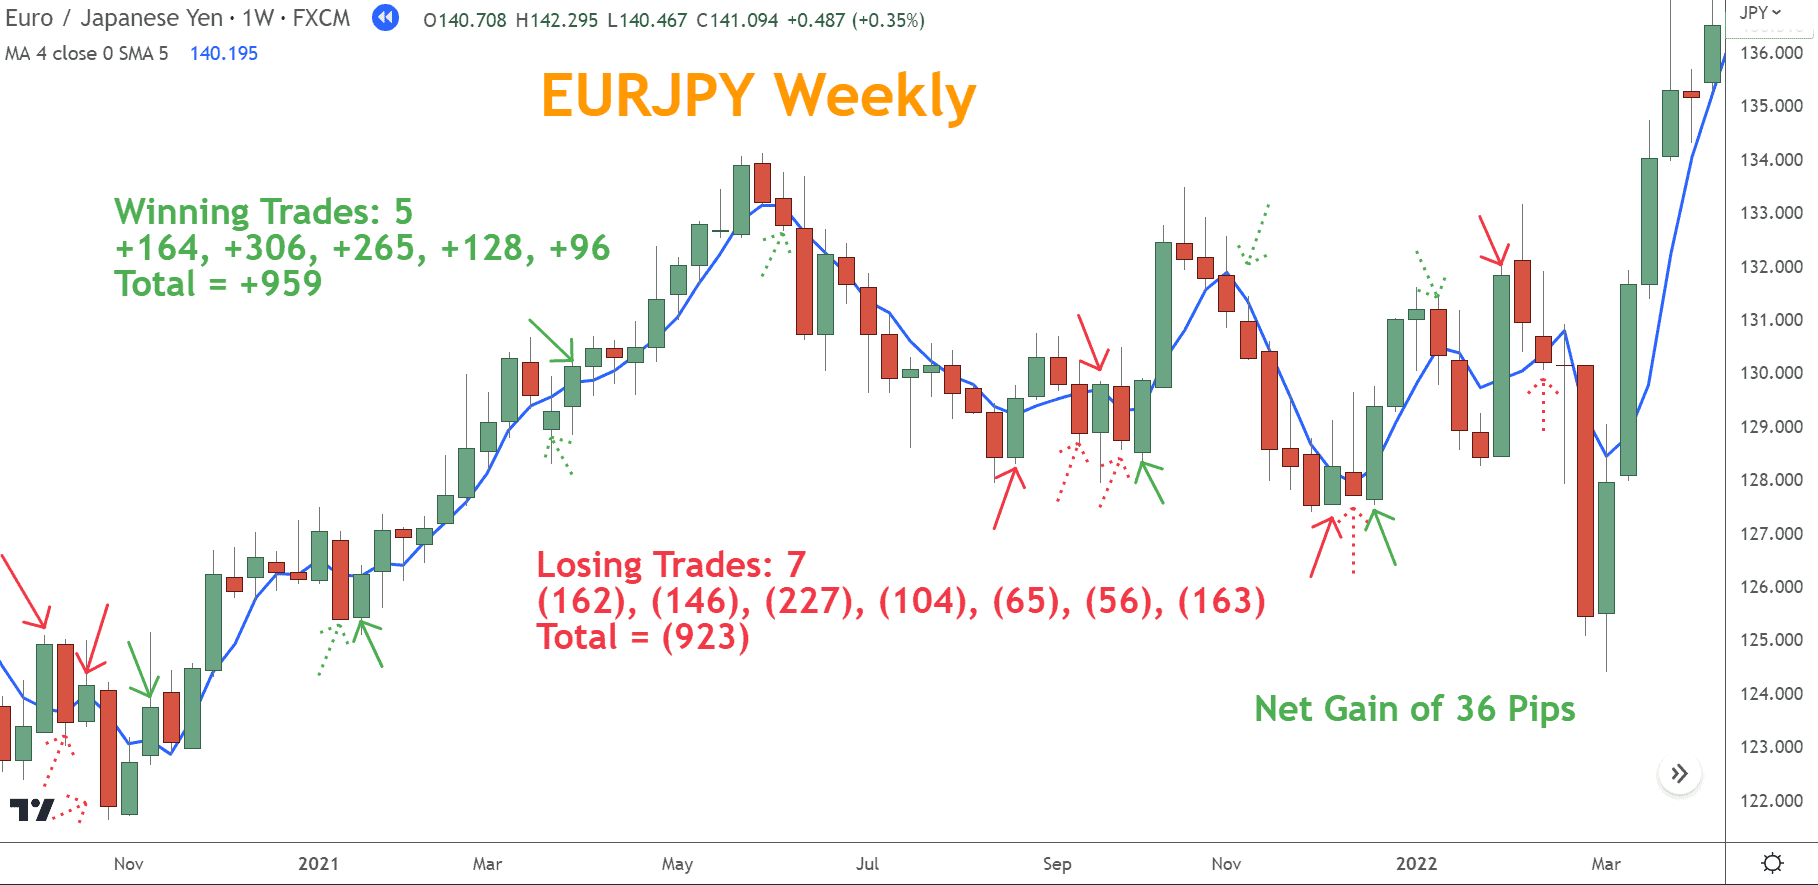
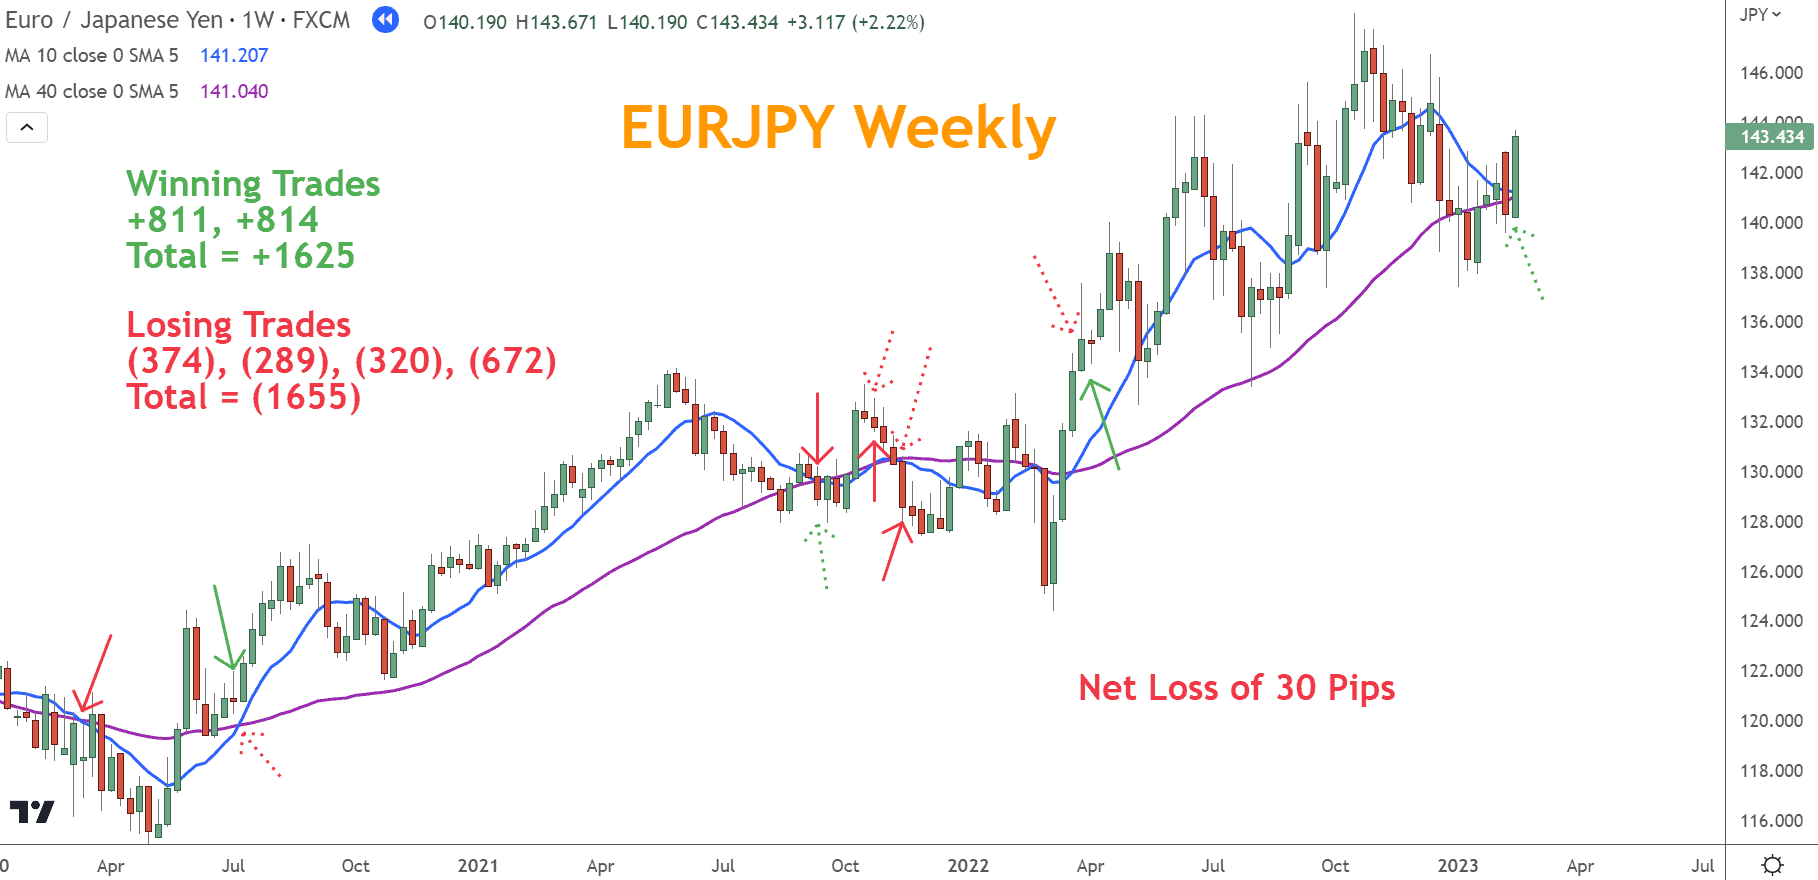
There is no “perfect setting.” The problem is structural.
MACD and ADX Don’t Fix the Problem
MACD and ADX attempt to solve moving average weaknesses—but they still lag price.
- MACD smooths moving averages but remains reactive
- ADX measures strength, not opportunity
- Signals often arrive after risk has increased
Buy signals are generated when the MACD line crosses above the signal line, while sell signals occur when the MACD line crosses below the signal line.
In this example, we’ll take long and short trades on EUR/JPY. If the MACD is in a Bullish state and provides a buy signal, we’ll buy; and if it’s in a Bearish state and provides a sell signal, we’ll sell.
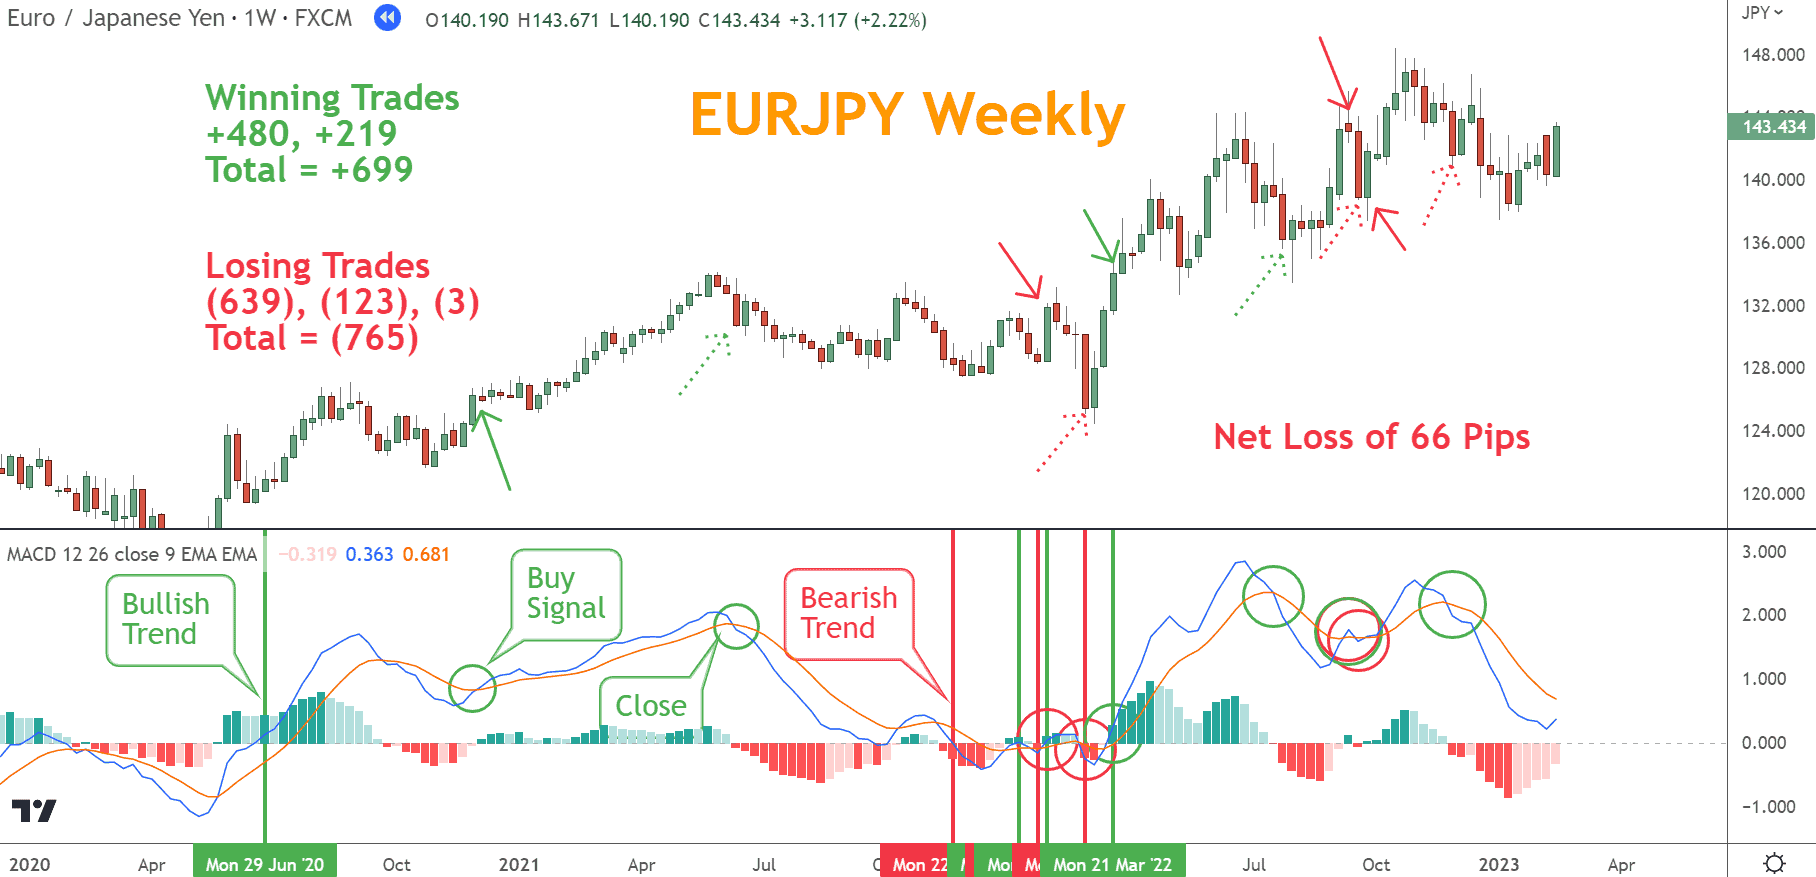
As you can see, the MACD doesn’t do any better than the simple moving average for the same reasons.
There is no “sweet spot” with moving averages. There is no one set of numbers or math that can accommodate the market’s volatility.
Even when performance improves slightly, the results remain poor relative to the size of the move.
Channel Lines and Trendlines: Visual, But Late
Trendlines and channel lines require confirmation:
- Multiple highs or lows
- Clean touches
- Clear structure
By the time this structure is obvious:
- Much of the move has passed
- Risk-reward has deteriorated
- Momentum may already be weakening
Channel Lines are drawn by connecting peaks on one side of prices and troughs on the other side of prices on a chart.
These peaks and troughs are labeled as Higher Highs, Higher Lows, Lower Highs, or Lower Lows.
Conventional wisdom is that if you can find three peaks or three troughs, you have a confirmed price direction.
Once confirmed, you can enter a trade in the direction of the trade.
Taking a closer look could be more helpful for a few reasons.
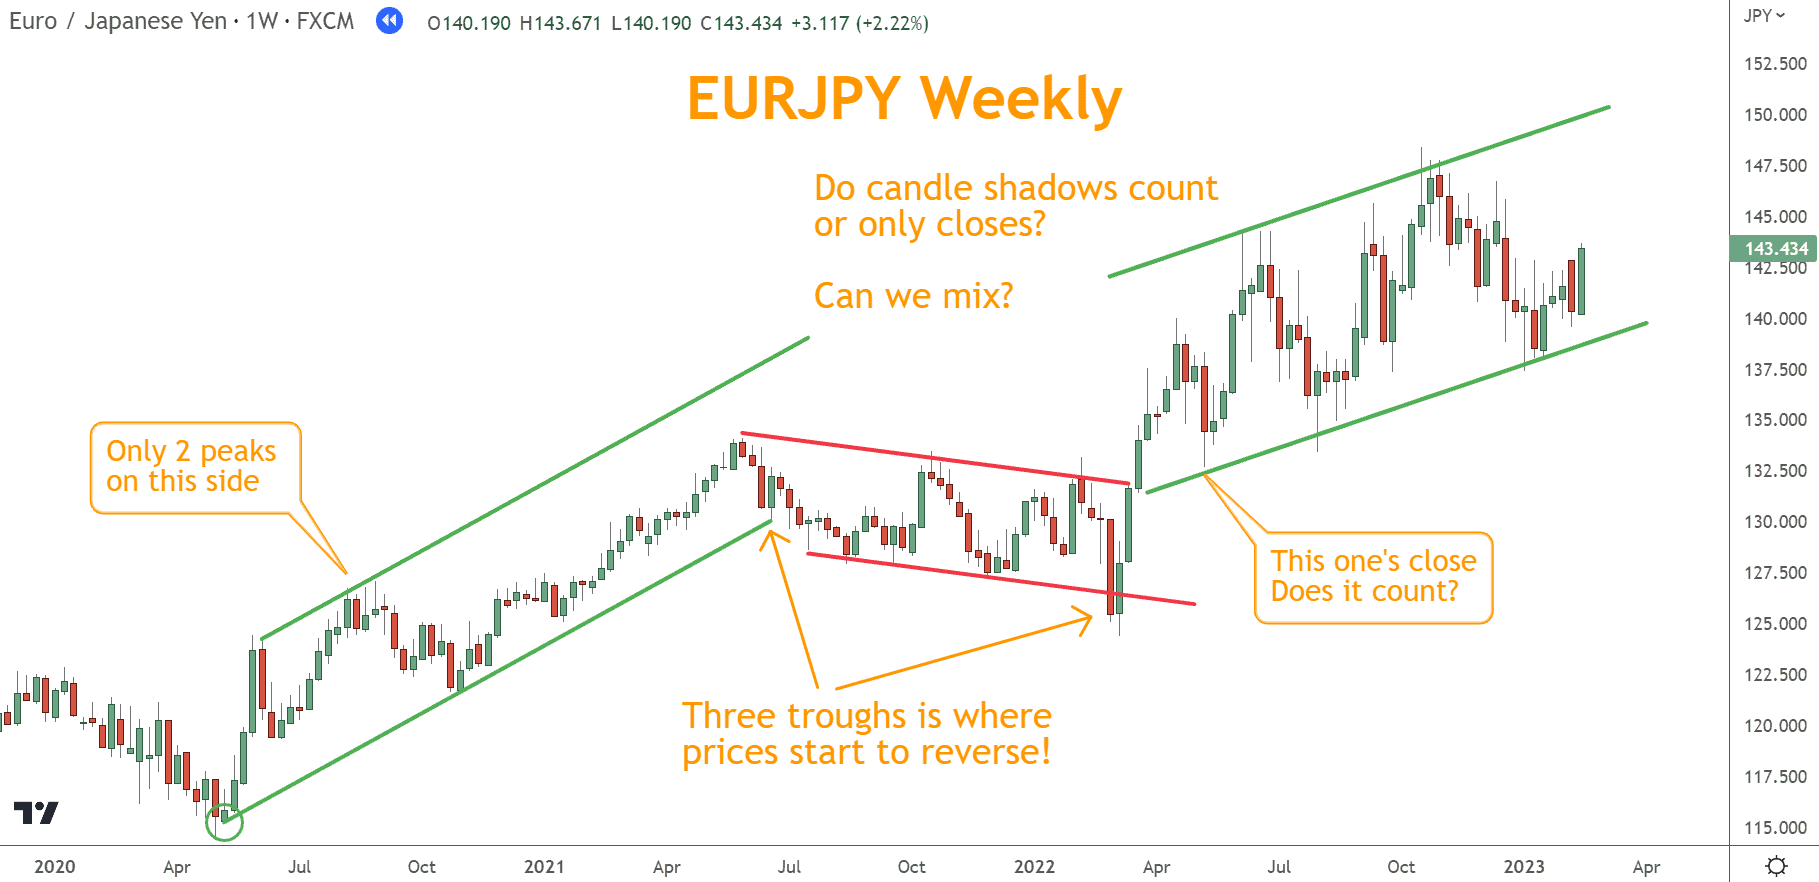
First, you must decide if shadows and near misses count since they often come into play. The other challenge is that if you wait for three peaks or troughs, you may have missed the move entirely.
Even if you include shadows and near misses, you will need help using this strategy.
They are helpful for context, not signals.
Why Multi-Timeframe Trend Filters Still Fail
Many traders attempt to “fix” trend indicators by combining timeframes:
- Weekly trend + daily entry
- Higher timeframe filter + lower timeframe signal
If you are a swing trader (intermediate-term) looking at daily charts, is there value in using the longer-term weekly indicator and a daily indicator? Can they work better together?
In this example, we’ll reset the EUR/JPY chart to daily and add two MACD indicators, each on a unique period. One set was as if it were on a weekly chart, and the other was for the daily chart.
If the weekly MACD gives a bullish or bearish signal, we’ll take trades on the daily chart that coincide with that signal on the daily MACD.
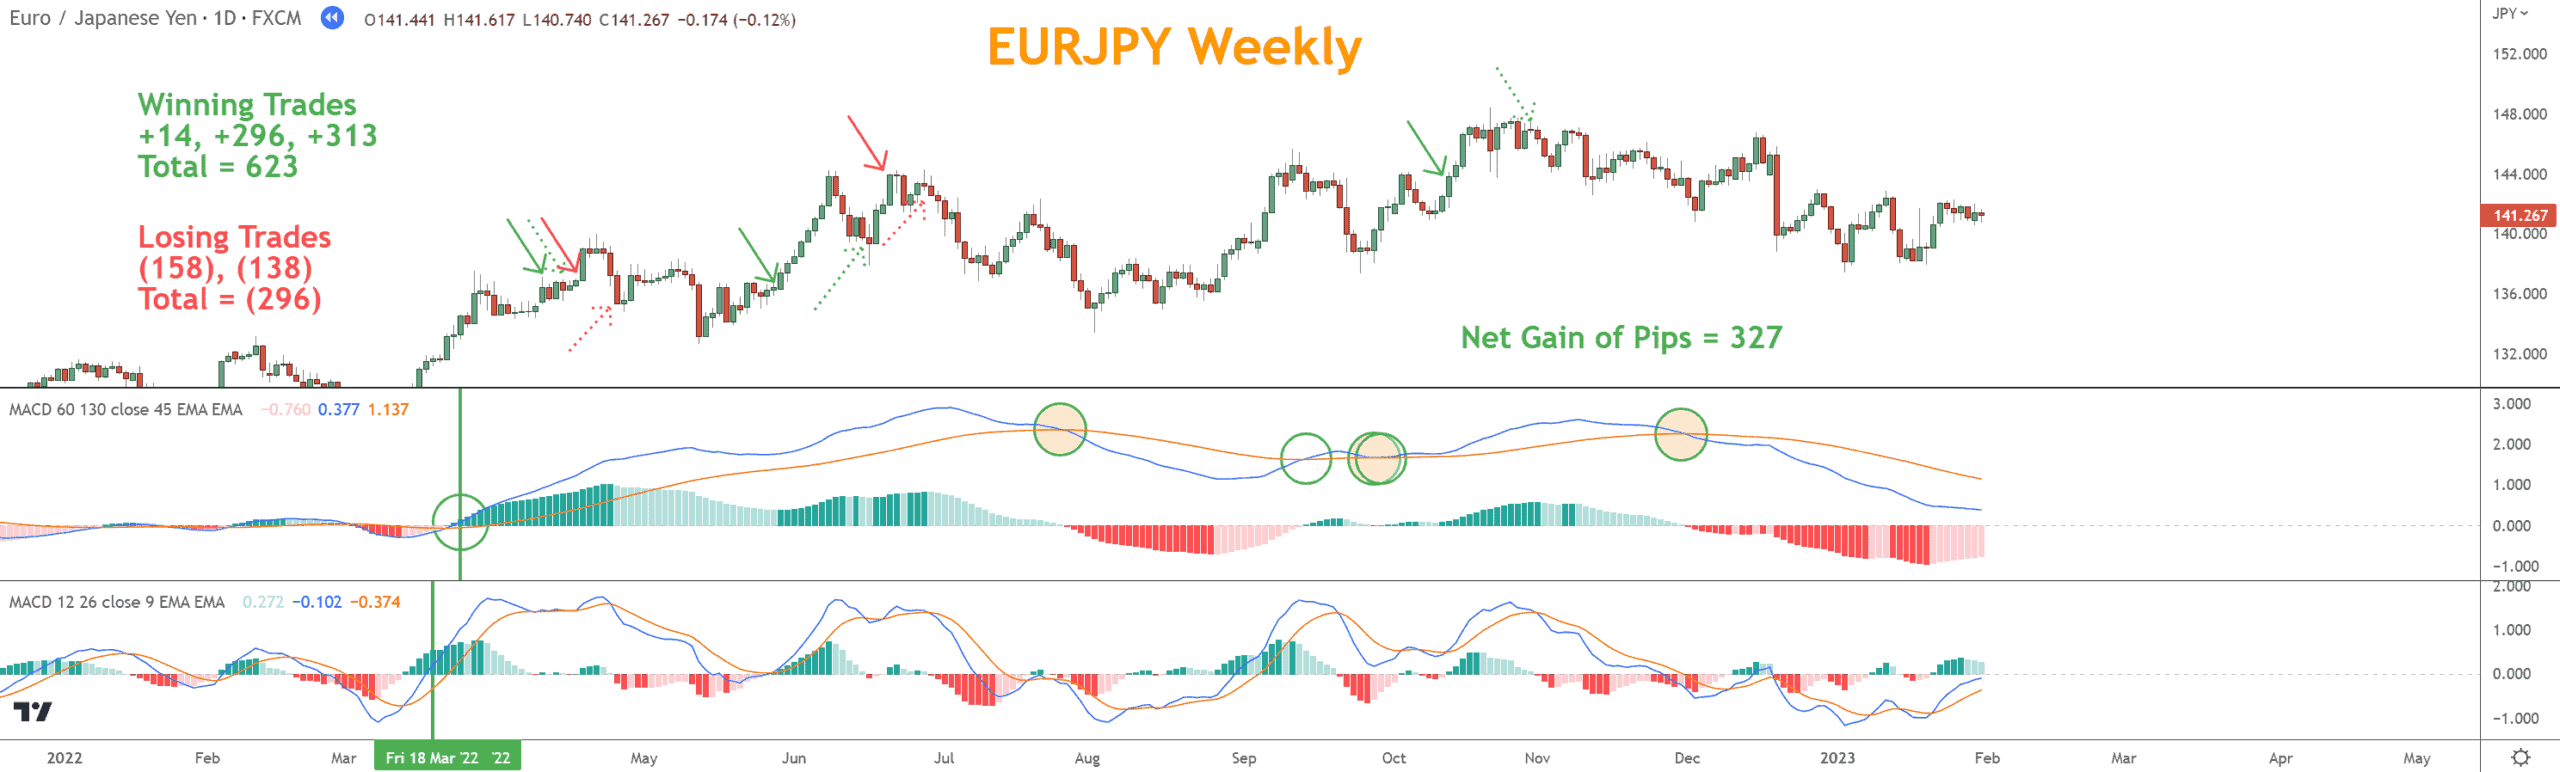
Using the two-time-frame, the MACD strategy performed better but still underperformed. Three hundred twenty-seven pips earned over 13 months is an unacceptable performance.
Even using the longer-term MACD as a filter, the shorter-term MACD fails to make better trades because it lags.
One early trading opportunity is missed out on because the longer-term MACD lags.
You can experiment with different time frames and strategies; however, as you can see, trying to use trend this way as a basis for trading doesn’t work.
This is because of the flawed ideas behind these tools. The trend is different from what these tools measure.
Filtering a lagging tool with another lagging tool does not create precision.
Allow me to explain.
Trend vs. Momentum: The Missing Link
Trend describes direction.
Momentum describes energy.
A market can:
- Trend slowly with weak momentum
- Move aggressively without a long-term trend
Most failed trend strategies ignore this distinction.
Momentum tells you:
- Whether price movement is accelerating
- Whether participation is increasing or fading
- When reversals are more likely
Without momentum, trend direction is incomplete information.
The trend is only a general direction. Momentum is the energy in that direction.
If you are sitting in your car heading west on a highway, you are trending west, whether sitting in traffic at 20 miles per hour or speeding along at 70.
The speed at which you are moving is the momentum.
To be successful in trading, we need to know in what direction we have been moving recently and with how much energy.
We can incorporate other tools and techniques to help identify reversals and continuations.
I suggest reframing the idea of trend as a shorter-term strategy and stopping trying to use it as a filter.
For example, look at the chart below, which uses a 25-period Least Square Moving Average.
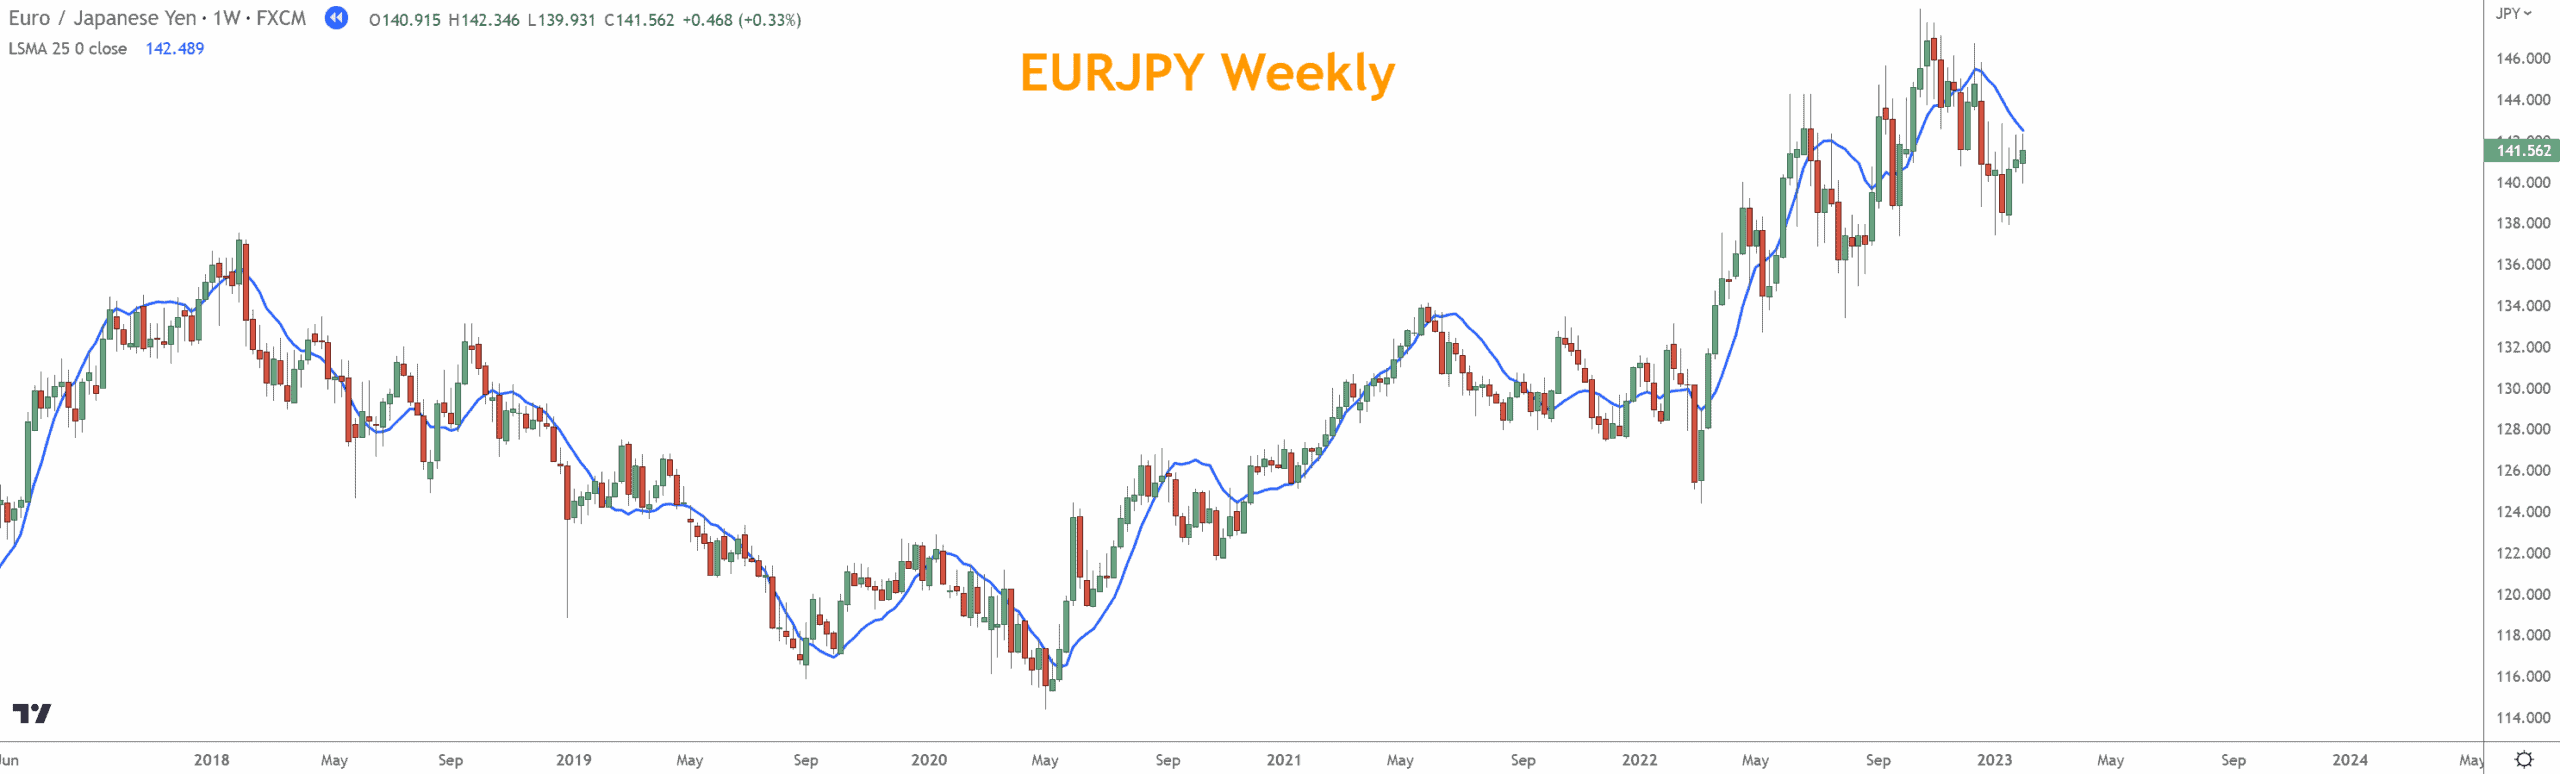
The LSMA is a regression moving average that tracks prices as closely as possible, giving you a line reflecting actual price movements.
The shorter the period, the more closely it tracks price movements, which is very different from the SMA or EMA, which averages price movements.
Now you have an indicator telling you the general direction of price, and the chart clearly shows that price direction is constantly changing.
So, let’s zoom in on a portion of the chart and remove the candles.
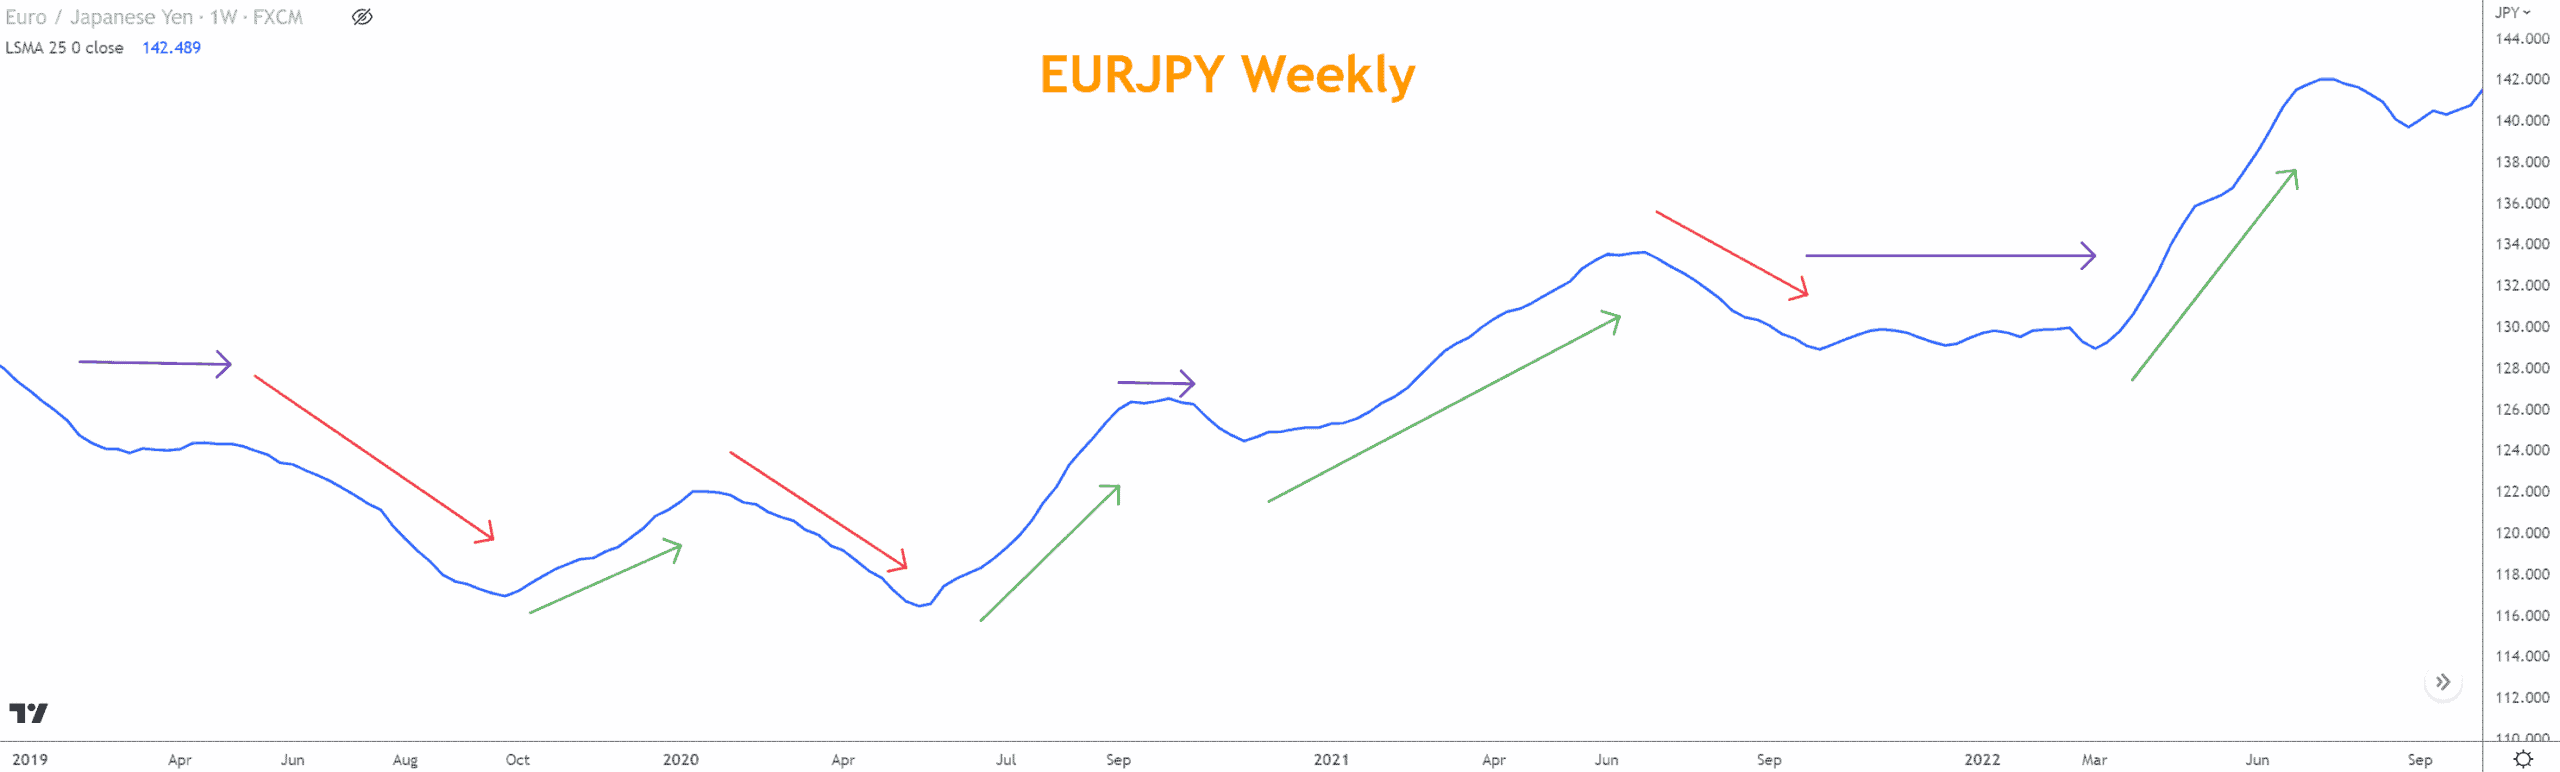
Without the distraction of the candles, you can easily see bullish, bearish, and neutral (purple) trends on the price chart.
This is because you no longer use trends as a filter but instead track how prices identify trends.
You can use the LSMA with rules, supporting tools, and techniques such as:
- Momentum
- Japanese Candlesticks
- Chart Patterns
- Support and Resistance
and start trading in the direction of prices.
With this mindset, you are looking for how price is most recently trending, which is helpful.
You will also want to use other tools to help identify whether any trends might change soon.
The combination of knowing how the price is trending right now, the momentum in price, and other complementary elements will let you build a trading system with a better chance of success than those with Simple Moving Averages, MACD, ADX, or many others.
What’s the Next Step?
Evaluate how you currently use trend:
- Are you trading direction—or reacting to lagging signals?
- Are you measuring momentum—or assuming continuation?
- Are your entries based on structure or confirmation after the move?
If you want a position-trading framework that works across markets and timeframes, study the Six Basics of Chart Analysis.

The Six Basics focus on price, structure, and context—not indicator noise—and pair directly with the weekly Forex Forecast for real-world application.
Quiz: Test Your Understanding
Questions
- Why do most trend indicators fail?
- A. They are subjective
- B. They ignore fundamentals
- C. They lag price
- D. They are too complex
- What does trend primarily describe?
- A. Entry timing
- B. Direction
- C. Risk
- D. Volatility
- Why doesn’t identifying an uptrend guarantee profits?
- A. Trends always reverse
- B. Price paths include drawdowns and consolidation
- C. Indicators repaint
- D. Fundamentals don’t matter
- What does momentum measure?
- A. Direction
- B. Duration
- C. Market noise
- D. Energy behind price movement
- What is the correct role of trend in trading?
- A. A standalone entry signal
- B. A confirmation after entry
- C. A descriptive filter combined with other tools
- D. A replacement for risk management
Answer Key
- C – They lag price
- B – Direction
- B – Trends include drawdowns and consolidation
- D – Energy behind price movement
- C – Trend should be combined with momentum and structure
Forex Trading Disclosure Statement
Risk Warning:
Forex trading involves significant risk and may not be suitable for all investors. The leveraged nature of Forex trading can work both for and against you, leading to substantial gains or losses. Before trading Forex, you should carefully consider your financial objectives, experience level, and risk tolerance. It is possible to lose more than your initial investment, and you should only trade with money you can afford to lose.
Market Risks and Volatility:
Forex markets are influenced by global economic, political, and social events, which can result in unpredictable price movements. High market volatility can lead to sudden and substantial changes in currency values, potentially causing losses that exceed your initial deposit.
Leverage Risks:
Leverage amplifies both potential gains and potential losses. While leverage can increase profitability, it also increases the risk of significant losses, including the loss of your entire trading capital.
Trading Tools and Technology Risks:
Forex trading platforms, including those offered by brokers, are subject to technology risks, such as system failures, latency issues, and potential errors in price feeds. Traders should be aware that these risks can impact the execution of trades and trading outcomes.
No Guarantee of Profitability:
Past performance in Forex trading is not indicative of future results. There is no guarantee that you will achieve profits or avoid losses when trading Forex. Market conditions and individual trading strategies vary, and no trading system can eliminate the inherent risks of Forex trading.
Educational Purposes Only:
Any information provided about Forex trading, including strategies, analysis, or market commentary, is for educational purposes only and should not be considered financial advice. Consult a qualified financial advisor or tax professional before making any trading decisions.
Regulatory Compliance:
Forex trading is regulated differently in various jurisdictions. Ensure that you are trading with a licensed and compliant broker in your country of residence.
Responsibility:
You are solely responsible for your trading decisions and the associated risks. It is your duty to understand the terms and conditions of Forex trading, including margin requirements, stop-losses, and other risk management tools.
Acknowledgment:
By engaging in Forex trading, you acknowledge that you have read, understood, and accepted this disclosure statement. You accept full responsibility for the outcomes of your trading decisions and agree to trade at your own risk.
This disclosure is intended to provide an overview of the risks associated with Forex trading and is not exhaustive. For additional information, consult your broker and other reliable financial resources.