
Double Top and Double Bottom patterns are two of the most widely recognized reversal formations in Forex trading.
When used correctly—and supported by confirmation tools—they can help you identify high-probability turning points and execute profitable trades.
This guide explains what these patterns are, how to identify them, what tools improve their reliability, and the one rule you must follow to avoid unnecessary losses.
TL;DR – Double Tops & Bottoms Made Simple
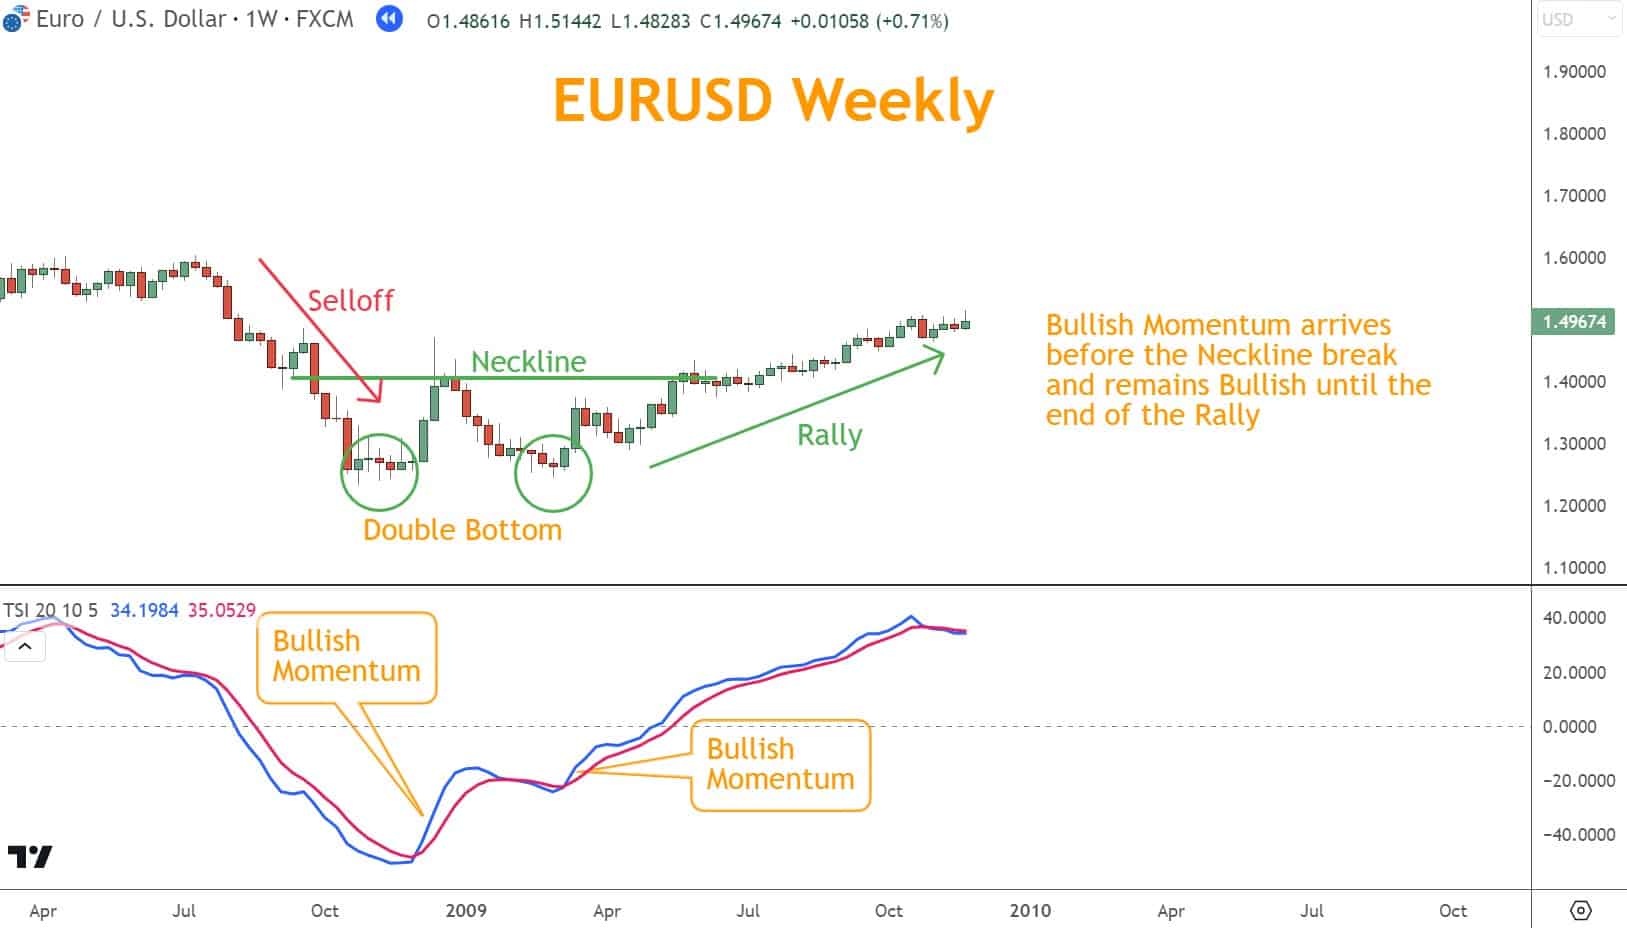
- A Double Bottom forms after a Selloff and signals a potential Bullish reversal.
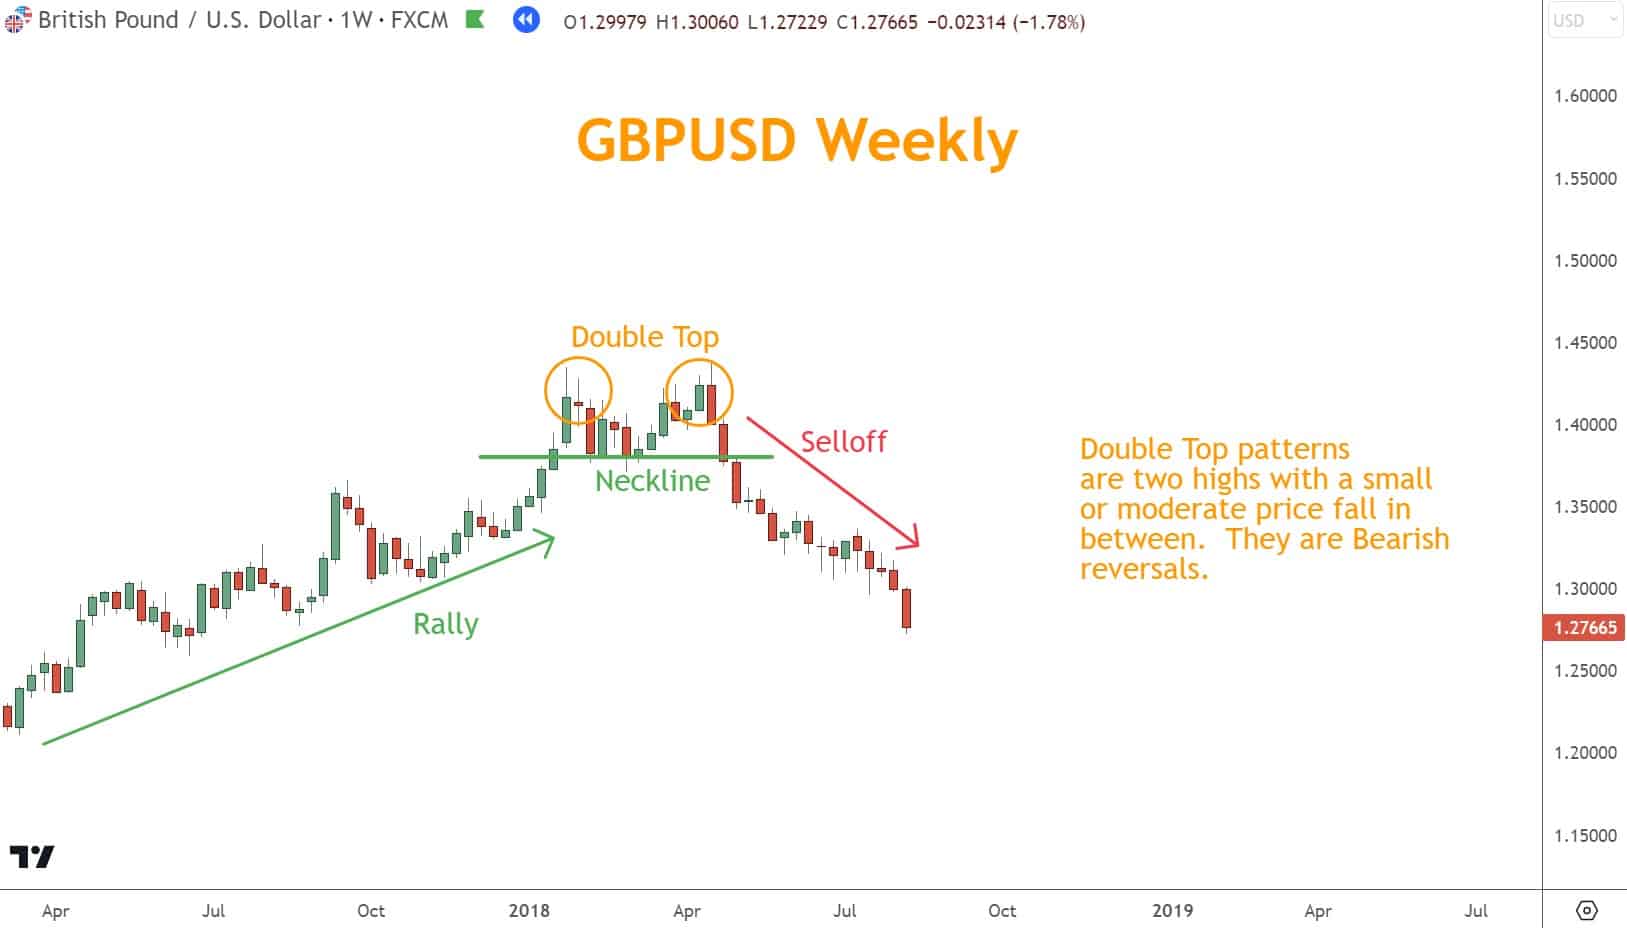
- A Double Top forms after a Rally and signals a potential Bearish reversal.
- Confirmation tools (Momentum, Candlesticks, Support & Resistance) greatly improve accuracy.
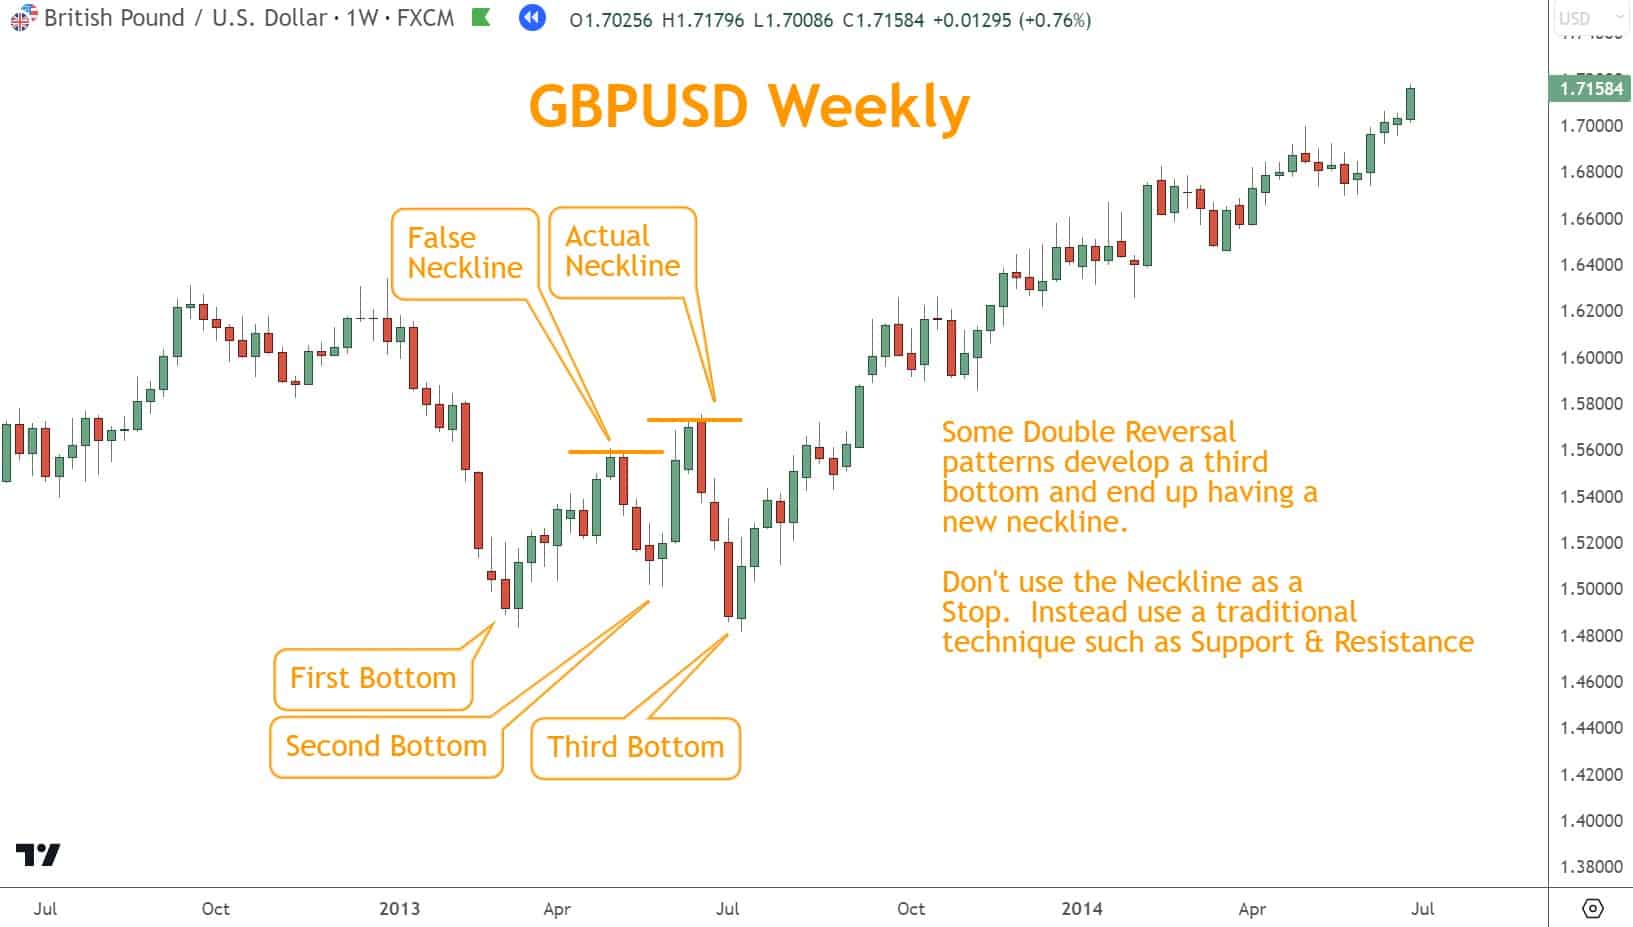
- Do NOT use the Neckline as your stop-loss. These patterns frequently evolve into Triple patterns.
- Use horizontal Support/Resistance, Swing High/Low levels, and other proven techniques for stops and targets.
Table of Contents
- TL;DR – Double Tops & Bottoms Made Simple
- What Are Double Bottom & Double Top Patterns in Forex?
- Definition of a Double Bottom Pattern
- Definition of a Double Top Pattern
- Can Coincidental Tools Improve These Patterns?
- How Momentum Improves Trading Performance
- How Japanese Candlesticks Improve Reliability
- How Support & Resistance Improve Accuracy
- The One Rule You Need to Win More Trades
- Mastering the Nuances: Best Practices
- Quiz: Test Your Knowledge of Double Tops & Bottoms
- Answer Key
- What’s the Next Step?
- Forex Trading Disclosure Statement
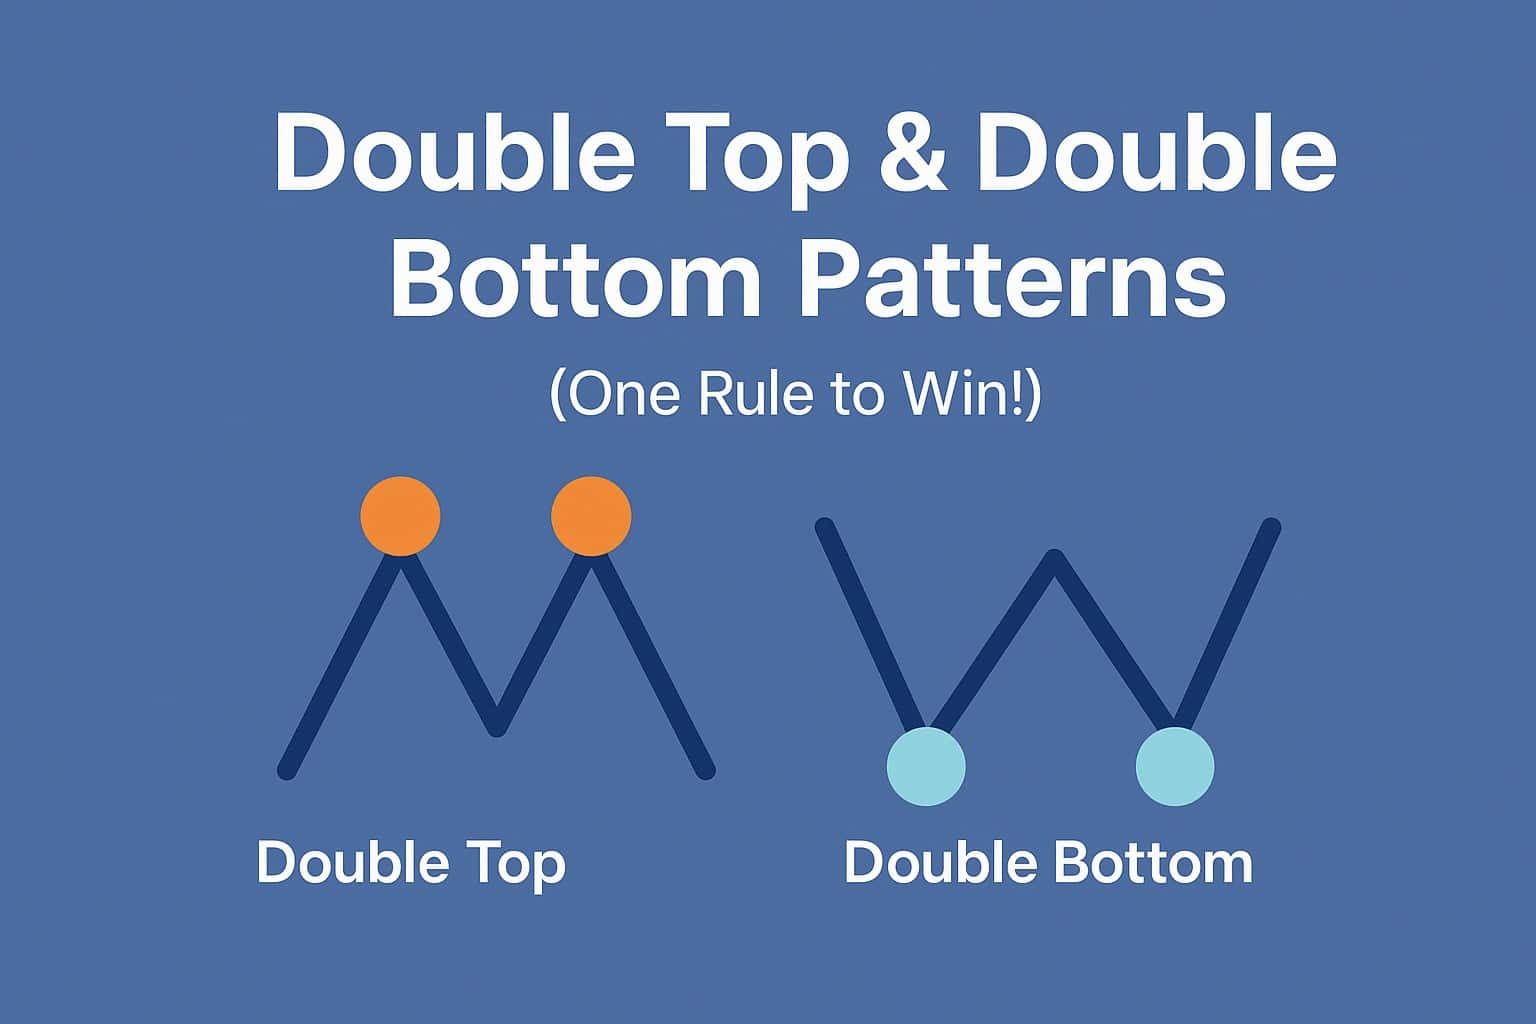
What Are Double Bottom & Double Top Patterns in Forex?
Double Tops and Bottoms are reversal patterns that reflect exhaustion in the current direction. They feature two failed attempts to push the price beyond a key level:
- Double Bottom: Two lows forming near the same level
- Double Top: Two highs forming near the same level
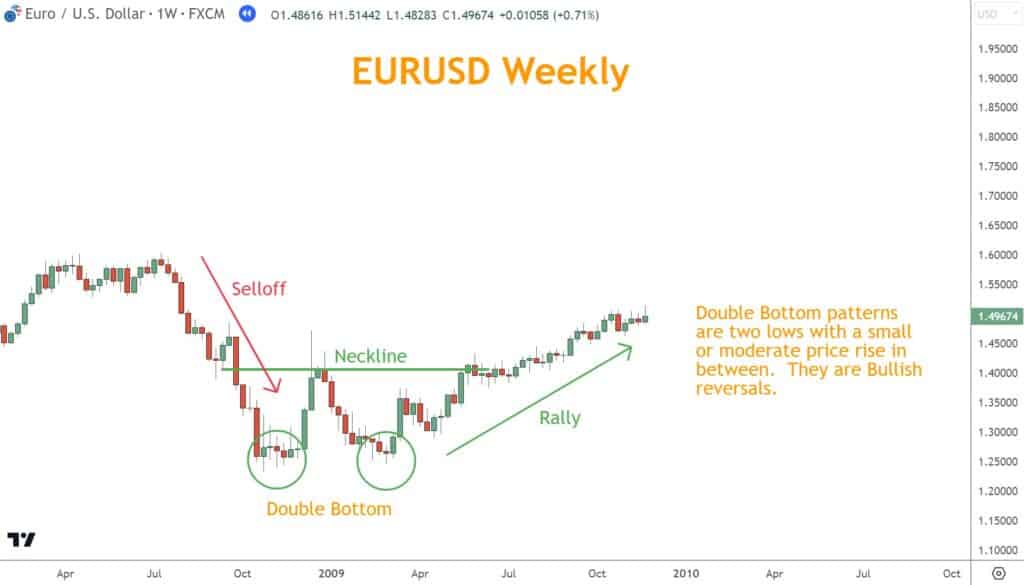
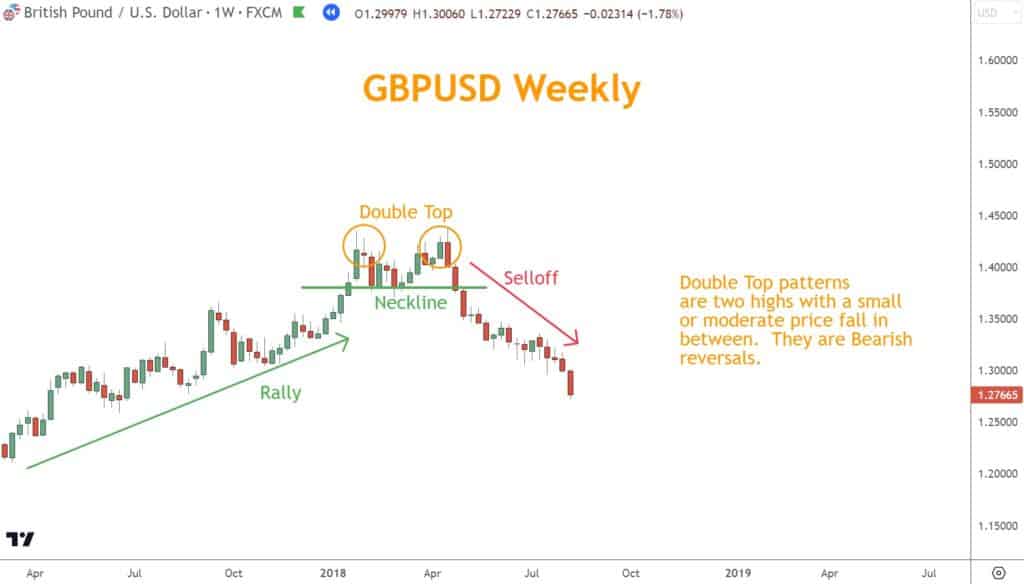
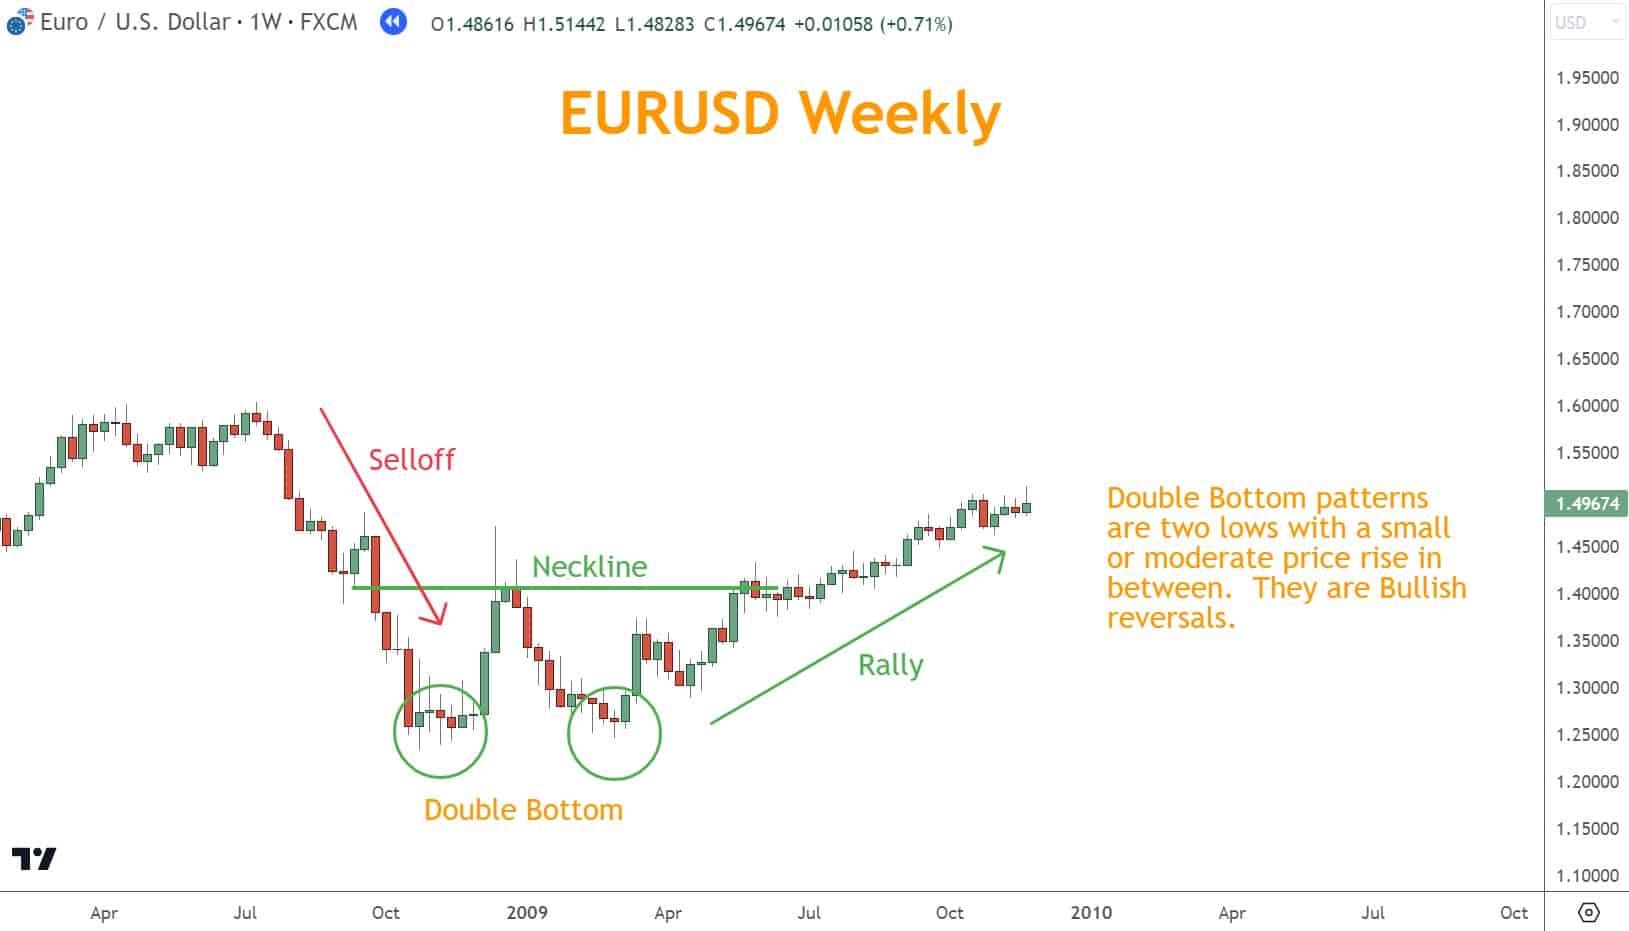
The EUR/USD examples below typify the Double Bottom and Double Top patterns.
Price then breaks the Neckline—a horizontal level drawn between the peaks (for Double Bottoms) or troughs (for Double Tops)—to confirm the reversal.
Key Characteristics
- Two distinct peaks or troughs
- The second top/bottom is equal or slightly lower/higher than the first
- A breakout is required for confirmation
- Break-and-retest behavior often increases reliability
Definition of a Double Bottom Pattern
A Double Bottom is a Bullish reversal pattern that forms after a Selloff:
- Two lows form near the same level
- A moderate peak forms between them
- A breakout above that peak confirms the turn
Why It Works
It signals that sellers failed twice to push the price lower—showing exhaustion.
About the Measured Move Method
Many traders project targets using the “measured move” technique:
- Measure the distance from the low to the Neckline
- Add that distance above the breakout to estimate a target
However, this method is often unreliable. More precise alternatives—like Support/Resistance or swing-based targeting—typically outperform it.
Looking for a Strategy?
Download the Six Basics of Chart Analysis and sign up for Forex Forecast to learn a bottom-up approach to analyzing Forex markets and weekly market updates.
Definition of a Double Top Pattern
A Double Top is a Bearish reversal pattern signaling that buyers have been unable to push above resistance after two attempts:
- The pair rallies to a high
- Pulls back
- Rallies again to roughly the same level
- Fails, then reverses
Traders often measure targets using the same “measured move,” but again, support & resistance typically provide more reliable outcomes.
Can Coincidental Tools Improve These Patterns?
Yes.
In fact, successful traders rarely use Double Tops or Bottoms alone.
The most reliable confirmations include:
| Tool Category | Examples / Components | Why It Matters |
|---|---|---|
| Momentum Indicators | – RSI- TSI- Stochastic | Shows whether the current direction is strengthening or weakening. Divergences add powerful confirmation that a reversal is forming. |
| Japanese Candlestick Patterns | – Bullish Engulfing at a Double Bottom- Evening Star at a Double Top- Hammer or Shooting Star confirmation | Adds visual context to buyer–seller battles. Candlestick reversals help confirm whether the Double Top/Bottom is valid and ready for follow-through. |
| Support & Resistance | – Horizontal Support- Horizontal Resistance- Major price levels | The strongest confirmation factor. Price turning at a major level increases pattern reliability. Also provides superior stop placement, target selection, and reversal forecasting. |
How Momentum Improves Trading Performance
Momentum helps validate whether a reversal is real:
- Bullish Momentum Divergence → strengthens Double Bottoms
- Bearish Momentum Divergence → strengthens Double Tops
- Helps identify Overbought/Oversold conditions
- Confirms that the reversal has enough “energy” behind it
Incorporating momentum can dramatically reduce false signals.
How Japanese Candlesticks Improve Reliability
Candlesticks help answer:
“Is the market truly rejecting these levels?”
Examples:
- Double Bottom + Bullish Engulfing = Strong reversal signal
- Double Top + Evening Star = High-quality Selloff opportunity
- Wicks rejecting the key level = strong confirmation
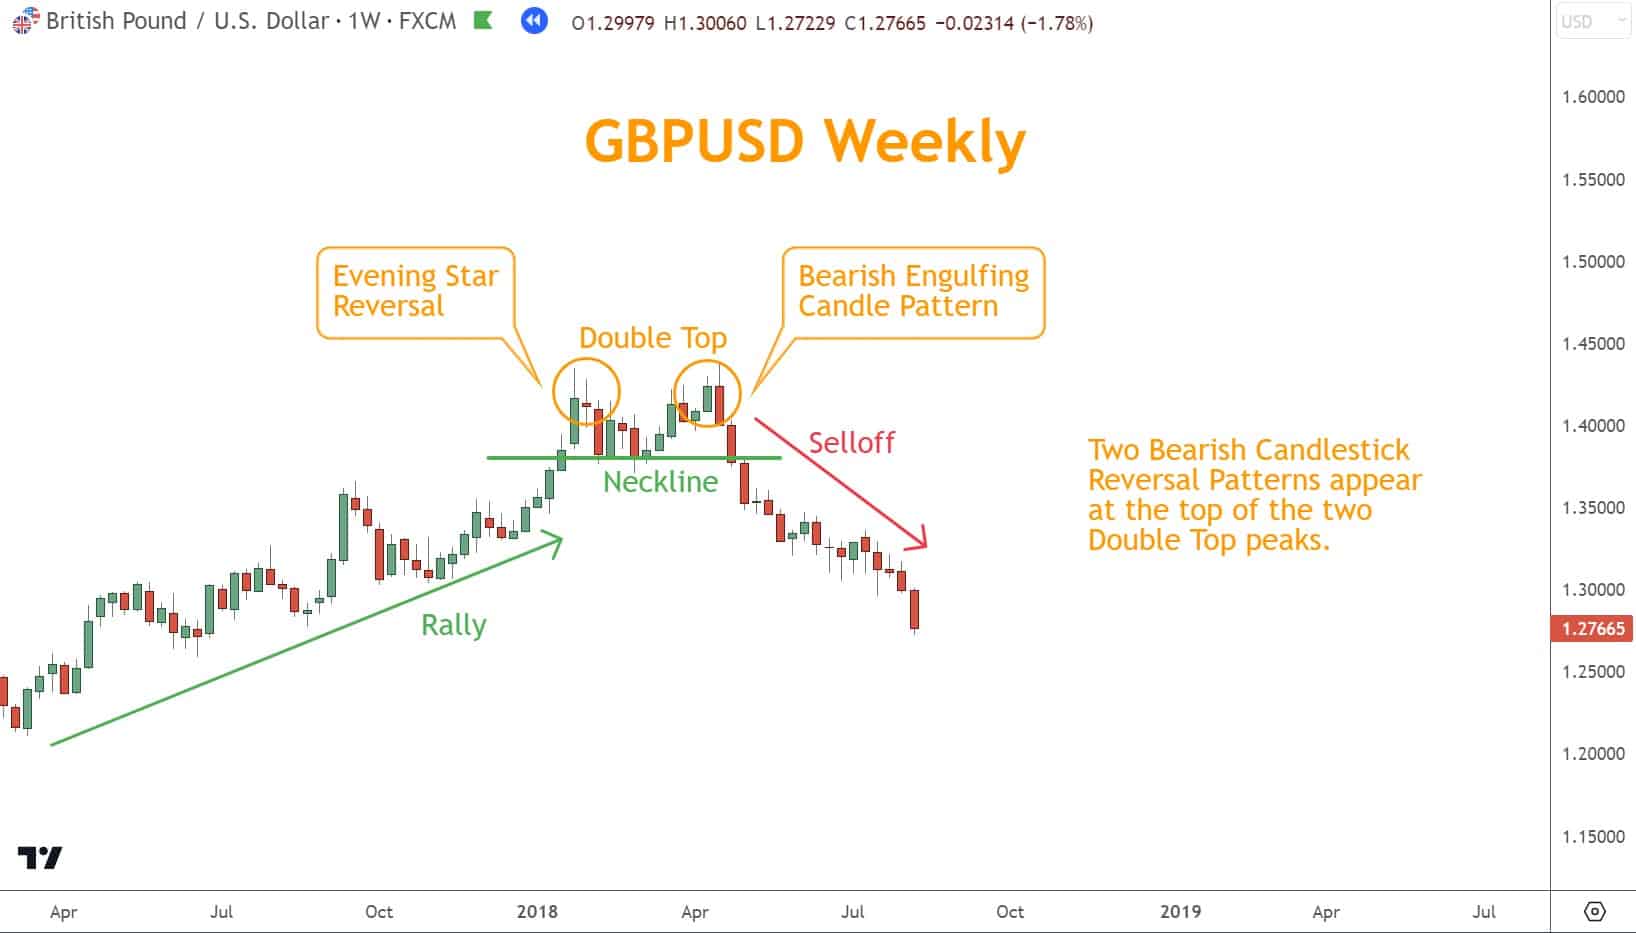
Candlesticks increase your ability to time entries more precisely.
How Support & Resistance Improve Accuracy
Support and Resistance help you:
- Validate the pattern
- Sharpen your entry timing
- Select strategic targets
- Place safer, more logical stops
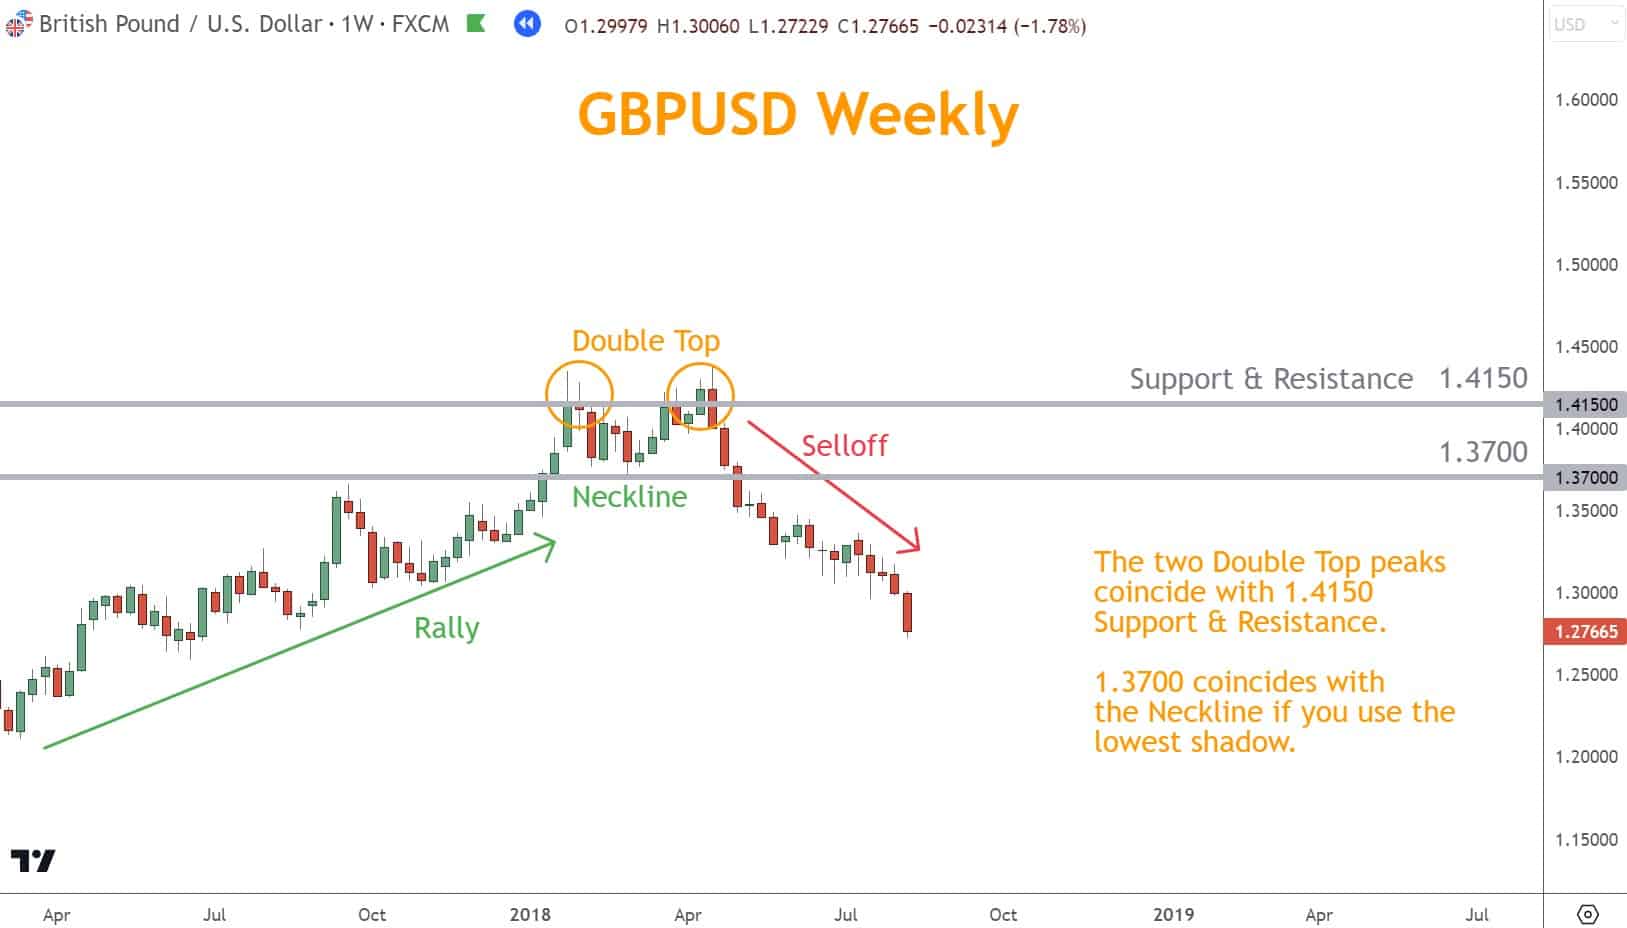
When a Double Top or Bottom forms directly at a known level, the probability increases substantially.
The One Rule You Need to Win More Trades
Never place your stop-loss at the Neckline.
Why?
Because Double patterns often become Triple patterns.
Examples:
- After two tops form, a third top forms—invalidating the first neckline
- After two bottoms form, the price makes a third bottom before reversing
This makes the neckline stops extremely vulnerable to unnecessary losses.
What to Use Instead
Better stop-loss methods include:
- Horizontal Support & Resistance
- Swing Highs and Swing Lows
- Combination with Candlestick confirmation
- Momentum-based invalidation levels
These offer far better protection and accuracy.
Mastering the Nuances: Best Practices
| Nuance / Guideline | Why It Matters |
| Patterns near major S/R are strongest | Shows institutional price interest |
| Look for a clean, symmetrical structure | Sloppy patterns often fail |
| Always wait for the breakout | No breakout = no confirmation |
| Avoid Neckline stops | Patterns frequently evolve |
| Use multiple confirmations | Reduces false signals dramatically |
Quiz: Test Your Knowledge of Double Tops & Bottoms
1. What do Double Bottom patterns typically signal?
a. Continuation of a Selloff
b. A potential Bullish reversal
c. A break of long-term resistance
d. A consolidation period with no directional bias
2. What is the purpose of the Neckline?
a. Ideal stop-loss placement
b. Identifies Momentum strength
c. Connects swing points and confirms the breakout
d. Best location for profit targets
3. Which tool provides the strongest confirmation?
a. Trendlines
b. Moving averages
c. Support and Resistance
d. Fibonacci levels
4. Why should the Neckline NOT be used as a stop?
a. Necklines always shift intraday
b. Patterns fail frequently
c. Double patterns often evolve into Triple patterns
d. Stops become too large
5. Which combination offers the best confirmation?
a. Elliott Waves + Trendlines
b. Support/Resistance + Candlesticks + Momentum
c. Bollinger Bands + Moving averages
d. Round numbers + time cycles
Answer Key
- b
- c
- c
- c
- b
What’s the Next Step?
Open a chart and begin identifying Double Tops and Bottoms. Mark the swing points, draw your Neckline, and test where confirmation aligns using:
- Support & Resistance
- Candlestick patterns
- Momentum indicators
- Logical stop and target placement
If you need a structured analysis framework, download the Six Basics of Chart Analysis for free.
You’ll also receive Forex Forecast, a weekly Sunday email featuring:
- Trade ideas using the Six Basics
- Real chart breakdowns
- Educational guides
- New articles
- PositionForex updates
- Free webinars
- And more

The Six Basics and Forex Forecast are completely free.
Forex Trading Disclosure Statement
Risk Warning:
Forex trading involves significant risk and may not suit all investors. Leverage amplifies both gains and losses. Never trade with money you cannot afford to lose.
Market Risks and Volatility:
Economic, political, and geopolitical events can cause sudden price movements that may result in losses exceeding initial deposits.
Leverage Risks:
Leverage magnifies exposure. While it can increase profits, it also greatly increases losses.
Technology Risks:
Trading platforms may experience technical failures, latency, or erroneous data.
No Guarantee of Profitability:
Past performance does not guarantee future results. No strategy eliminates risk.
Educational Purposes Only:
All material here is for educational purposes and is not financial advice.
Regulatory Compliance:
Ensure your broker is licensed in your country of residence.
Responsibility:
You are solely responsible for your trading decisions and their results.