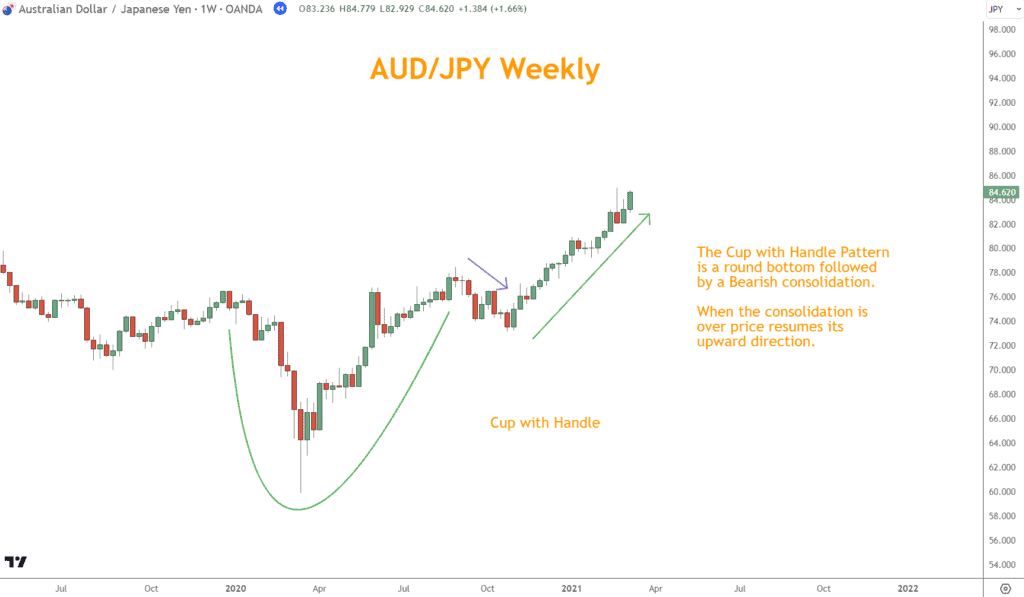
As its name suggests, the Cup with Handle pattern visually resembles a teacup when plotted on a chart.
This formation is a Bullish continuation pattern, indicating that an existing upward direction will likely continue following a period of consolidation or minor decline.
The pattern comprises two main components: the “cup” and the “handle.”
- The cup, characterized by a rounded bottom, represents a period where the market corrects or consolidates after a significant uptrend.
- This is followed by the “handle,” a smaller consolidation phase or a slight downward drift, which is the precursor to a potential Bullish breakout.
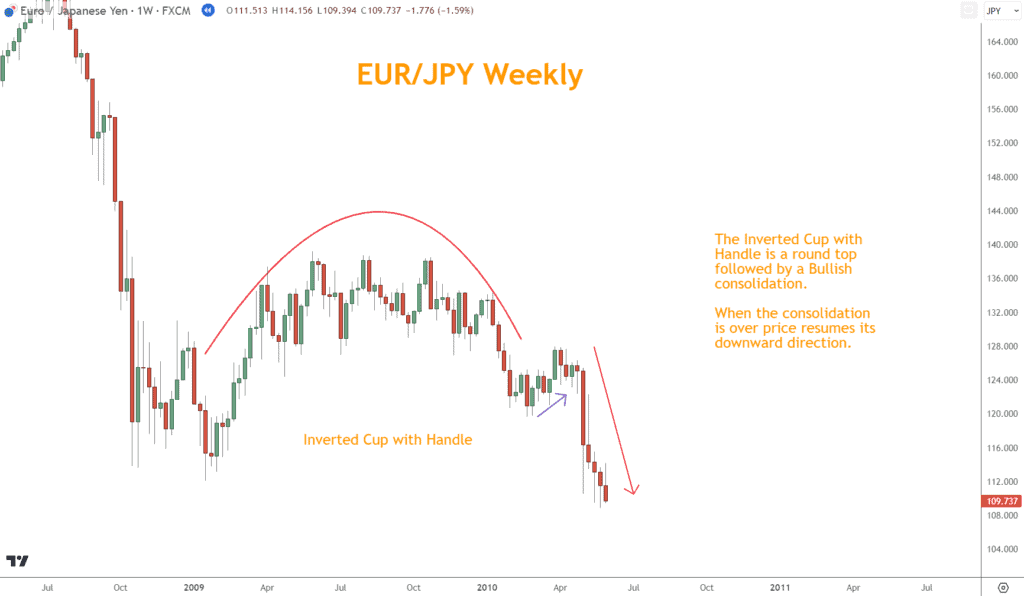
There is also a Bearish continuation pattern, which has the same characteristics but in the inverse. This is called the Inverted Cup with Handle.
Recognizing this pattern can provide valuable insights into potential future price movements, setting the stage for strategic entry and exit points.
How to Trade the Cup with Handle Pattern
Once a trader identifies the Cup with Handle formation on a chart, the next crucial step is strategizing its trade.
The pattern’s completion is marked by a breakout from the handle’s resistance, offering a prime entry point for traders. To mitigate potential risks, it’s advisable to set a stop loss just below the handle or, in some cases, beneath the cup’s bottom.
This ensures protection against unexpected price reversals.
As for profit targets, they can be projected by measuring the depth of the cup and extrapolating that distance from the breakout point.
This gives traders a quantifiable goal and helps maintain a favorable risk-reward ratio.
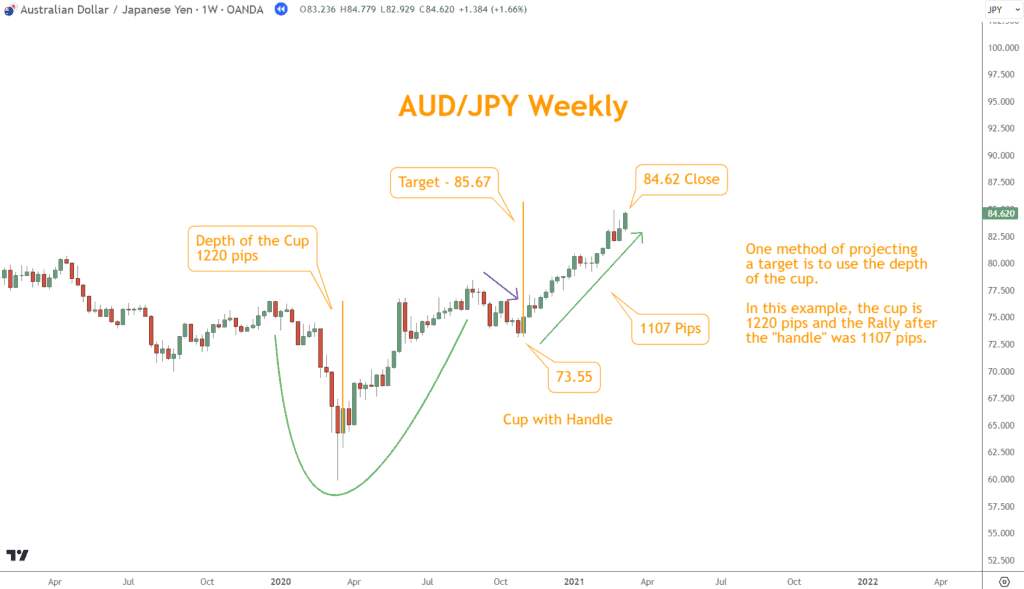
In essence, trading the Cup with Handle pattern requires precision, patience, and timely execution to capitalize on its Bullish potential.
How to Combining the Cup with Handle Pattern with Other Technical Indicators
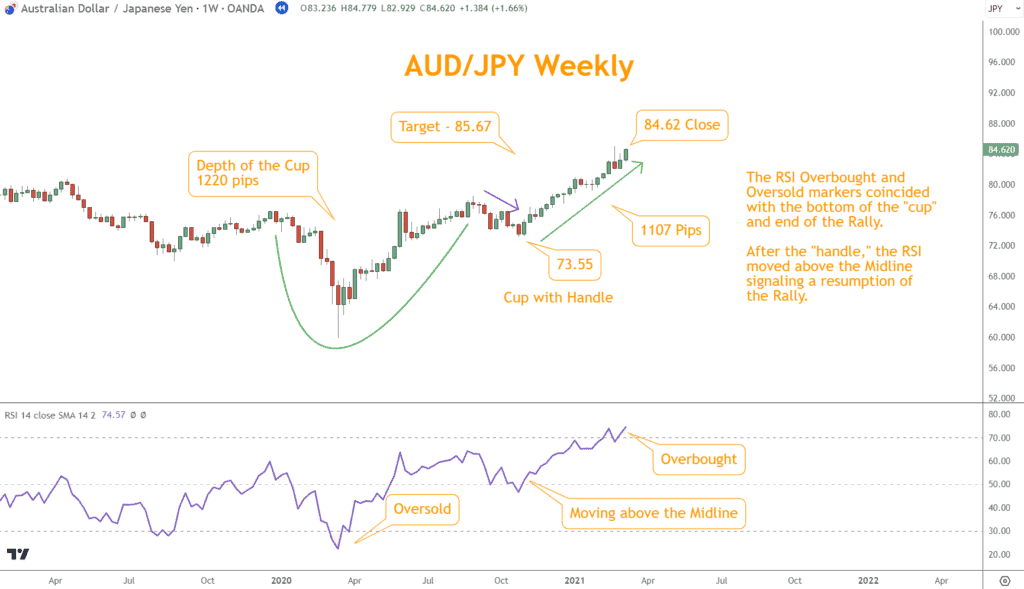
The Cup with Handle pattern is more effective when combined with other technical indicators.
Momentum, Japanese Candlestick Patterns, and Support and Resistance can help provide confirmation when you are ready to trade.
The Relative Strength Index (RSI) can identify Overbought or Oversold conditions during the pattern’s formation, offering additional layers of confirmation.
Japanese Candlestick Patterns are excellent at identifying reversals and help confirm the reversal after the downward consolidation of the handle.
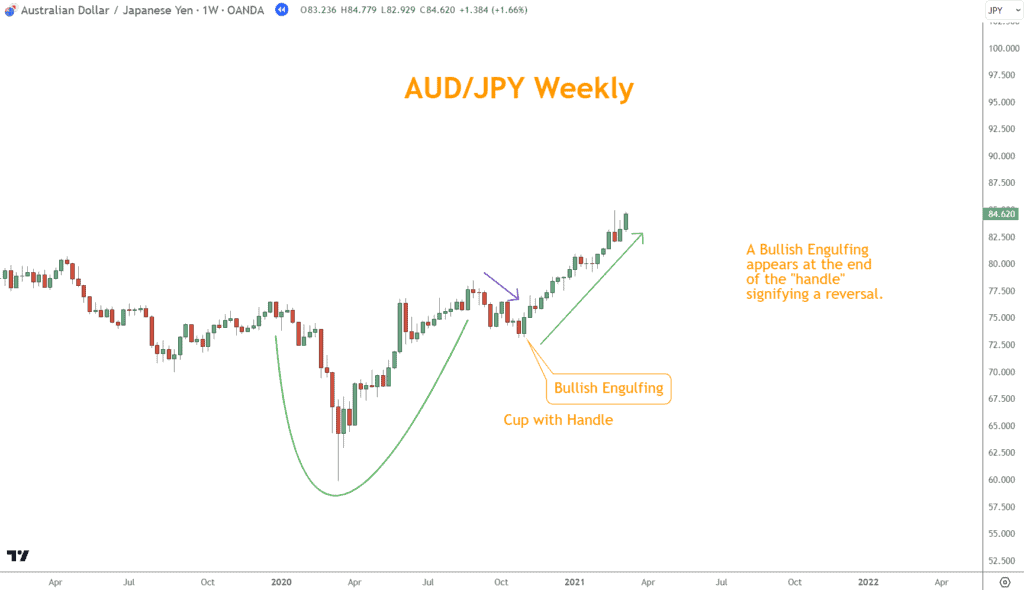
Lastly, Support and Resistance can demonstrate levels prices frequently reverse, which helps confirm the handle will lead to a move higher.
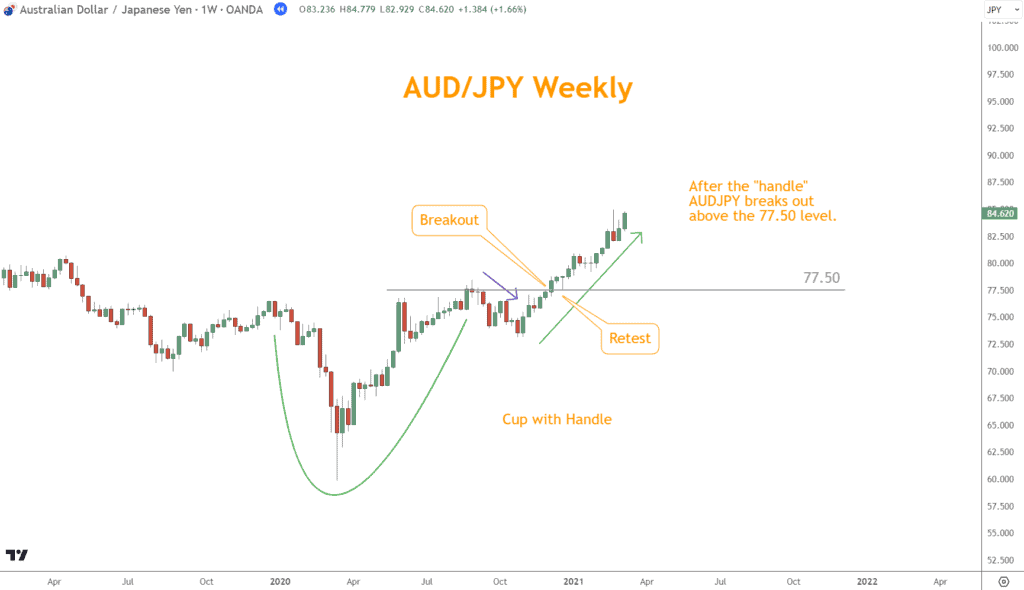
Integrating these indicators can bolster your confidence in the trades based on the Cup with Handle pattern.
How to Avoid Crashing and Burning with this Pattern
The allure of the Cup with Handle pattern lies in its potential for lucrative returns, but like all trading strategies, it’s not without its pitfalls.
One of the primary challenges traders face is distinguishing genuine breakouts from false ones.
The handle’s formation is also crucial; a well-defined handle that doesn’t retrace too deeply into the cup is often a stronger Bullish signal.
If the handle retraces more than half of the cup’s depth, it may weaken the pattern’s reliability. Above all, patience is paramount.
Jumping the gun before the pattern fully forms can lead to premature trades and potential losses.
By heeding these tips and precautions, traders can optimize their approach, maximizing the benefits of the Cup with Handle pattern while minimizing associated risks.

What’s the Next Step?
Select a favorite chart and look for Broadening Patterns using what you learned in this article.
In addition, look for opportunities to coincide them with other technical analysis tools and techniques to see how they work together.
Combining Momentum, Japanese Candlesticks, and Support and Resistance can give you a comprehensive view and understanding to make trading easier.
If you need help developing an analysis process, you can use our Six Basics of Chart Analysis. If you’re unfamiliar with the Six Basics, you can learn them here for free.
The “Six Basics” will give you a strong foundation in chart analysis, which you can incorporate with what you’ve learned about these crosses.
In addition, when you get the “Six Basics,” you’ll also get Forex Forecast delivered to your inbox every Sunday.
Forex Forecast includes:
- Trade Ideas and Analysis
- I will show you the trade opportunities I’m watching using the Six Basics of Chart Analysis and Advanced Strategies.
- Case Studies from Around the Web
- Watch how applying the Six Basics worked on some of the best, most profitable trades.
- Trading Education Guides and Videos
- Want to learn most Six Basics techniques and advanced strategies?
- I produce Videos and Guides to help you learn and build a better trading practice.
- Links to New Articles
- I publish new articles on topics traders will want to know about every week, and you can find out when they post.
- Positionforex.com News
- Did something change at positionforex.com? Learn about it here first!
- Links to upcoming webinars
- Attend free webinars to improve your trading.
- And Much More
- Tools, Membership-only Videos, and more will be released in the Forex Forecast.
The best part – it’s completely free.

Frequently Asked Questions (FAQs)
How Long Should the Handle Last in Comparison to the Cup?
Typically, the handle should be shorter, often lasting one-fourth to one-third the time it took the cup to form.
Can the Cup with Handle Pattern be Inverted in a Bearish Scenario?
Yes, the inverse of the Cup with Handle pattern is known as the “Inverted Cup with Handle.”
Instead of signaling a Bullish breakout, this pattern indicates a potential Bearish breakdown.
For instance, if you see a chart where, after a Selloff, prices rise, forming a rounded top, followed by a small consolidation or upward drift before breaking downwards, you’re likely witnessing an Inverted Cup with Handle.
How Deep can the Handle Retrace into the Cup?
Ideally, the handle should not retrace more than 50% into the cup. A deeper retracement may weaken the pattern’s reliability.
How can I Differentiate Between a Cup with Handle Pattern and a Simple Rounded Bottom?
The critical difference lies in the “handle” formation. A rounded bottom doesn’t have the consolidation or slight downward drift that characterizes the handle.
For example, if you observe a chart where the price forms a rounded base but continues its upward trajectory without any consolidation phase, it’s likely just a rounded bottom.

