
In Forex trading, mastering convergence areas can dramatically improve your ability to identify potential reversals and breakouts.
A convergence area forms when multiple technical analysis methods—Japanese Candlesticks, Chart Patterns, and Support and Resistance levels—align in a single region of a price chart. This overlap of signals often reveals high-probability trading opportunities.
This guide explains how to identify such areas, use them in breakout and reversal trades, and manage risk effectively.
By the end, you’ll understand how to apply this method to make better-informed and more profitable trading decisions.
Quick Reference Table: Core Elements of a Convergence Area
| Component | Focus | Purpose | Common Patterns or Levels |
| Japanese Candlesticks | Price sentiment and reversals | Identify bullish or bearish momentum shifts | Doji, Engulfing, Hammer, Shooting Star |
| Chart Patterns | Price structure and trend context | Recognize continuation or reversal setups | Head and Shoulders, Double Tops/Bottoms, Flags, Triangles |
| Support & Resistance | Key price levels | Spot likely reversal or breakout zones | Horizontal levels, round numbers, trendlines |
TL;DR – Convergence Areas in Forex
Convergence areas occur where multiple technical analysis methods agree, increasing the likelihood of a price reversal or breakout.
This article explains:
- How to identify convergence areas using candlesticks, chart patterns, and support/resistance.
- How to trade them through breakout and reversal strategies.
- How to manage risk with stops and take-profit levels.
When used correctly, these areas can provide traders with high-confidence entries and exits that align across multiple analytical tools.
Table of Contents
- Quick Reference Table: Core Elements of a Convergence Area
- TL;DR – Convergence Areas in Forex
- Understanding Convergence Areas
- Japanese Candlesticks
- Chart Patterns
- Support and Resistance Levels
- How to Identify Convergence Areas
- Trading Strategies with Convergence Areas
- Risk Management
- Conclusion
- Quiz: Understanding Convergence Areas in Forex
- Forex Trading Disclosure Statement
Understanding Convergence Areas
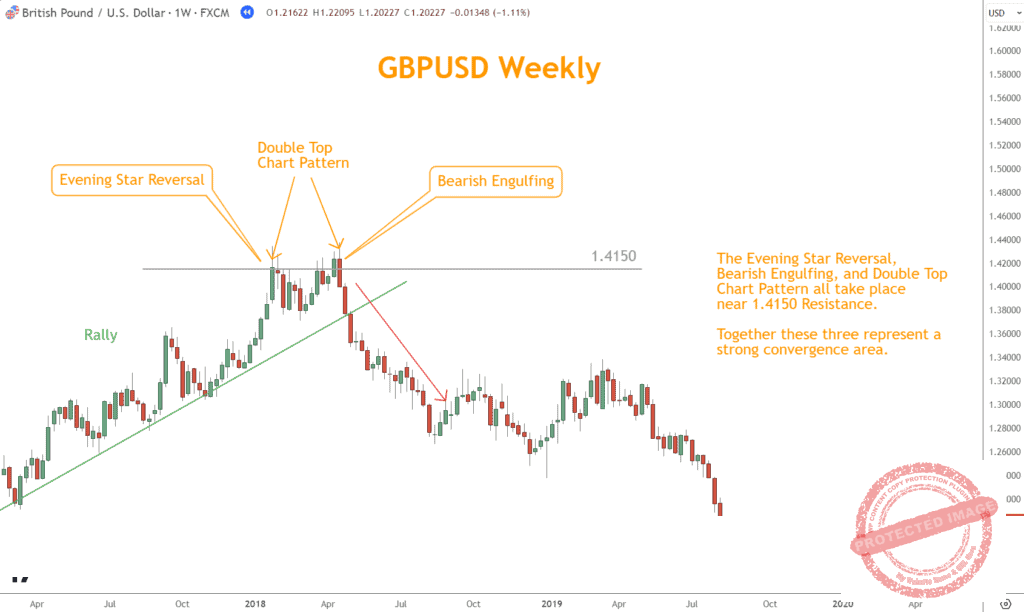
A convergence area is a region on a Forex chart where several technical factors align. Traders use these areas to identify moments when the price is likely to move strongly in one direction.
Convergence areas simplify decision-making by combining multiple signals into a single, clear picture of market sentiment.
The three core components of these zones are Japanese Candlesticks, Chart Patterns, and Support and Resistance levels.
Japanese Candlesticks
Candlestick analysis reveals market sentiment by showing the relationship between opening, closing, high, and low prices over a given period.
Each candlestick tells a story: a long wick may show rejection, while a small body can signal indecision. Patterns like the Doji, Hammer, Engulfing, and Shooting Star help traders gauge reversals or continuations.
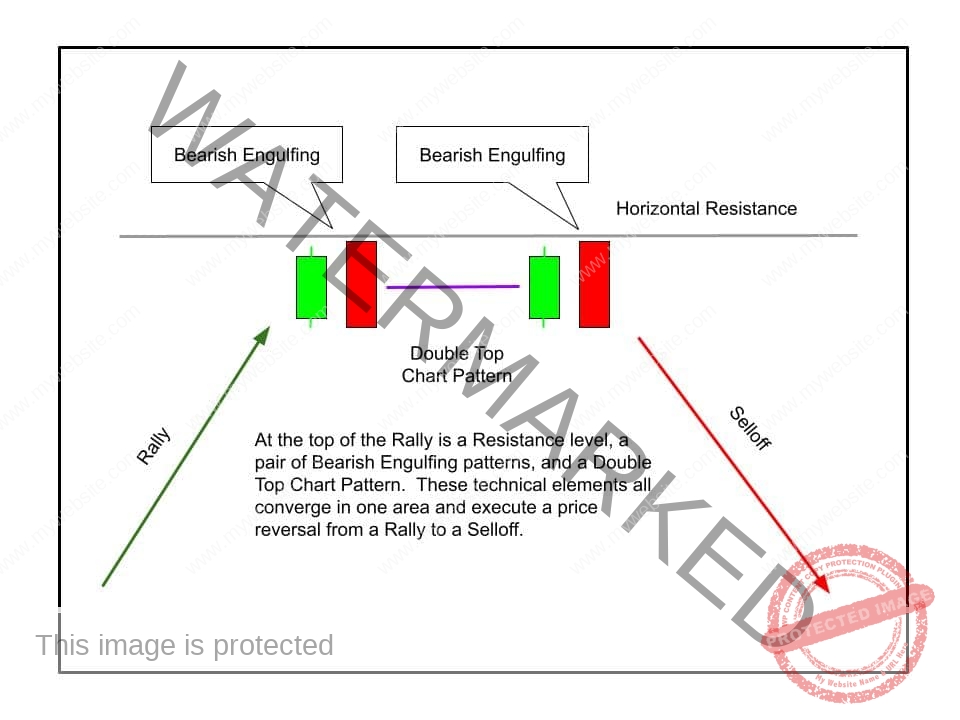
When a candlestick pattern forms at a strong support or resistance level—or within a chart pattern—it increases the reliability of the signal.
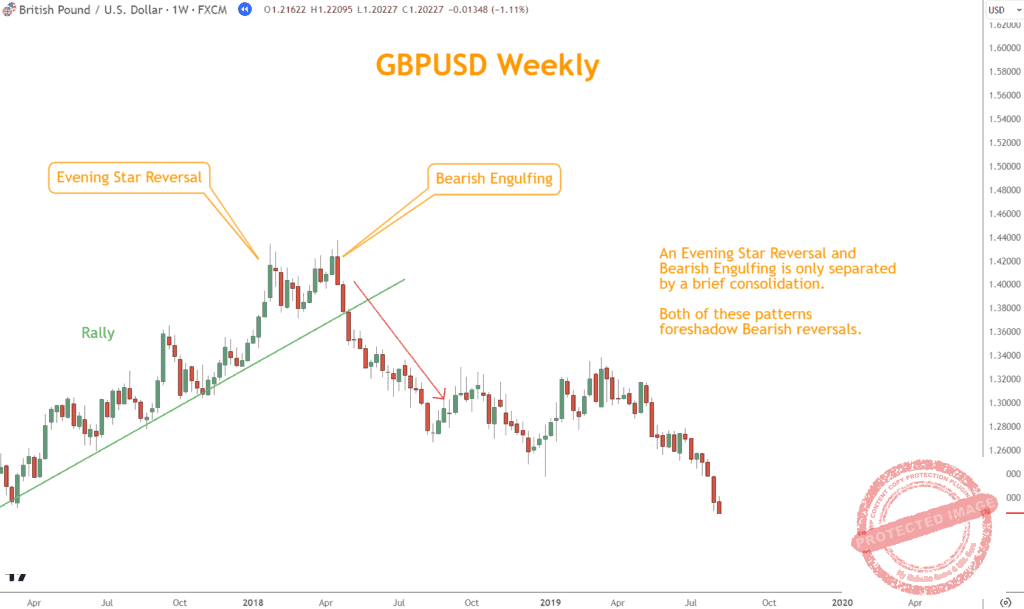
For instance, a Bearish Engulfing pattern appearing at resistance strengthens the case for a bearish convergence area, suggesting a potential downward reversal.
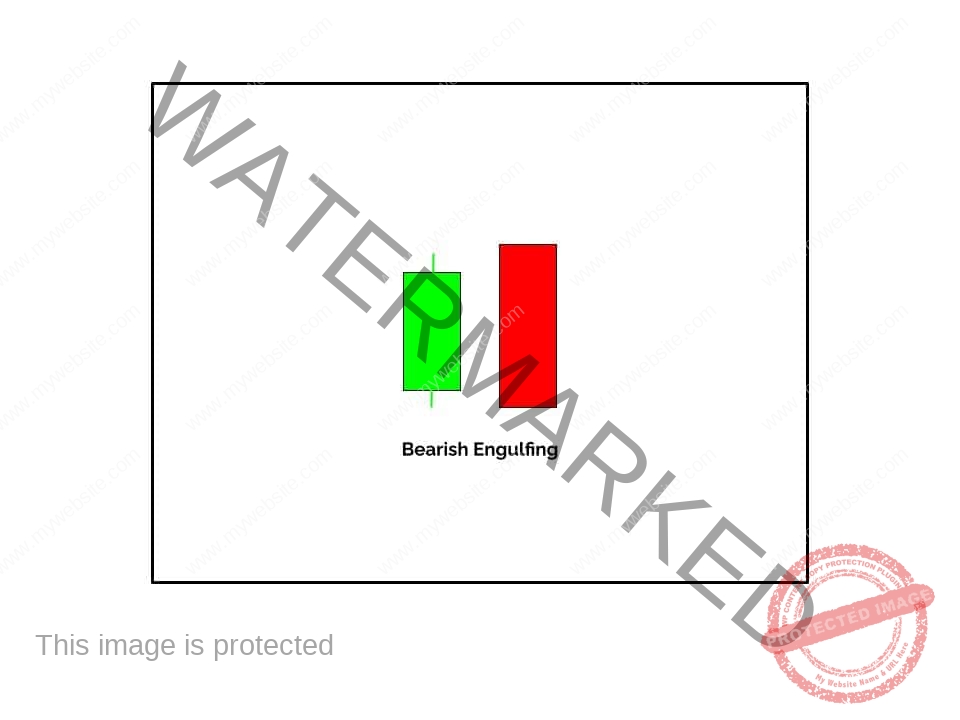
Chart Patterns
Chart patterns visually represent the market’s battle between buyers and sellers. Recognizing these patterns allows traders to anticipate possible future moves.
Patterns fall into two broad categories:
- Continuation patterns (e.g., Flags, Pennants, Triangles) indicate the existing trend will likely persist.
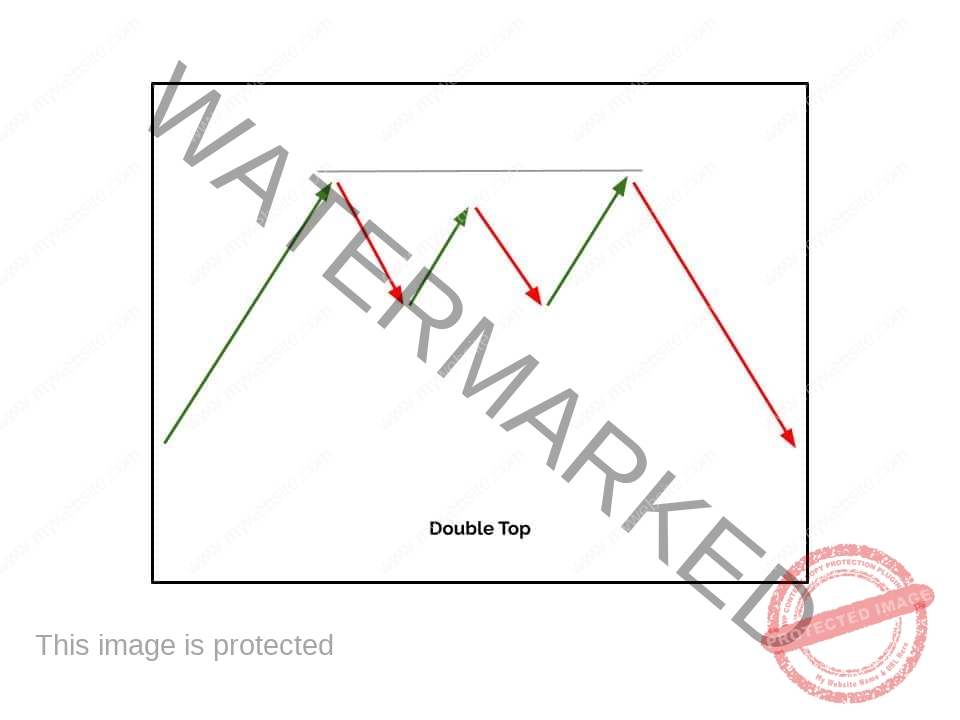
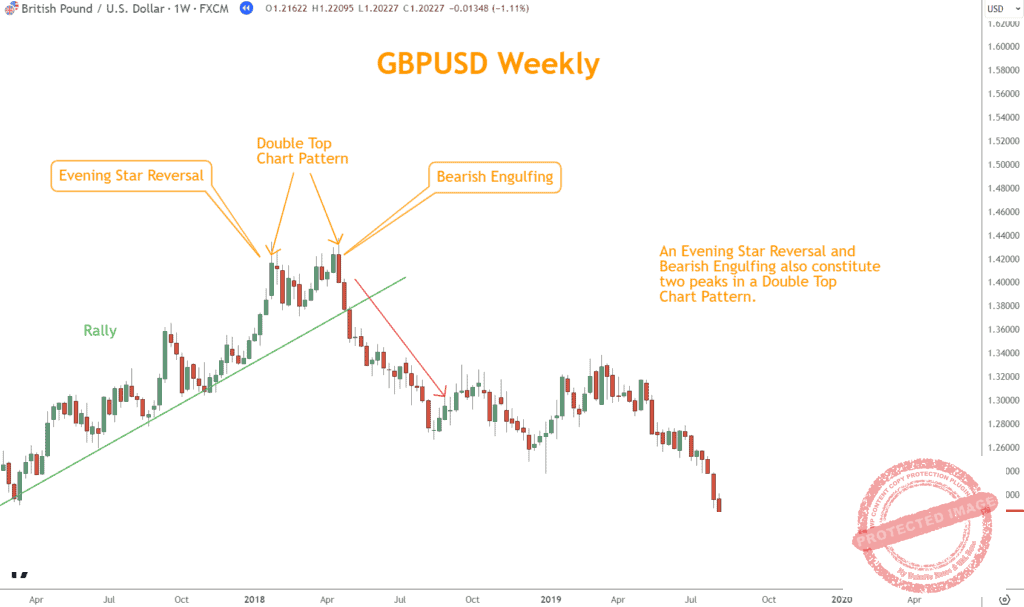
- Reversal patterns (e.g., Head and Shoulders, Double Tops, Double Bottoms) suggest an upcoming trend change.
When a chart pattern coincides with strong candlestick formations and nearby support or resistance levels, it forms a powerful convergence area. This combination often produces higher-quality signals and stronger potential price reactions.
Support and Resistance Levels
Support and Resistance levels mark the prices where market momentum tends to pause, reverse, or accelerate. These are areas where traders previously reacted strongly to price.
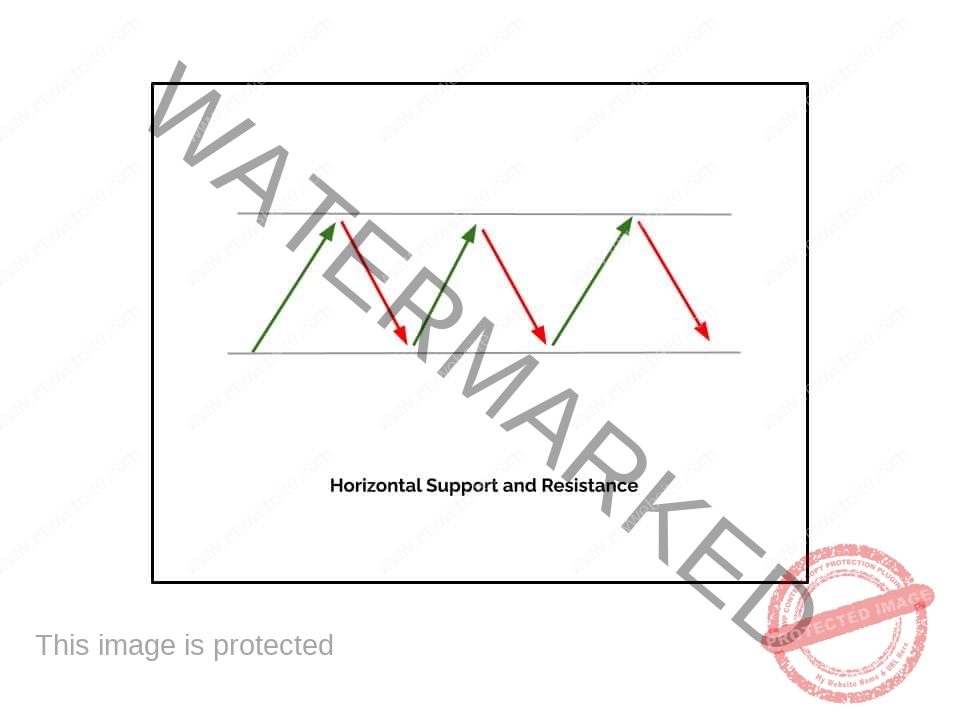
- Support occurs when buying pressure prevents further price decline.
- Resistance occurs when selling pressure prevents further upward movement.
When these levels align with significant candlestick formations or chart patterns, they confirm the strength of a convergence area.
Example: A Bearish Engulfing pattern forming near a long-tested resistance level increases the probability of a reversal, while a Bullish Hammer near support may signal an upward move.
How to Identify Convergence Areas
Identifying convergence requires careful analysis across multiple dimensions of a chart. Follow these steps:
Step 1: Identify Candlestick Patterns
Look for patterns such as Engulfing, Doji, or Hammer formations that indicate shifts in sentiment. Observe their size, body-to-wick ratio, and whether they appear near previous turning points.
Step 2: Identify Chart Patterns
Scan for structures such as Triangles, Flags, or Head-and-Shoulders formations. These take time to develop—patience and confirmation are critical.
Step 3: Mark Support and Resistance
Plot historical price levels where the market has repeatedly reversed or stalled. The more times a level holds, the more significant it becomes.
Step 4: Combine Findings
When multiple indicators converge at the same price region—such as a Head and Shoulders near a major resistance, confirmed by a Bearish Engulfing candle—you’ve found a convergence area worth monitoring.
Trading Strategies with Convergence Areas
Convergence areas can be applied in multiple ways depending on market conditions and your trading style. Two of the most effective methods are breakout trading and reversal trading.
Breakout Trading
A breakout occurs when the price decisively moves beyond a consolidation area.
- Identify the setup: Confirm that a convergence area has formed and that alignment across your indicators is present.
- Wait for breakout confirmation: Enter a trade once the price closes beyond the area with volume or momentum confirmation.
- Manage risk: Set stop-loss orders just beyond the opposite side of the convergence zone.
Example: If a bullish convergence area forms near resistance, a break above that level may signal the start of a new uptrend—ideal for a long entry.
Reversal Trading
Reversal trading seeks to capture price movements in the opposite direction of the prevailing trend once the market shows exhaustion.

- Spot reversal signals: Look for patterns like Head and Shoulders or Double Tops in conjunction with reversal candlestick formations.
- Confirm the level: Ensure the setup aligns with a major support or resistance level.
- Enter with discipline: Execute trades only after clear confirmation, such as a candle close opposite the prior trend direction.
Example: A Bearish convergence area forming with a Head and Shoulders pattern near resistance may present a strong shorting opportunity.
Risk Management
Even strong setups can fail, so risk control is essential. Always define your risk before entering a trade.
- Use stop-loss orders below support (for long trades) or above resistance (for short trades).
- Set take-profit targets based on the size of the convergence area or prior swing levels.
- Avoid overleveraging and limit total exposure per trade.
Proper risk management ensures you stay consistent even when individual trades don’t go as planned.
Conclusion
Convergence areas offer traders a comprehensive way to analyze markets and spot profitable setups. By combining candlestick patterns, chart patterns, and support/resistance levels, you can identify areas where price is most likely to react.
Mastering this method takes practice, patience, and sound risk management—but the reward is a more disciplined and data-driven trading approach.
If you’re new to structured analysis, download The Six Basics of Chart Analysis to strengthen your foundation and join the Forex Forecast newsletter for free weekly trade ideas and education.

Quiz: Understanding Convergence Areas in Forex
- What defines a convergence area in Forex trading?
a. A single candlestick pattern forming near support
b. A region where multiple technical indicators align
c. A moving average crossover signal
d. A time-based trading signal - Which three components form a convergence area?
a. Moving averages, Bollinger Bands, Fibonacci retracements
b. Japanese Candlesticks, Chart Patterns, Support and Resistance
c. RSI, MACD, Stochastic Oscillator
d. Pivot Points, Trendlines, Volume - What type of pattern is a Head and Shoulders formation?
a. Continuation pattern
b. Volatility pattern
c. Reversal pattern
d. Momentum pattern - What should traders do when a price breaks above a bullish convergence area?
a. Wait for a retracement to support
b. Enter a long position upon confirmation
c. Immediately short the currency pair
d. Ignore the signal until next session - Why is risk management crucial when trading convergence areas?
a. It ensures profits on every trade
b. It allows unlimited leverage
c. It helps limit losses and preserve capital
d. It eliminates market volatility
Answer Key:
- b
- b
- c
- b
- c
Forex Trading Disclosure Statement
Risk Warning:
Forex trading involves significant risk and may not be suitable for all investors. The leveraged nature of Forex trading can work both for and against you, leading to substantial gains or losses. Before trading Forex, you should carefully consider your financial objectives, experience level, and risk tolerance. It is possible to lose more than your initial investment, and you should only trade with money you can afford to lose.
Market Risks and Volatility:
Forex markets are influenced by global economic, political, and social events, which can result in unpredictable price movements. High market volatility can lead to sudden and substantial changes in currency values, potentially causing losses that exceed your initial deposit.
Leverage Risks:
Leverage amplifies both potential gains and potential losses. While leverage can increase profitability, it also increases the risk of significant losses, including the loss of your entire trading capital.
Trading Tools and Technology Risks:
Forex trading platforms, including those offered by brokers, are subject to technology risks such as system failures, latency issues, and potential errors in price feeds. These risks can affect trade execution and outcomes.
No Guarantee of Profitability:
Past performance in Forex trading is not indicative of future results. There is no guarantee of profit or avoidance of loss when trading Forex.
Educational Purposes Only:
The information in this article is for educational purposes only and should not be considered financial advice. Consult a qualified financial advisor before making any trading decisions.
Regulatory Compliance:
Ensure you are trading with a licensed and compliant broker in your country of residence.
Responsibility:
You are solely responsible for your trading decisions and their outcomes. Understand all terms, conditions, and risks before trading.
Acknowledgment:
By engaging in Forex trading, you acknowledge that you have read, understood, and accepted this disclosure statement.