

Trading chart patterns helps you identify both reversal and continuation opportunities in the forex market.
When you can recognize these structures, you gain clearer entries, stronger exits, and sharper context for price action.
This guide explains eight powerful patterns every trader must know, how to use them, and how to combine them with trend, momentum, candlesticks, and support/resistance for higher-probability trading.
TL;DR — Quick Summary
- Chart Patterns are geometric shapes formed by price that reveal trader psychology.
- Two types exist: Continuation Patterns (trend resumes) and Reversal Patterns (trend changes).
- The eight essential patterns: Pennants, Flags, Rectangles, Triangles, Head & Shoulders, Inverse Head & Shoulders, Double Tops/Bottoms, and Wedges.
- Chart patterns should never be used alone. Combine them with trend, momentum, candlesticks, and support/resistance for confirmation.
- Best results come from trading patterns in context, with proper stops, risk-reward, and confirmation.
What Are Chart Patterns?
The “father” of chart pattern analysis is Richard Schabacker, whose 1932 work, Technical Analysis and Stock Market Profits, established repeatable price structures as a foundation of market psychology.
Over time, traders expanded on his ideas, recognizing that patterns help identify exhaustion, continuation, and reversal across markets and timeframes.
Chart Patterns are geometric shapes drawn from price action and represent crowd psychology—fear, greed, indecision, accumulation, or distribution.
Their effectiveness increases significantly when combined with other analysis methods, such as trend, momentum, candlesticks, and support/resistance.
Continuation vs. Reversal Patterns (Summary Table)
| Pattern Category | Purpose | Typical Location | Market Meaning |
| Continuation | The trend is likely to resume | Midpoint of a Rally or Selloff | Temporary pause before breakout |
| Reversal | The trend may end and turn | End of Rallies/Selloffs | Momentum exhaustion + structure change |
Continuation Chart Patterns (4 You Must Know)
Continuation patterns signal that the market is temporarily pausing before resuming its original direction.
They help traders avoid premature reversal trades and stay aligned with the prevailing trend.
Continuation Pattern Table
| Pattern | Visual Description | What It Signals | Confirmation Needed |
| Pennant | Small converging triangle after a strong move | Trend will likely continue after a brief consolidation | Breakout in the direction of the prior move |
| Flag | Small rectangular pullback opposite trend | Market is pausing before continuing the Rally/Selloff | Breakout + momentum pickup |
| Rectangle | Horizontal Support & Resistance band | The trend will resume after consolidation | Break of range + confirmation |
| Triangles (Symmetrical, Ascending, Descending) | Converging trendlines forming a pressure zone | Continuation of the original trend upon breakout | Breakout + retest or momentum agreement |
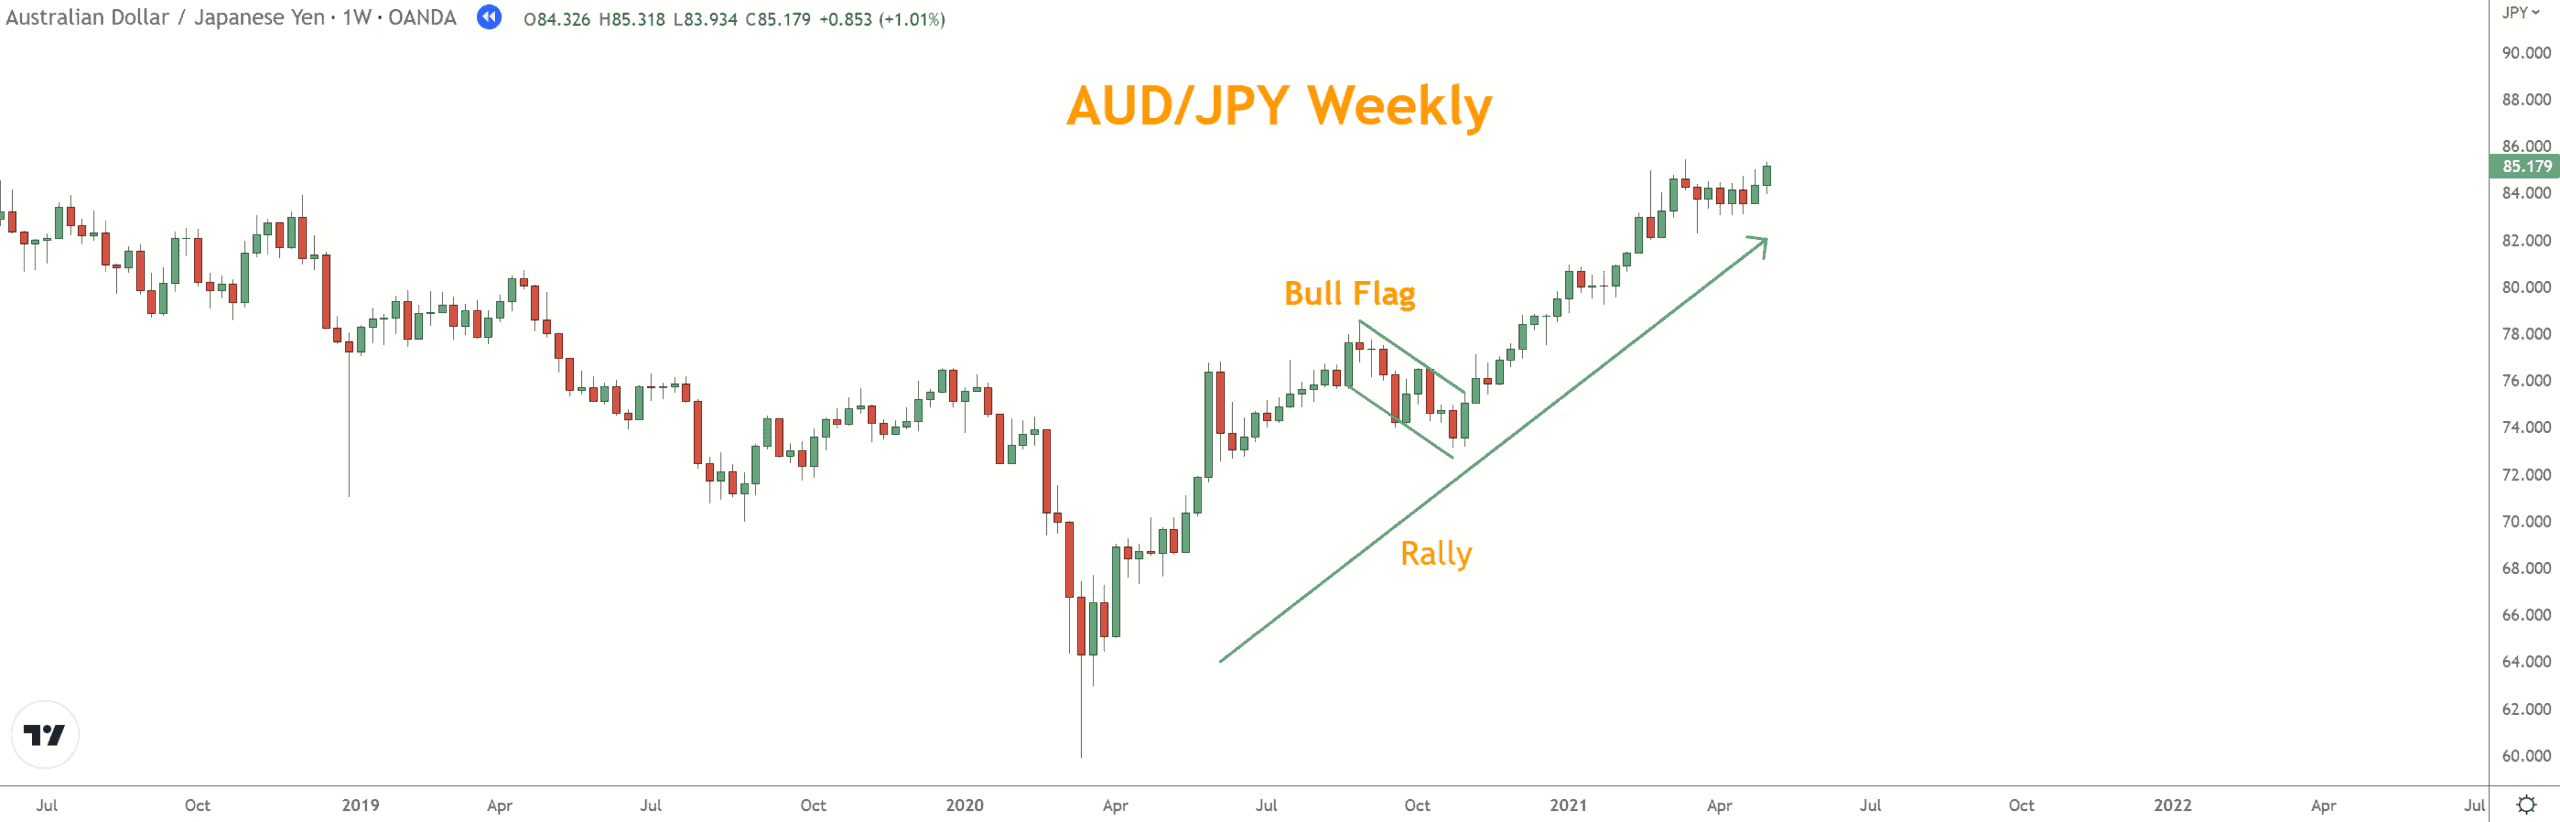
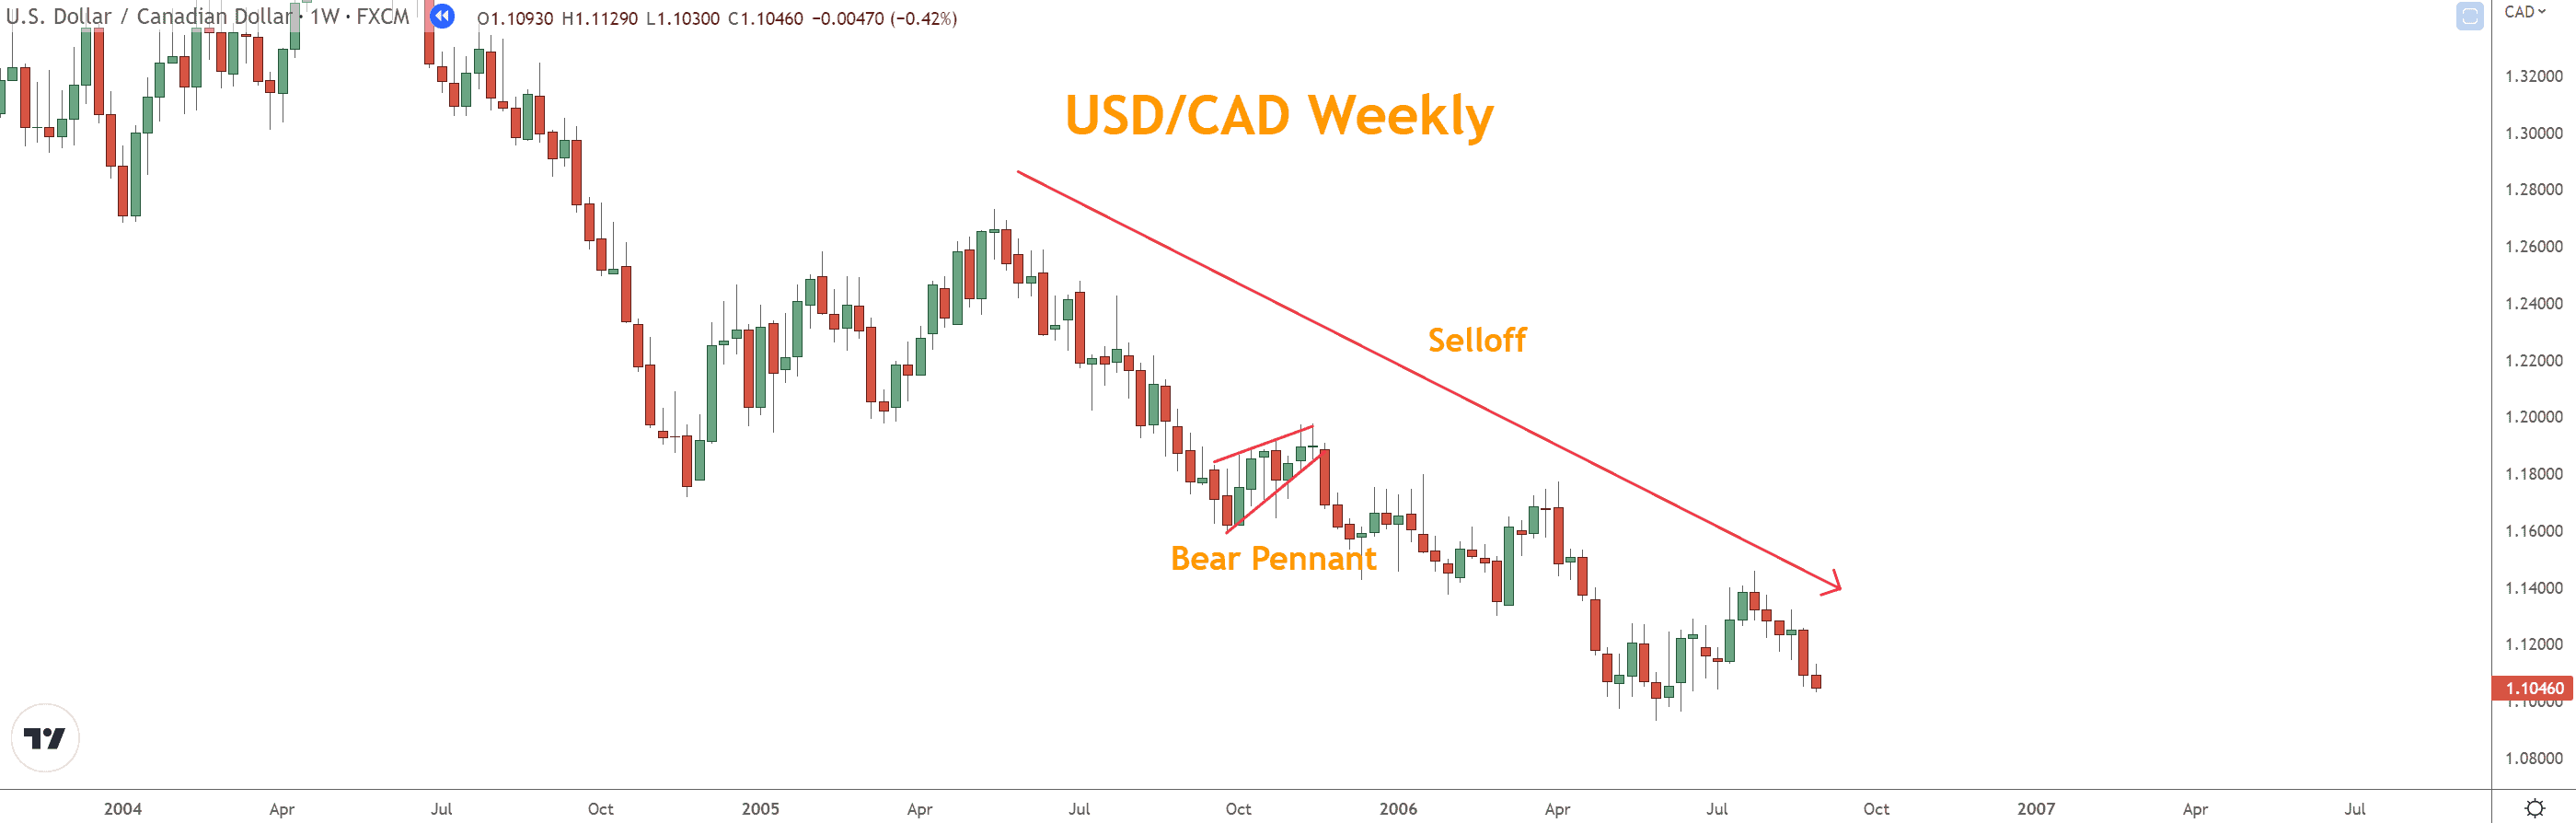
Pennants and Flags often appear after sharp, impulsive moves.
This price action often corresponds with an uptrend or downtrend in a market. A Pennant’s price pattern forms small wedge patterns, whereas a Flag is usually horizontal.
See in the price charts below examples of a Bull Flag and a Bear Pennant
Once complete, the instrument returns to its original direction.
Rectangles often form between Support and Resistance lines, each a Support level and a Resistance level.
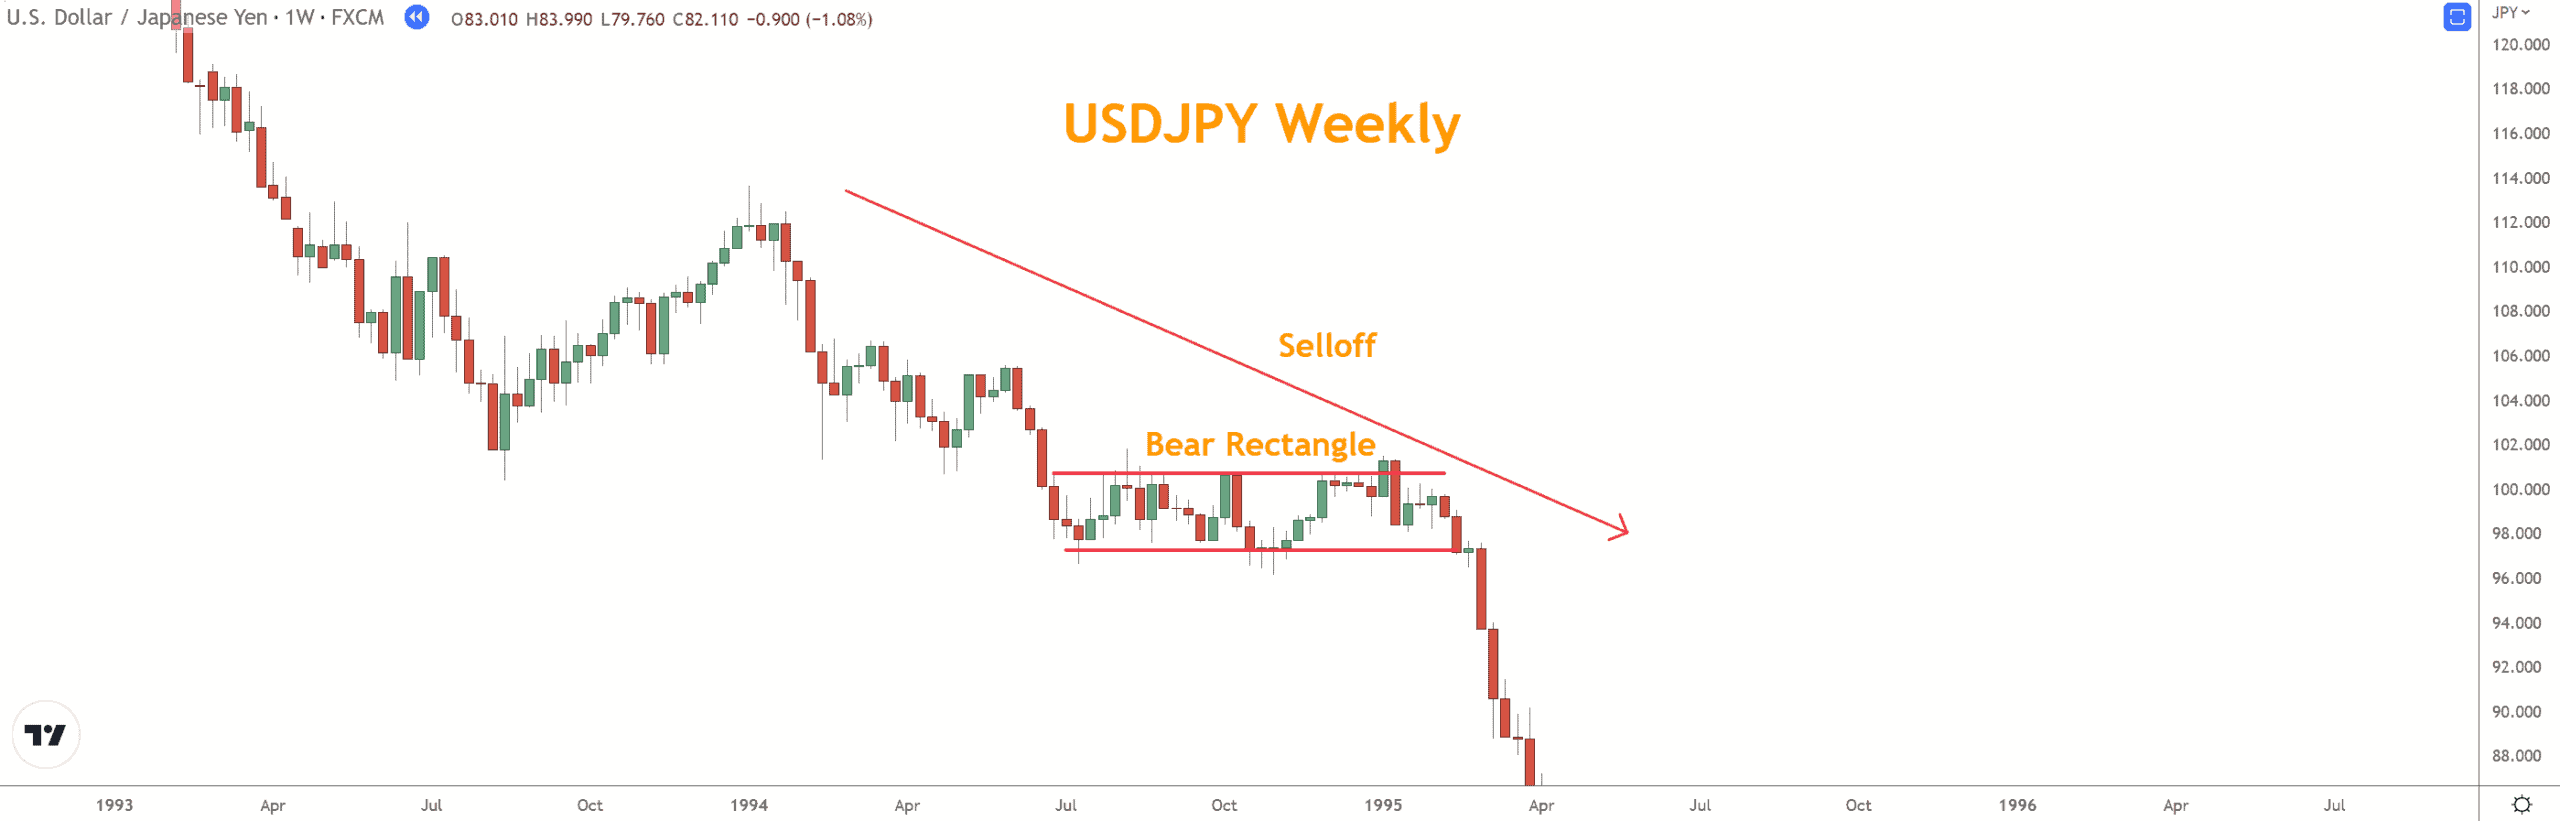
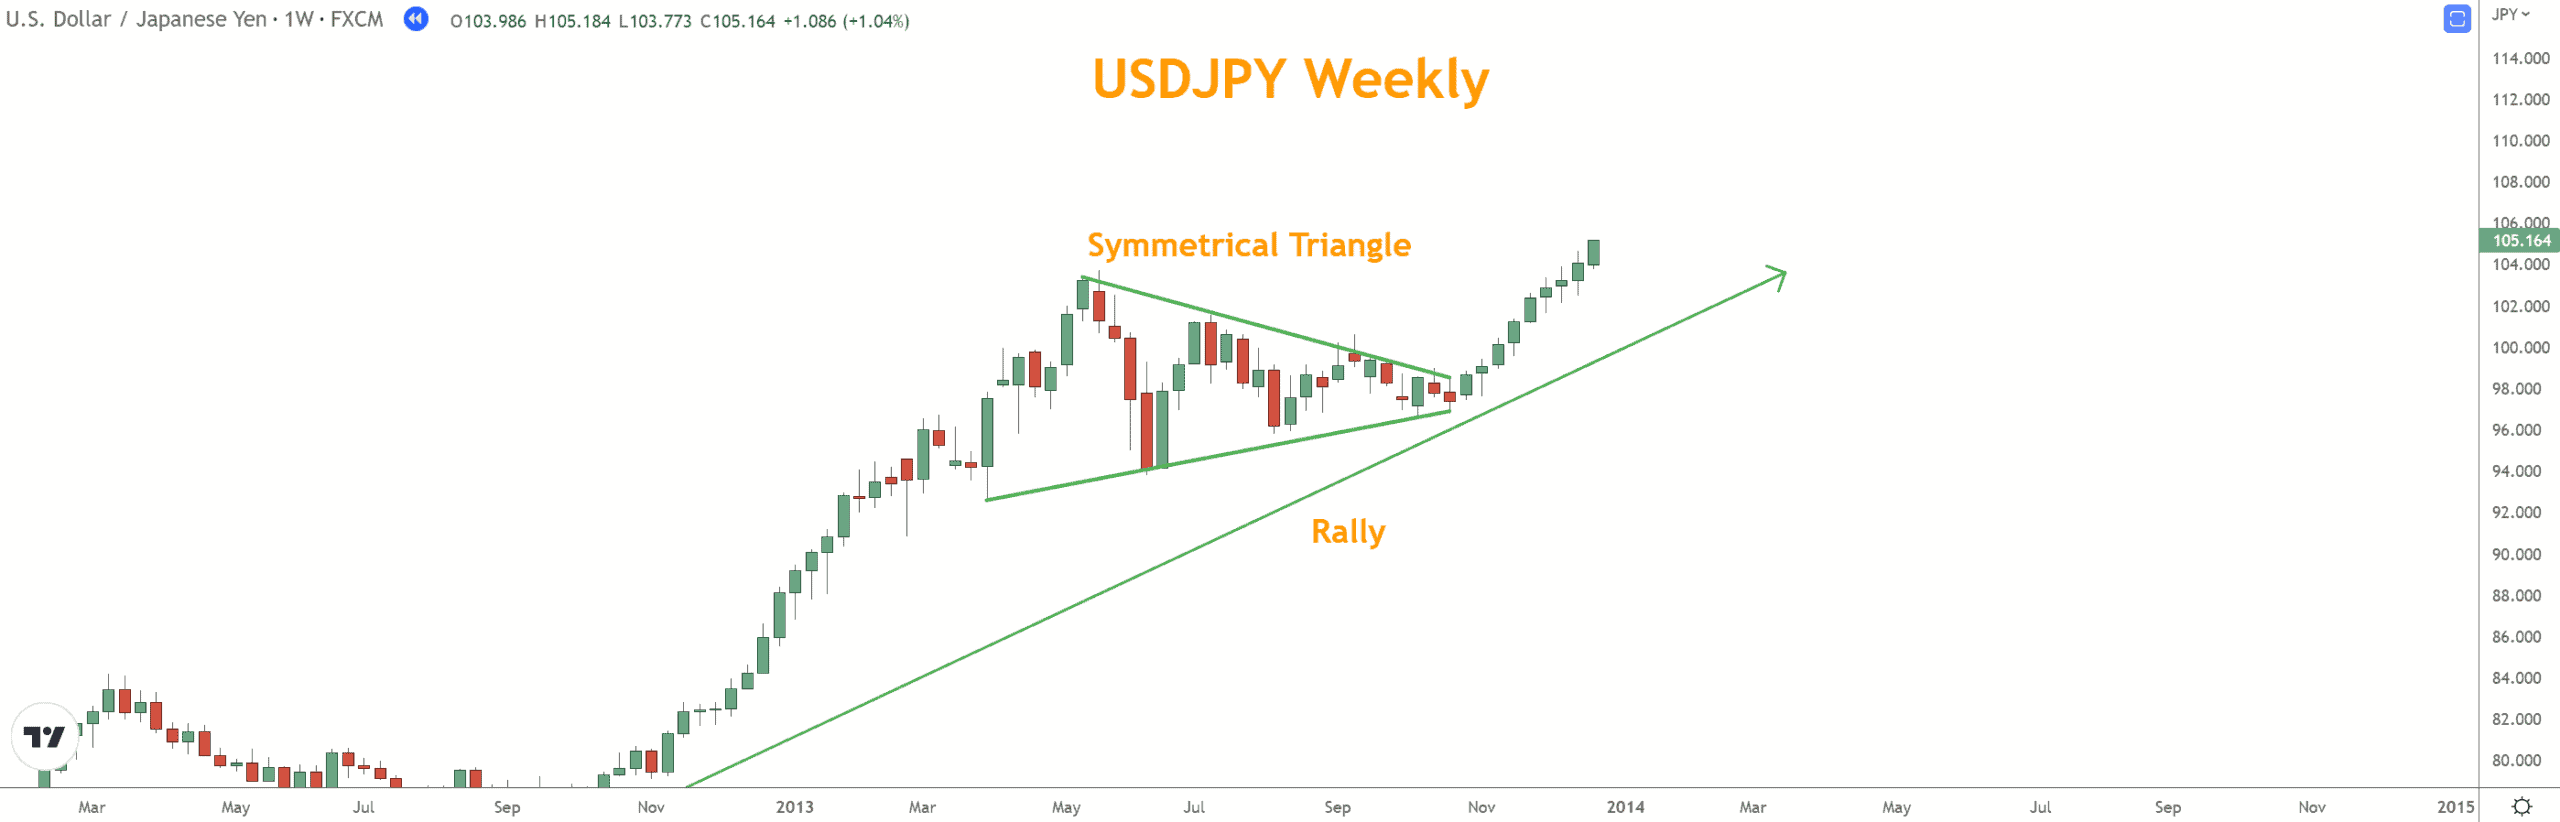
Rectangles represent consolidation zones. Triangles compress energy before a momentum breakout.
Symmetrical triangles form with two converging lines coming together at a point and price action trading between them.
The pattern is complete when the price breaks out of the triangle to the upside or downside, consistent with its original direction.
The initial direction may include a Bullish or Bearish trendline.
Looking for a Strategy?
Download the Six Basics of Chart Analysis and sign up for Forex Forecast to learn a bottom-up approach to analyzing Forex markets and weekly market updates.
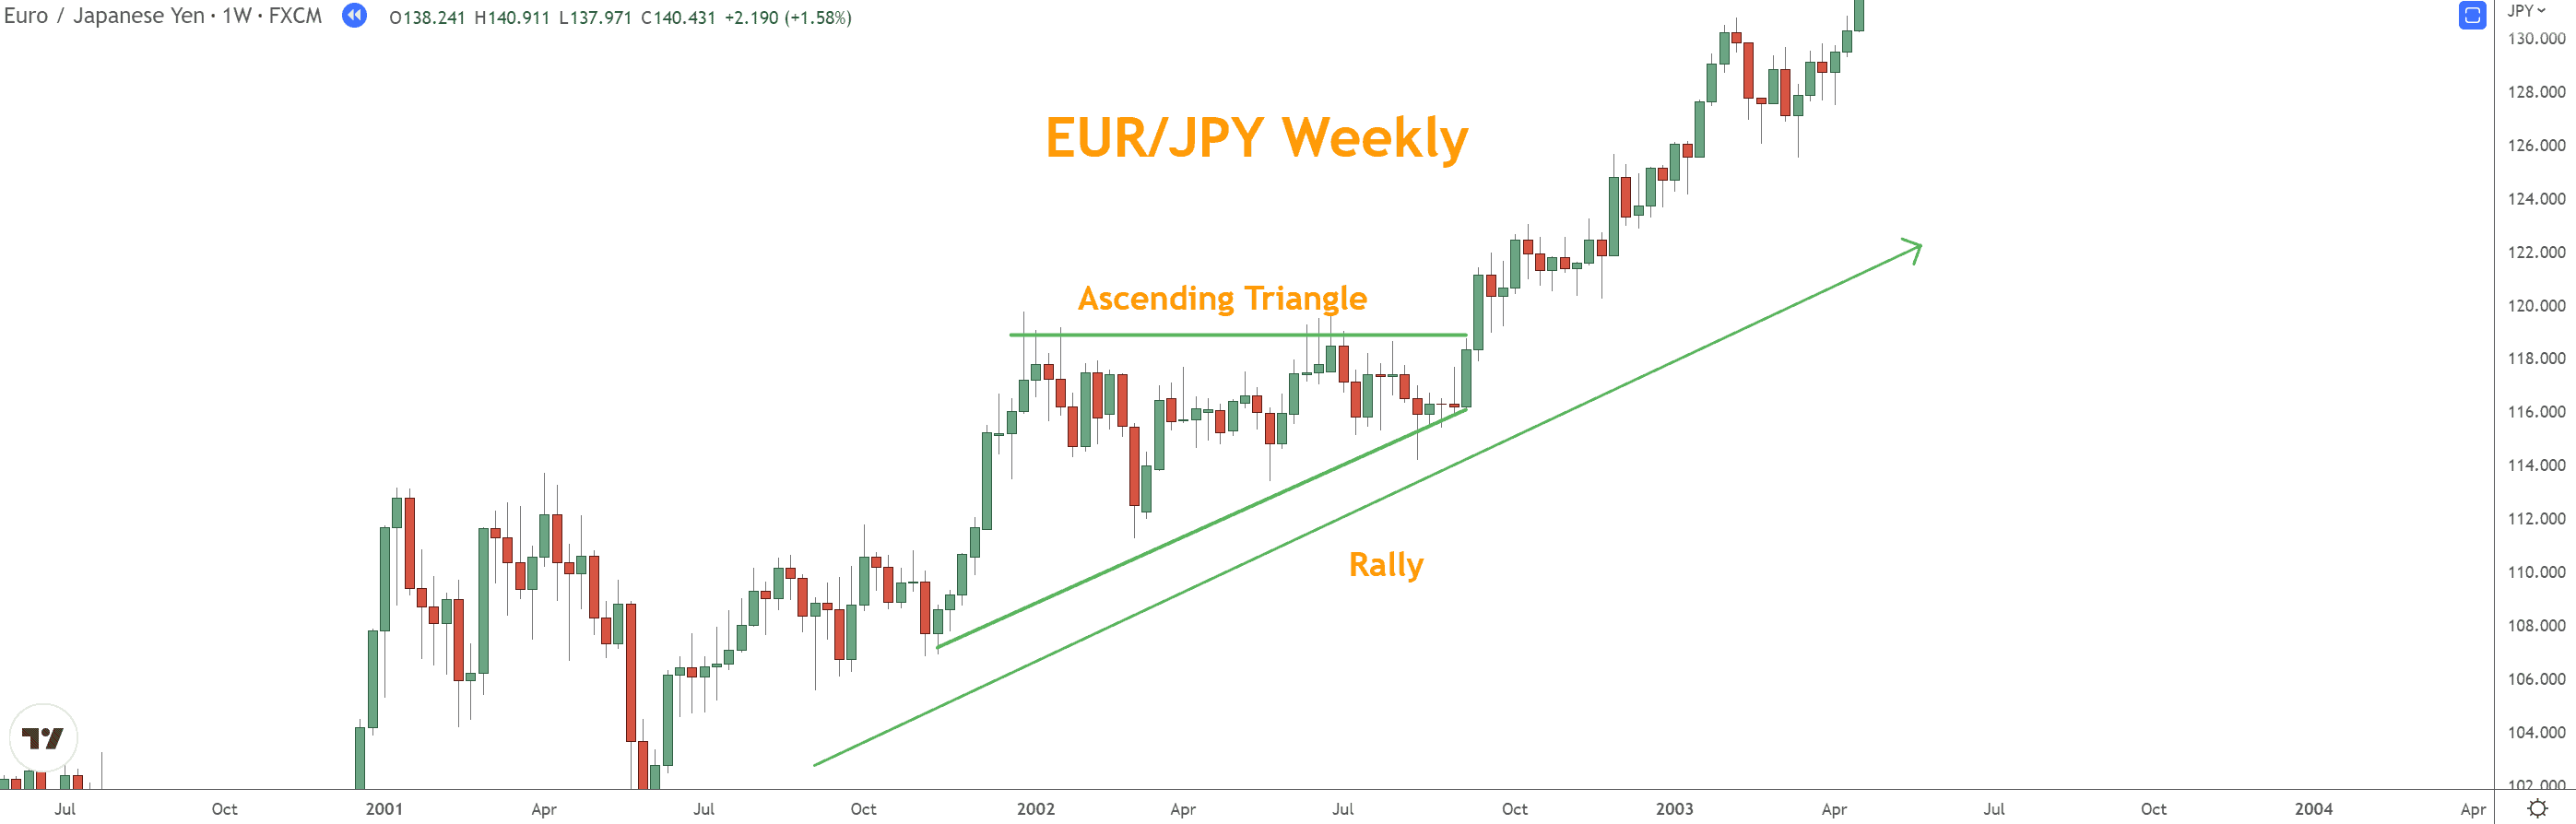
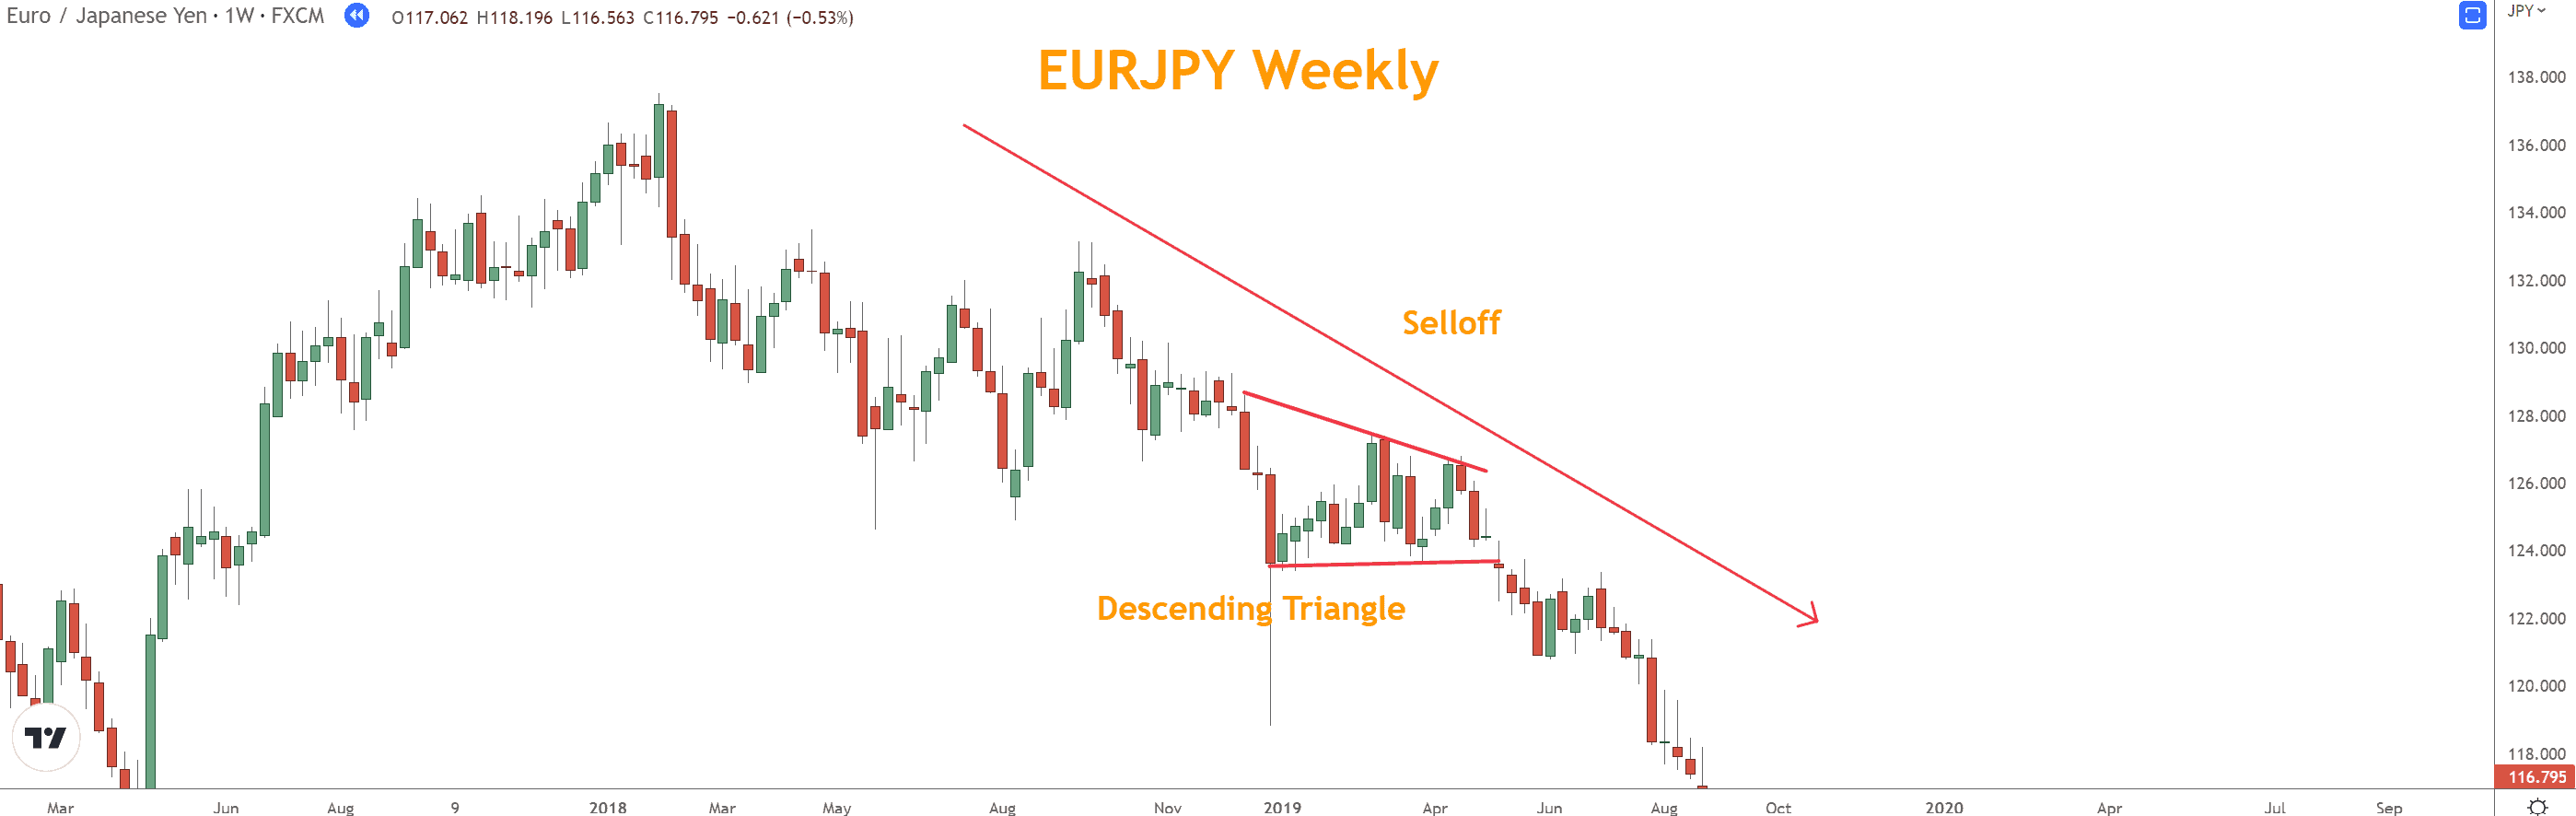
Ascending Triangles are a bullish continuation pattern that occurs during rallies with an upward trend, flat Resistance, and rising Support, creating a triangle that completes on an upside breakout.
Conversely, Descending Triangles are a bearish continuation pattern that forms during Selloffs with a downward trend, falling Support, and horizontal Resistance, leading to a breakdown and pattern completion.
Reversal Chart Patterns (4 You Must Know)
Reversal patterns help identify when a prevailing Rally or Selloff is losing strength and preparing to change direction.
Reversal Pattern Table
| Pattern | Structure Description | What It Signals | Confirmation Needed |
| Head & Shoulders | Peak–higher peak–lower peak + neckline | Bearish reversal after a Rally | Neckline break + candlestick/momentum |
| Inverse Head & Shoulders | Trough–lower trough–higher trough + neckline | Bullish reversal after a Selloff | Breakout above neckline + test |
| Double Top / Double Bottom | Two peaks or troughs at similar levels | Reversal when Support/Resistance holds | Break of midpoint swing (“neckline”) |
| Wedges (Falling/Bullish, Rising/Bearish) | Converging lines + momentum loss | Falling Wedge = Bullish; Rising Wedge = Bearish | Breakout + follow-through |
Head and Shoulders and Inverse Head and Shoulders
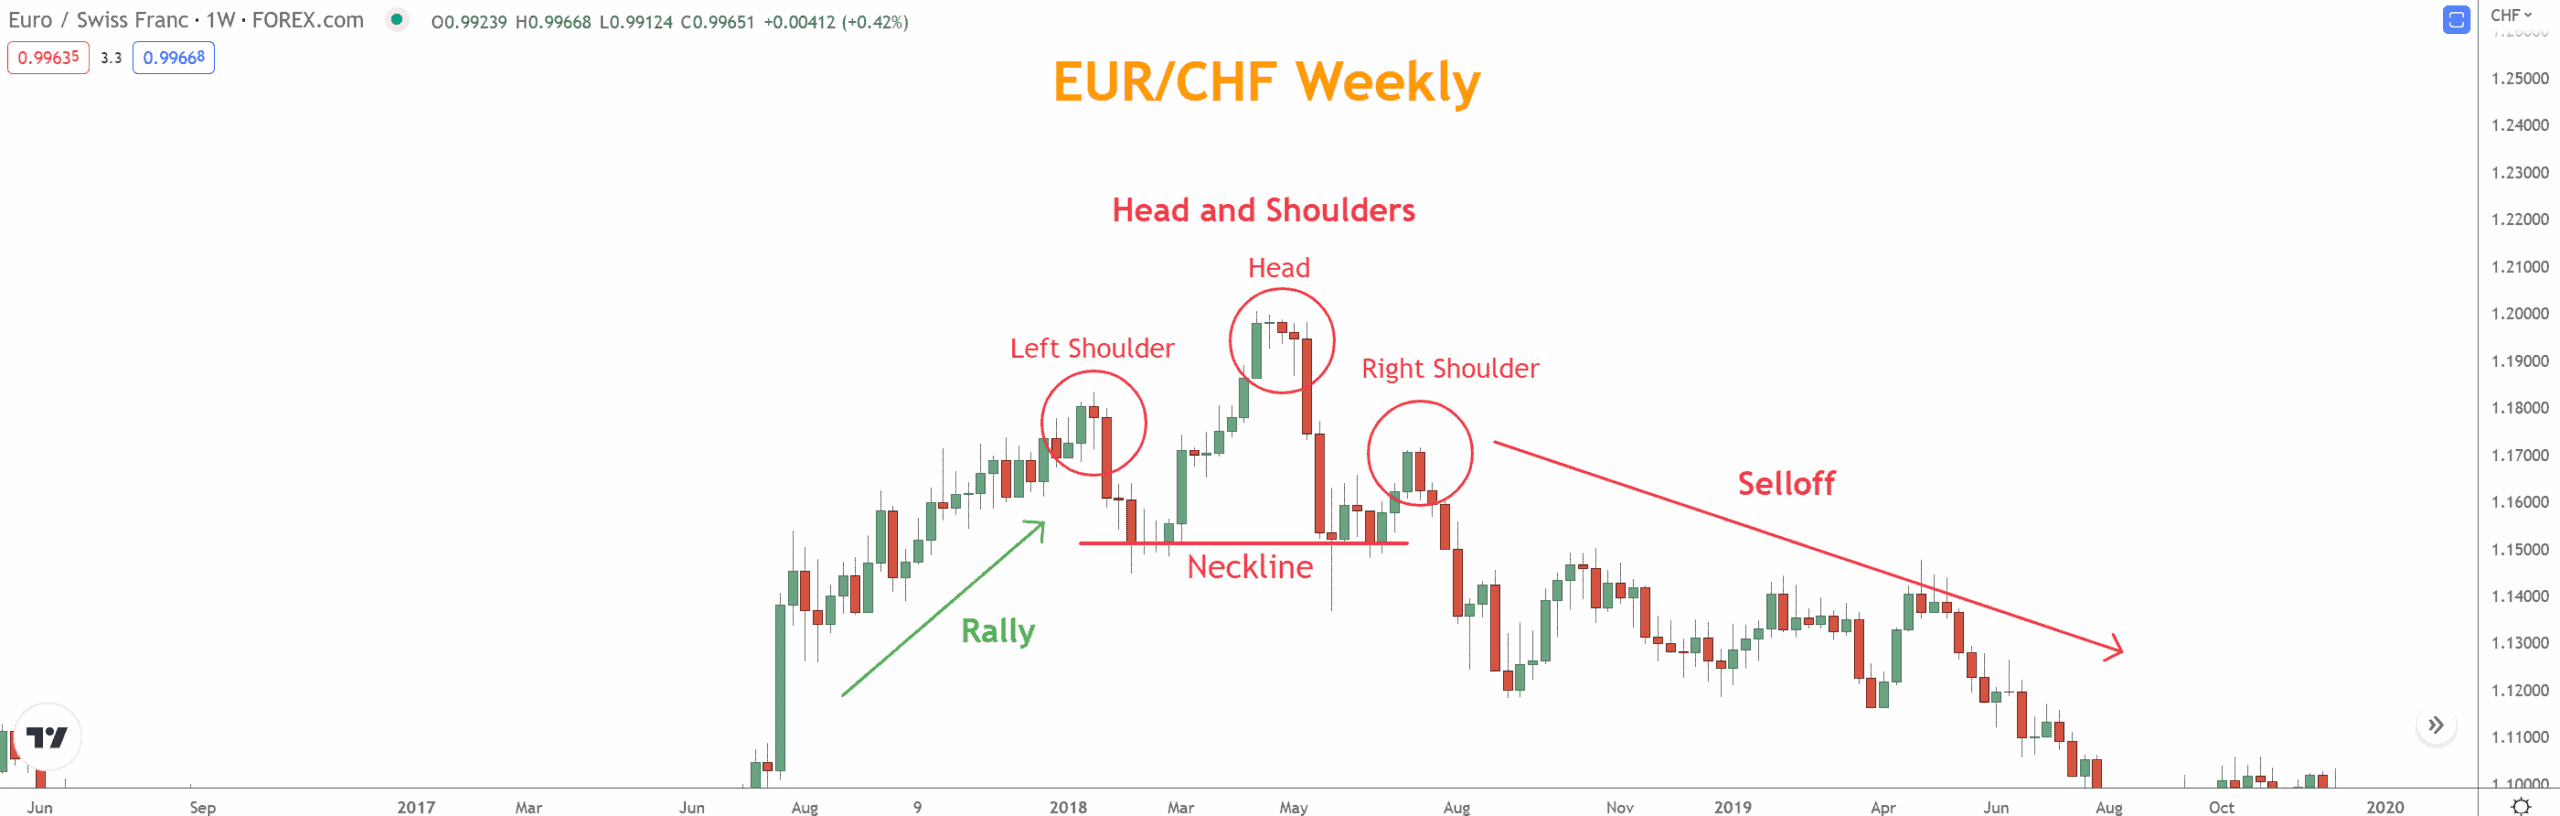
The Head and Shoulders pattern is one of the most recognizable reversal patterns. It occurs after a Rally and signals a potential selloff.
The pattern is created by a peak (left shoulder top), followed by a higher peak (head), followed by a peak similar to the first (right shoulder top).
This creates a “rounding bottom” on the price chart, with shoulders as smaller peaks.
The neckline is created by connecting the lows of the two troughs between the shoulders and head. A breakout below the neckline signals that the price could fall lower.
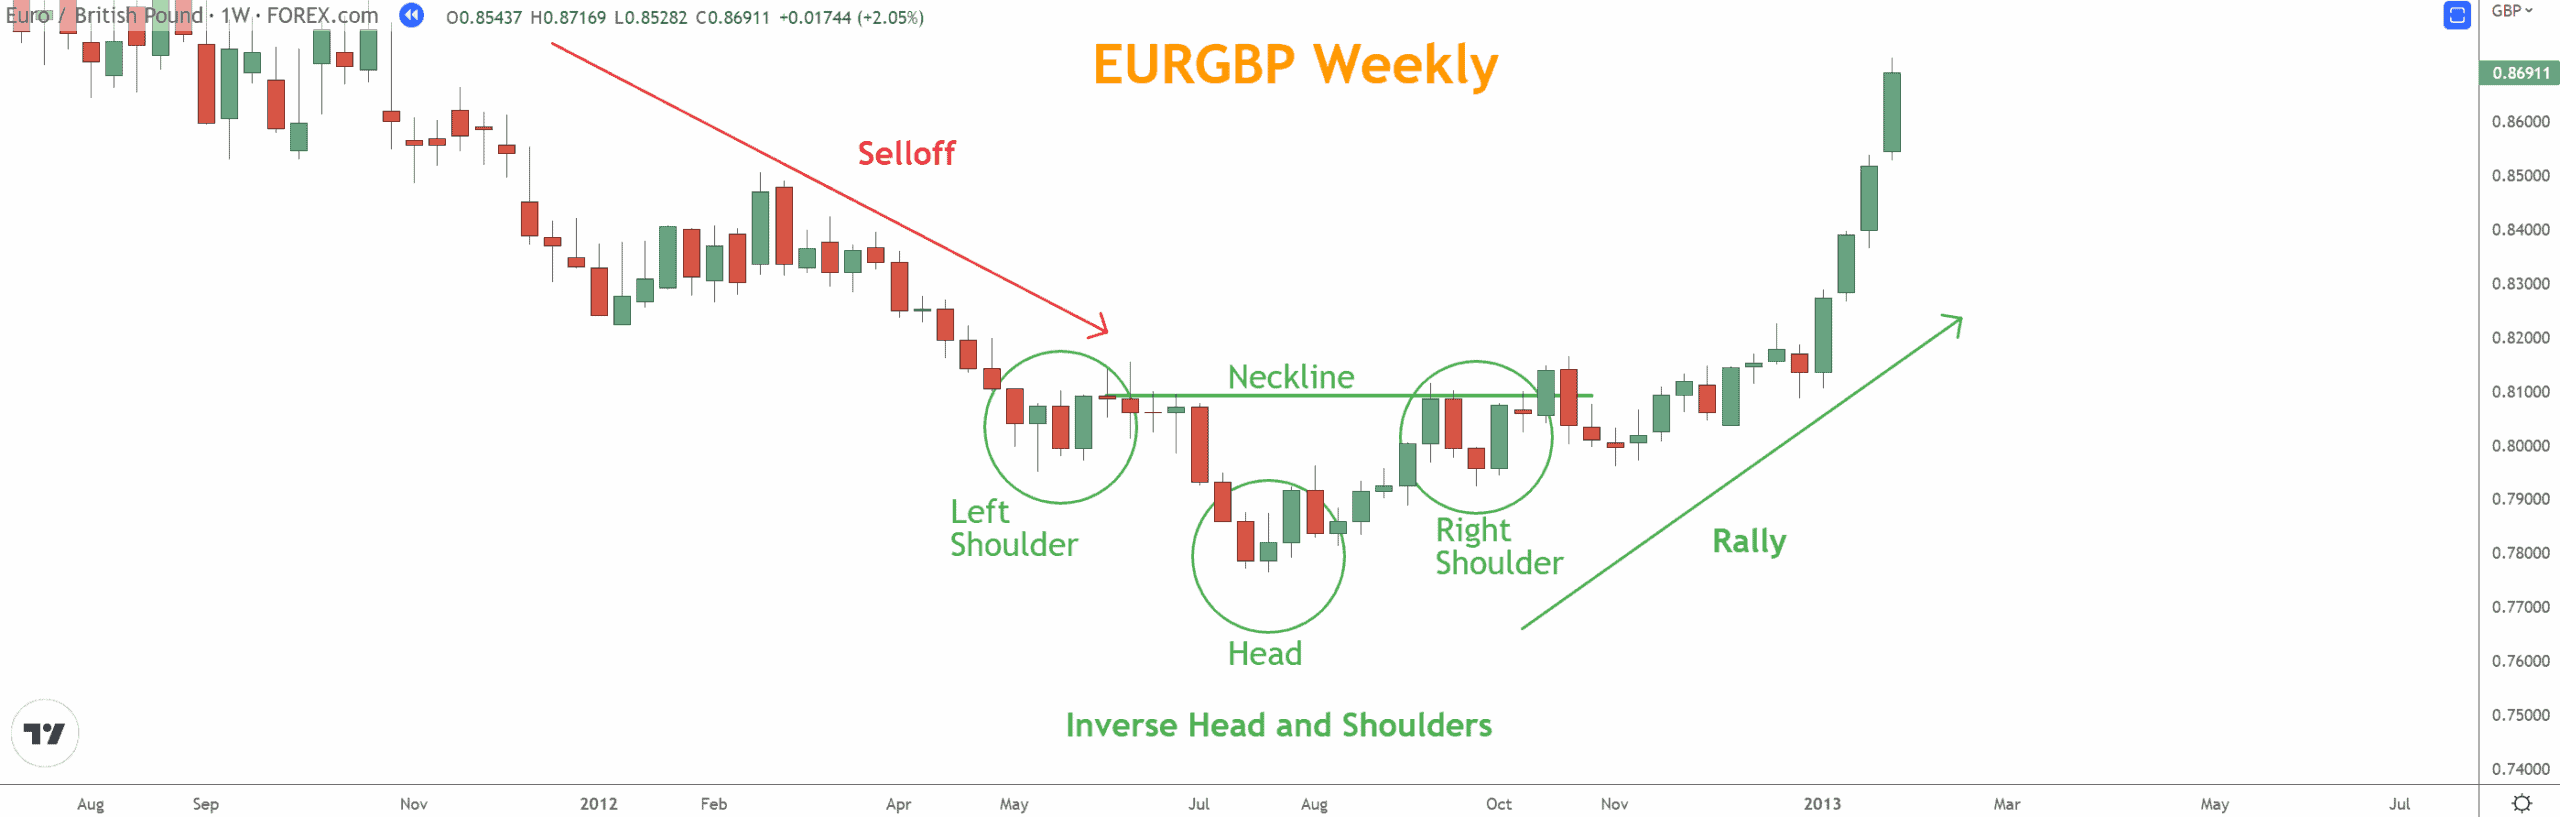
The Inverse Head and Shoulders pattern is the mirror image of the Head and Shoulders pattern and is just as noticeable.
You will find it after a Selloff and signals a potential change in direction to a Rally.
The pattern is created by a trough (left shoulder bottom), followed by a lower trough (head), followed by another trough similar to the first (right shoulder bottom). The shoulders are smaller troughs.
The neckline is created by connecting the highs of the two peaks between the shoulders and head. A breakout above the neckline signals that the price could rise higher.
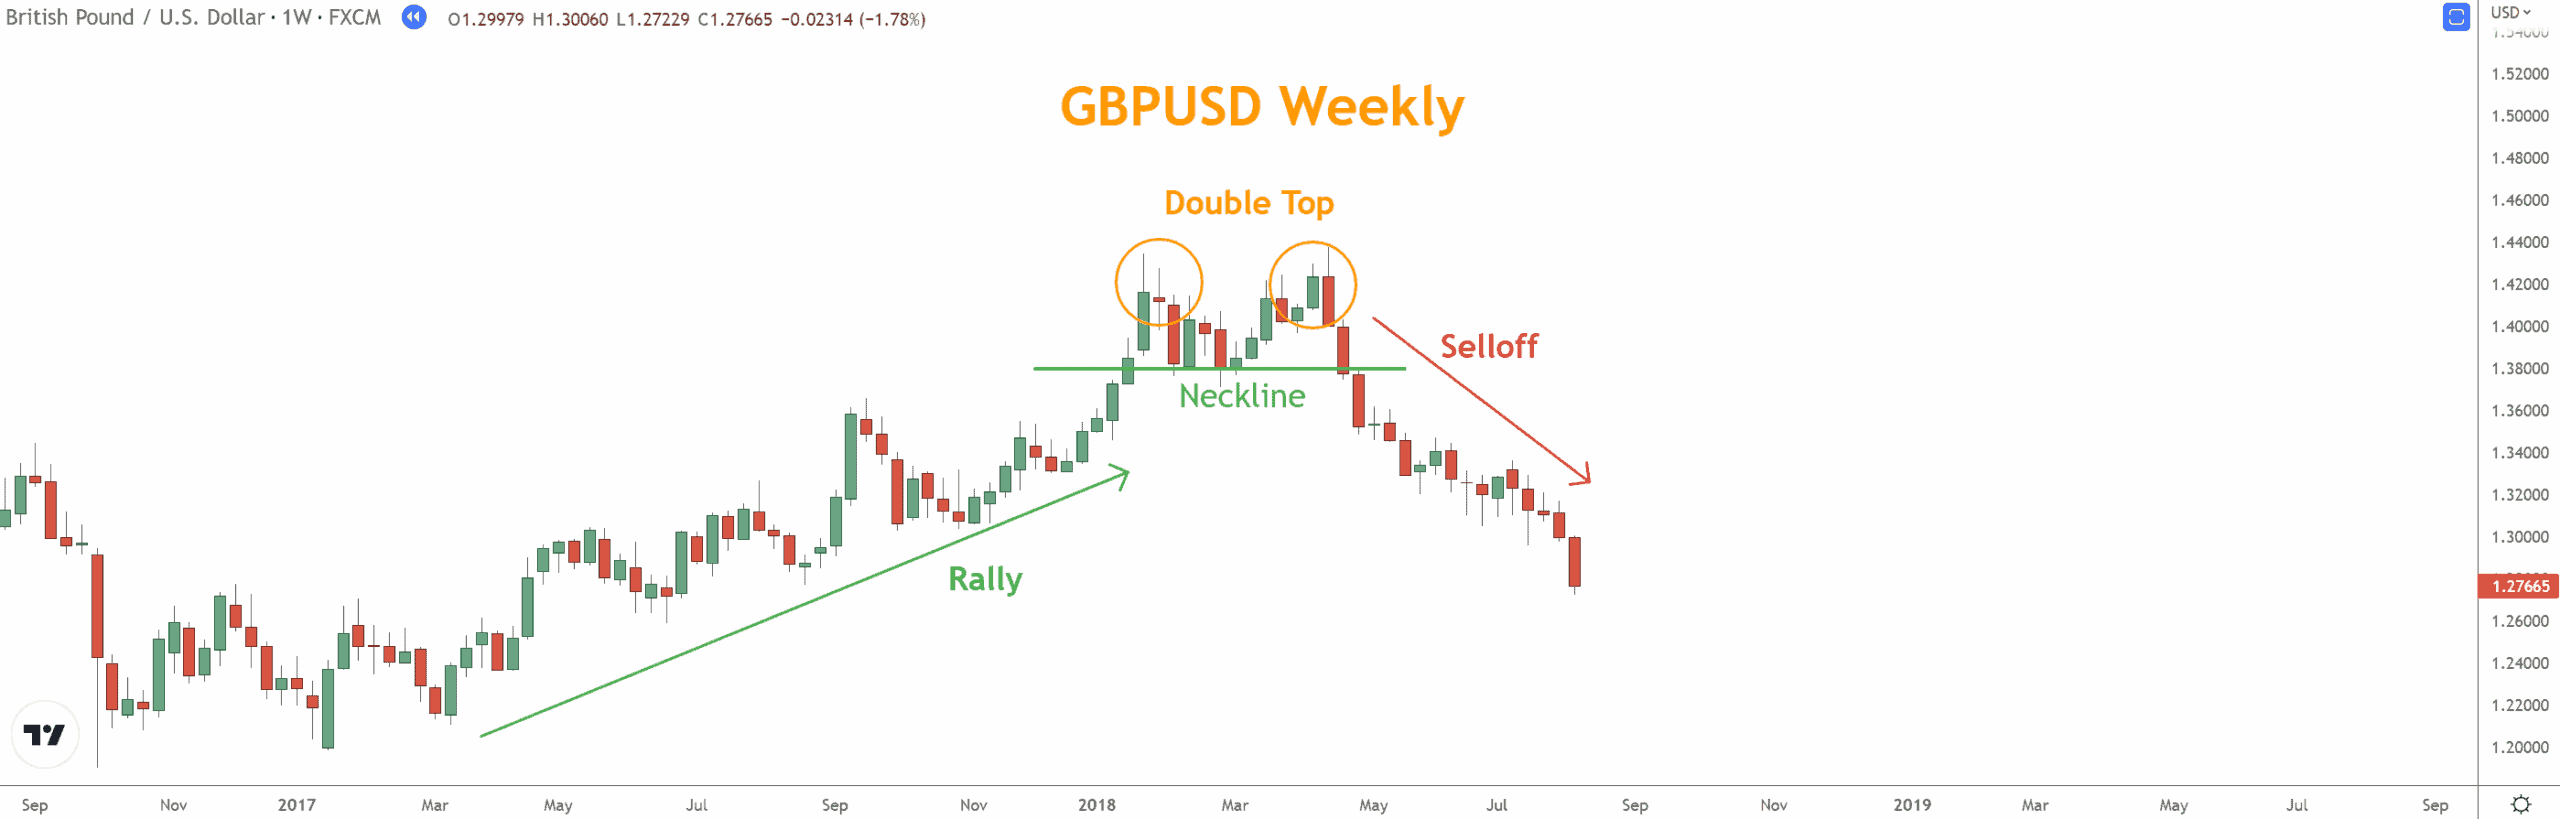
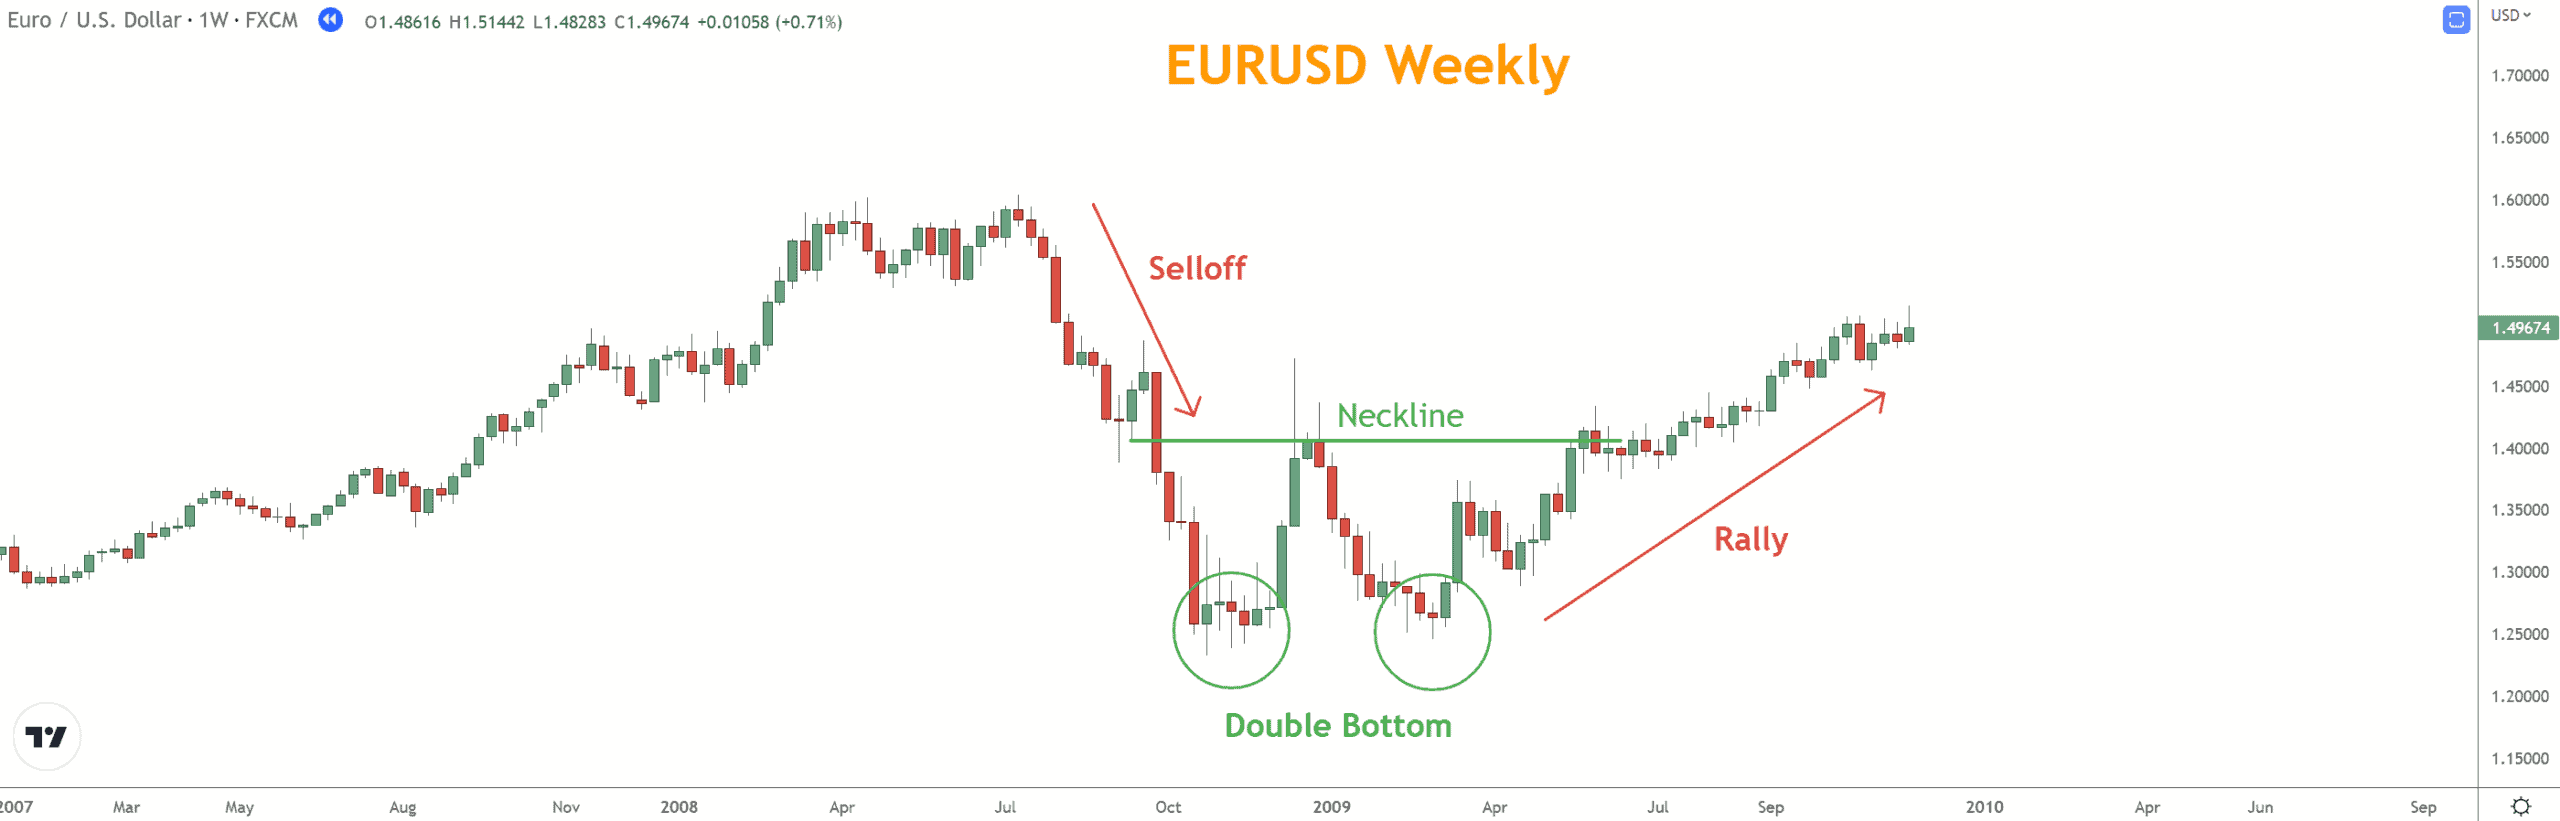
Double Tops and Double Bottoms
A Double Top is a Bearish reversal Chart Pattern with two peaks at the same price level, and a Double Bottom is a Bullish reversal pattern with two troughs at the same price level.
Triple Tops and Triple Bottoms are similar but with three peaks or troughs.
The success rates of Double Tops and Double Bottoms work well with other technical analyses, such as Momentum and Swing Highs and Lows.
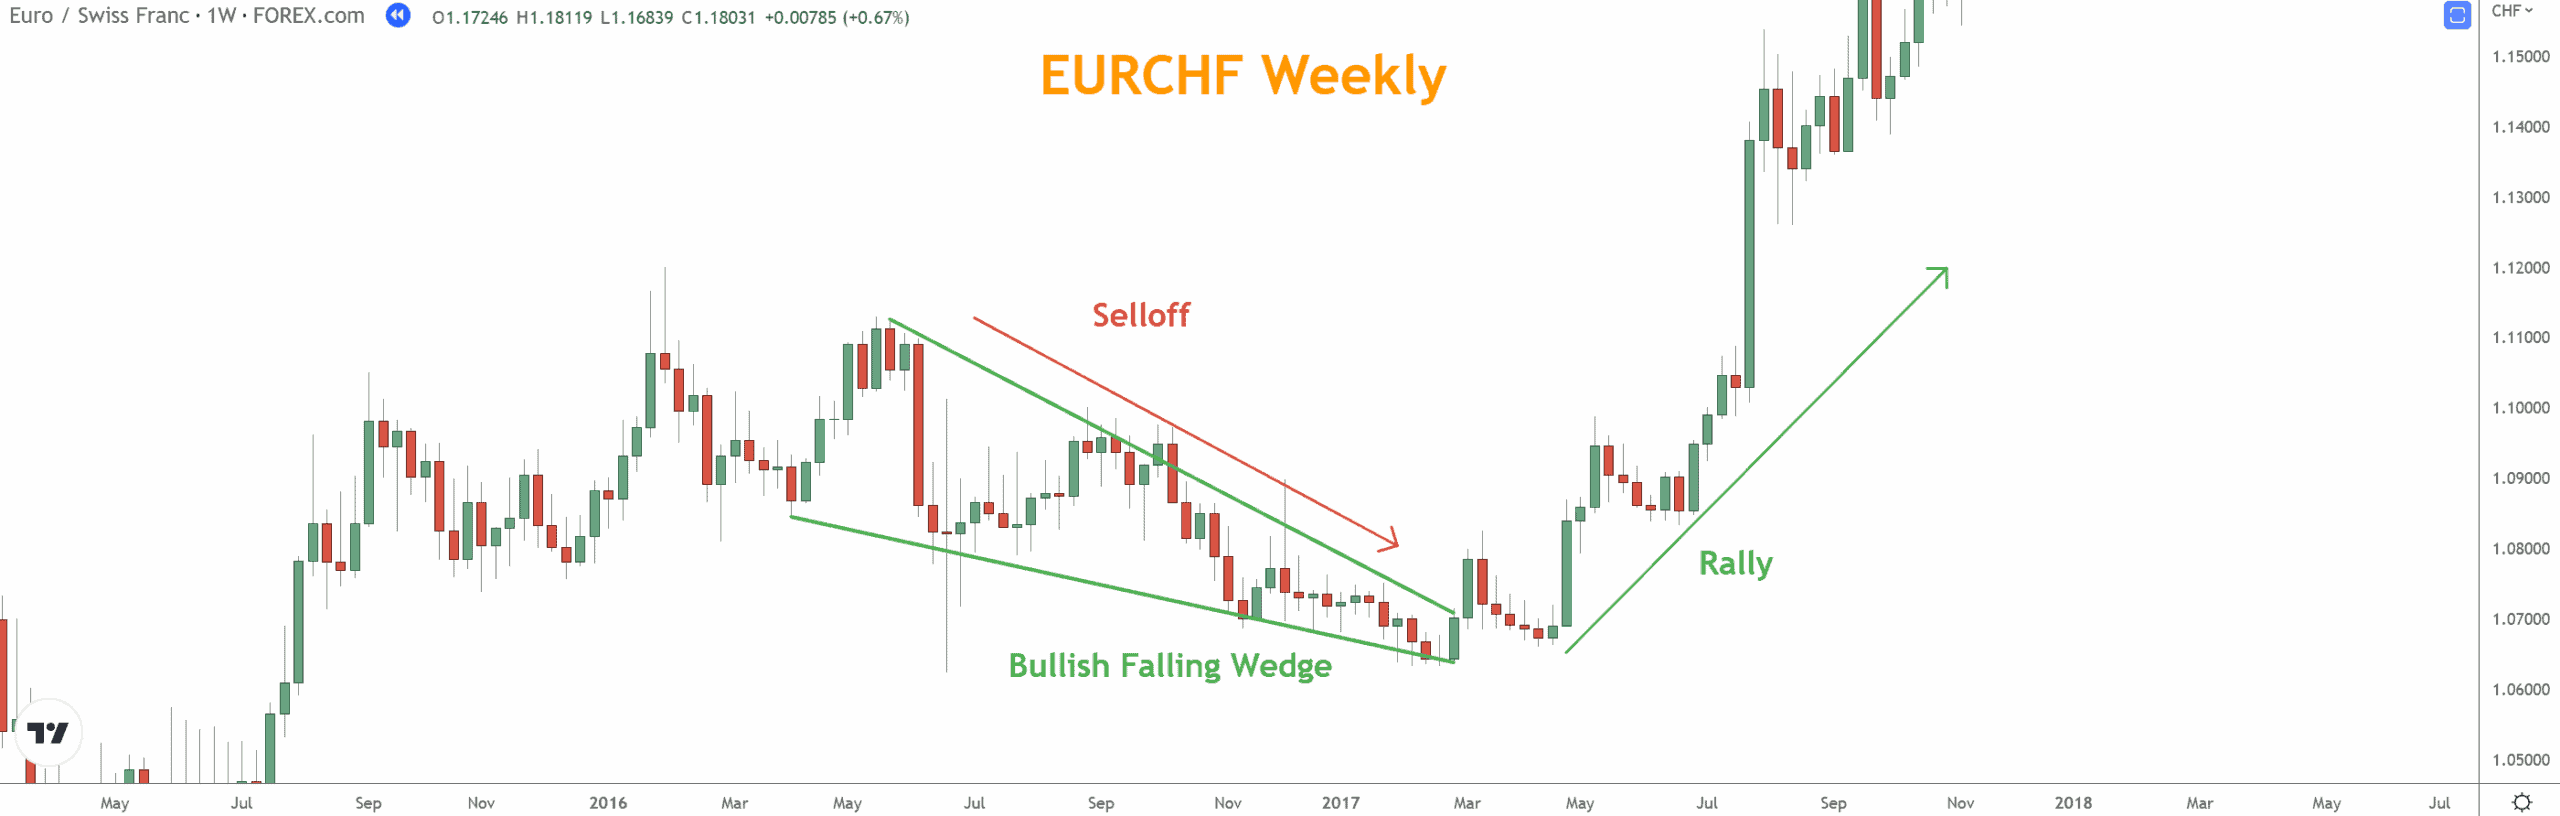
Bullish Wedge and Bearish Wedge
A Bullish Falling Wedge or Bearish Rising Wedge is a wedge pattern indicating the start of an upcoming reversal.
The pattern is characterized by two converging lines and a period of low volatility, which makes it a reliable indicator of a Rally or Selloff.
Bullish Falling Wedges occur at the end of Selloffs, while Bearish Rising Wedges occur at the end of Rallies.
Double Tops/Bottoms are some of the most reliable classical chart patterns when combined with momentum, swings, and candlesticks.
Wedges show weakening pressure and prepare the market for sharp breakouts.
What Are the Limitations of Using Chart Patterns?
Chart Patterns are powerful but imperfect tools. Limitations include:
- Patterns can appear subjective without context
- False breakouts occur frequently
- Patterns fail without confirmation from other indicators
- Market conditions (volatility, liquidity, news) may override technical structure
For best results, combine chart patterns with trend, momentum indicators (RSI, TSI, CCI), Japanese Candlesticks, and support & resistance.
How to Trade Chart Patterns Successfully
To trade chart patterns effectively:
Identify the pattern in the correct market context
- Is the trend up, down, or neutral?
- Is momentum weakening or building?
Wait for confirmation
- Break of neckline
- Break of triangle apex
- Break of wedge boundary
- Candlestick reversal
- Momentum agreement
Determine stop-loss placement
- Beyond the structure (peak/trough/shoulder)
- Above/below support or resistance
Set your profit target
- Measured move
- Major Support/Resistance
- Swing Highs or Lows
Never trade a pattern in isolation
- Use confluence with Trend, Momentum, Candlesticks, and Support/Resistance.
Conclusion
Chart patterns are among the most valuable tools for identifying turning points, breakouts, and continuation opportunities.
When used with proper confirmations: trend, momentum, candlesticks, and support/resistance—they provide structure, clarity, and discipline in your trading decisions.
By mastering these eight essential patterns and applying a confluence-driven approach, you gain an edge that strengthens both your analysis and execution.
What Are Your Next Steps?
- Open a chart and start identifying Chart Patterns in real markets.
- Combine them with Trend, Momentum, Candlesticks, and Support/Resistance.
- Download the Six Basics of Chart Analysis to build a consistent analysis process.
- Join the free weekly Forex Forecast for trade ideas, education, guides, videos, and market commentary.

The more patterns you recognize and confirm, the better you will understand market psychology and price behavior.
5-Question Quiz
Questions
- Which of the following best describes a continuation pattern?
A. A pattern that forms only during reversals
B. A pattern that signals the existing trend will likely resume
C. A signal that a trend is ending
D. A pattern based solely on Fibonacci ratios - A Head and Shoulders pattern typically appears:
A. After a selloff and signals a bullish reversal
B. During sideways markets only
C. After a rally and signals a bearish reversal
D. Only in harmonic pattern structures - Which pattern is characterized by two peaks or troughs at similar levels?
A. Triangle
B. Rectangle
C. Double Top/Double Bottom
D. Flag - A Bullish Falling Wedge usually appears:
A. At the end of a selloff
B. At the top of a rally
C. Only during neutral markets
D. In harmonic patterns only
- What is the most important factor when trading chart patterns?
A. Memorizing all 35+ patterns available
B. Using the pattern alone to decide trades
C. Combining patterns with trend, momentum, candlesticks, and support/resistance
D. Entering before confirmation to get a better price
Answer Key
- B
- C
- C
- A
- C
Forex Trading Disclosure Statement
Risk Warning:
Forex trading involves significant risk and may not be suitable for all investors. You may lose more than your initial investment. Only trade with money you can afford to lose.
Market Risks and Volatility:
Currency prices move based on global events, economic data, and geopolitical changes. Volatility can cause sudden, unexpected losses.
Leverage Risks:
Leverage increases both potential gains and potential losses. Use it cautiously.
Technology Risks:
Trading platforms can experience outages, delays, or pricing errors that affect trades.
No Guaranteed Results:
Past performance does not guarantee future outcomes. No strategy eliminates all risk.
Educational Purpose Only:
The information provided is for education, not financial advice. Consult a licensed professional before trading.
Responsibility:
You are responsible for your own trading decisions and risk management.