
The Commodity Channel Index (CCI) indicator is a momentum-based oscillator designed to uncover shifts in market momentum and potential reversals.
Unlike other tools such as the RSI or Stochastic Oscillator, the CCI focuses on deviations from the average price.
This approach allows traders to identify overbought and oversold conditions more effectively across different market environments.
Summary
The CCI indicator measures how far the current price deviates from its average price over a given period, typically 20.
Values above +100 suggest overbought conditions, while values below -100 indicate oversold conditions. When combined with other tools—such as LSMA, Japanese Candlesticks, chart patterns, or support and resistance—the CCI provides a powerful confirmation mechanism for entries and exits.
Quick Reference: CCI Trading Insights
| Aspect | Key Point | Trading Use |
| Formula | Price deviation from average | Identifies momentum shifts |
| Overbought | CCI > +100 | Possible trend pause or reversal |
| Oversold | CCI < -100 | Potential bullish reversal |
| Divergence | Price vs. CCI mismatch | Early warning of reversals |
| Best Use | Combined with LSMA, candlesticks, chart patterns, S/R | Stronger confirmations |
TL;DR – CCI Indicator in a Nutshell
The Commodity Channel Index is a momentum oscillator that tracks price deviations from an average.
It identifies overbought/oversold conditions, signals reversals through divergence, and works best when combined with confirming tools such as LSMA, candlesticks, chart patterns, and support/resistance levels.
Table of Contents
- Summary
- TL;DR – CCI Indicator in a Nutshell
- What Is the CCI Indicator?
- How to Interpret CCI Values
- How to Choose Periods
- Combining CCI with the LSMA Trend Indicator
- Can You Integrate Japanese Candlesticks with the CCI Indicator?
- Using Japanese Candlesticks with CCI Indicator
- Can Chart Patterns leverage the CCI Indicator?
- Chart Patterns and CCI
- Where can Support and Resistance coordinate with the CCI Indicator?
- Support and Resistance with CCI
- Conclusion
- Quiz: Understanding the CCI Indicator
- What’s the Next Step?
- Forex Trading Disclosure Statement
What Is the CCI Indicator?
The CCI was developed by Donald Lambert in 1980 as a momentum-based oscillator to highlight deviations from typical price behavior. By comparing current price levels against an average, the indicator generates values oscillating around zero.
- Positive values suggest price is above average (potentially overbought).
- Negative values suggest price is below average (potentially oversold).
With its sensitivity to deviations, the CCI allows traders to assess short-term shifts in momentum and align trades with emerging market conditions.
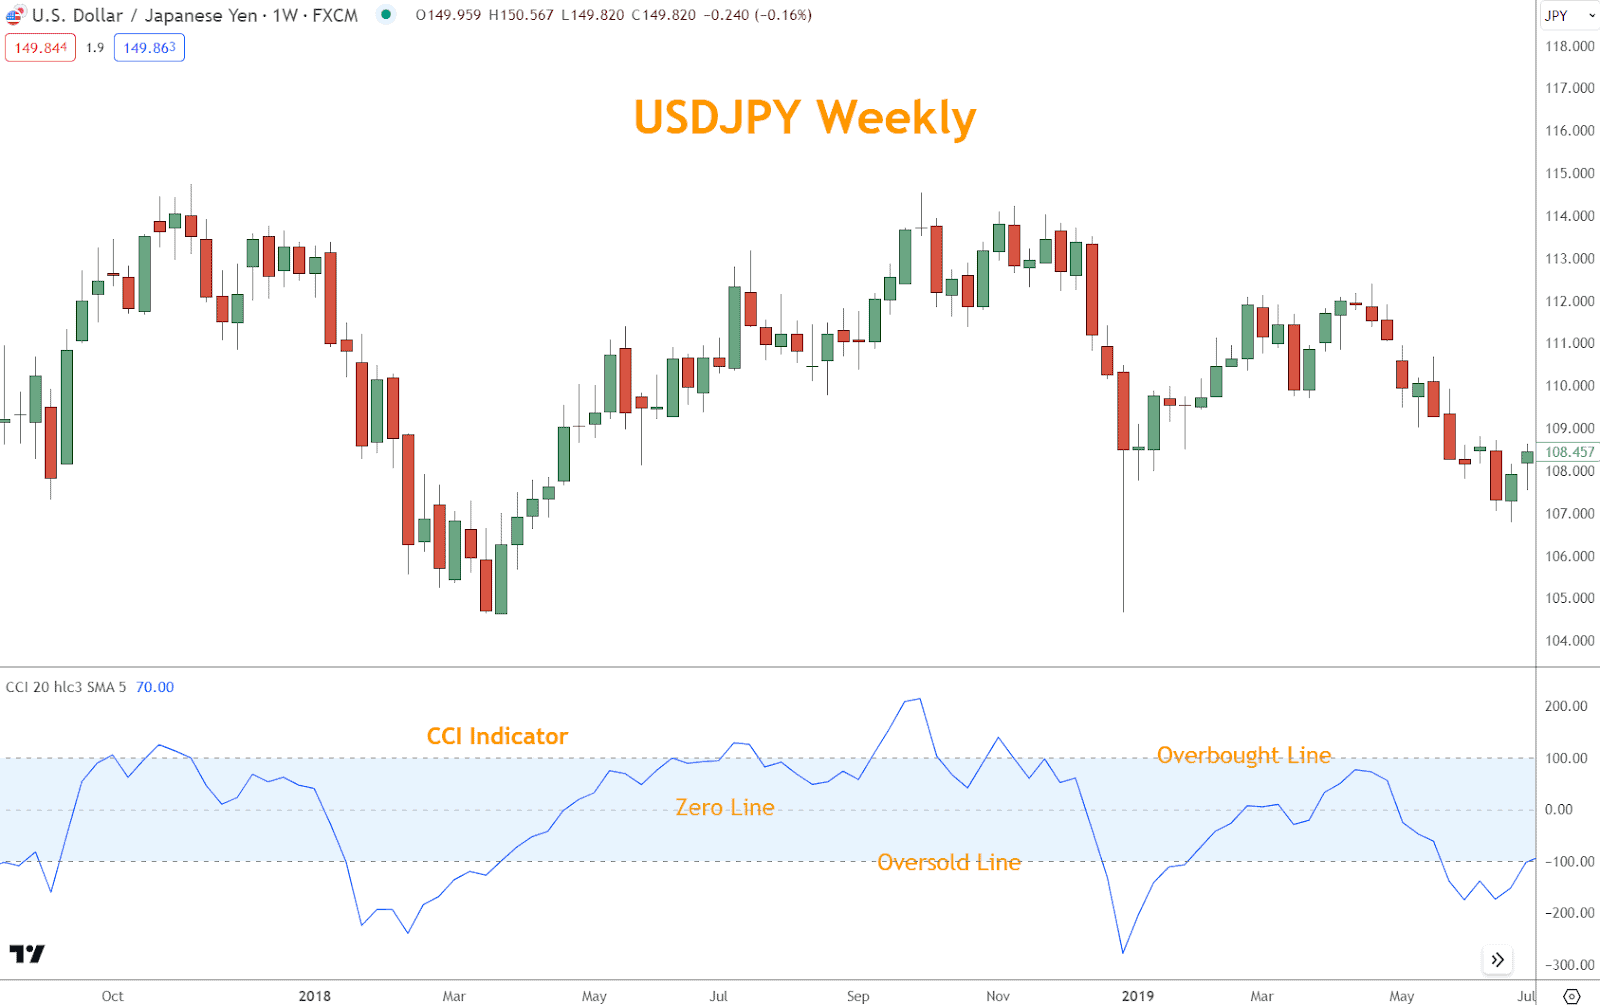
How to Interpret CCI Values
Understanding CCI values is critical for making trading decisions.
- A CCI above +100 indicates an overextended rally and possible trend pause or reversal.
- A CCI below -100 points to oversold conditions and potential for a rebound.
Equally important are divergence signals:
- Bullish divergence occurs when price makes lower lows but CCI makes higher lows, hinting at waning bearish momentum.
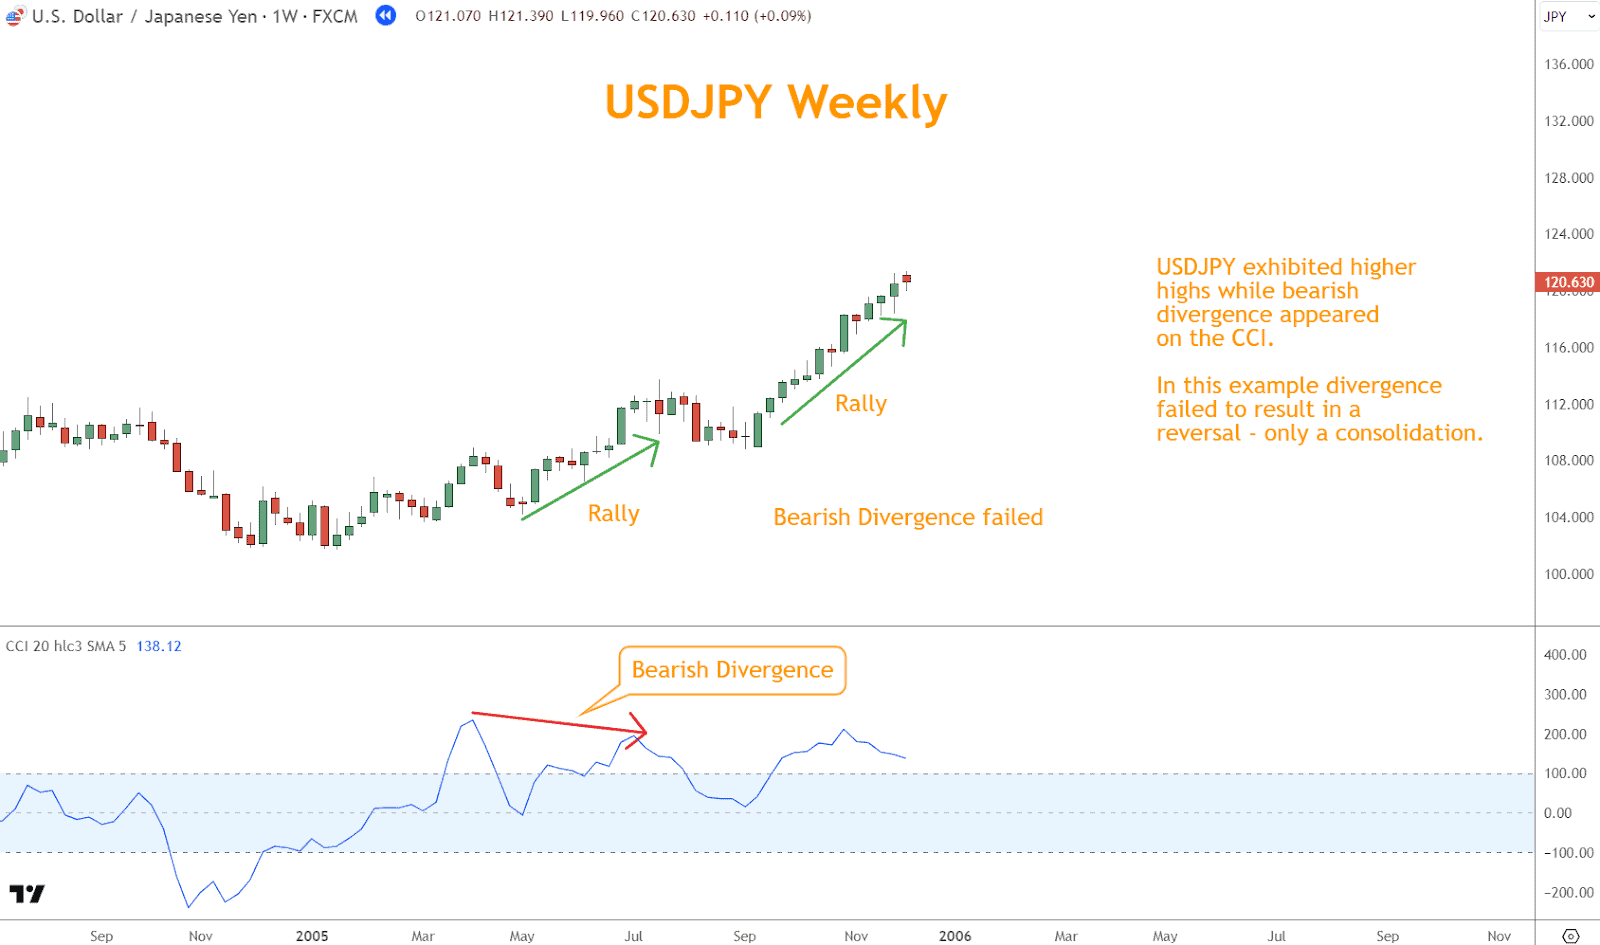
- Bearish divergence happens when price makes higher highs while the CCI makes lower highs, signaling weakening bullish strength.
Be cautious, as divergence alone can produce false signals and requires confirmation from other tools.
How to Choose Periods
The lookback period dramatically affects its sensitivity.
- Shorter periods produce more signals, but also more false positives.
- Longer periods smooth price fluctuations, making signals clearer but often slower.
Experimenting with different periods allows you to balance responsiveness with reliability, depending on your strategy and the volatility of the pair you trade.
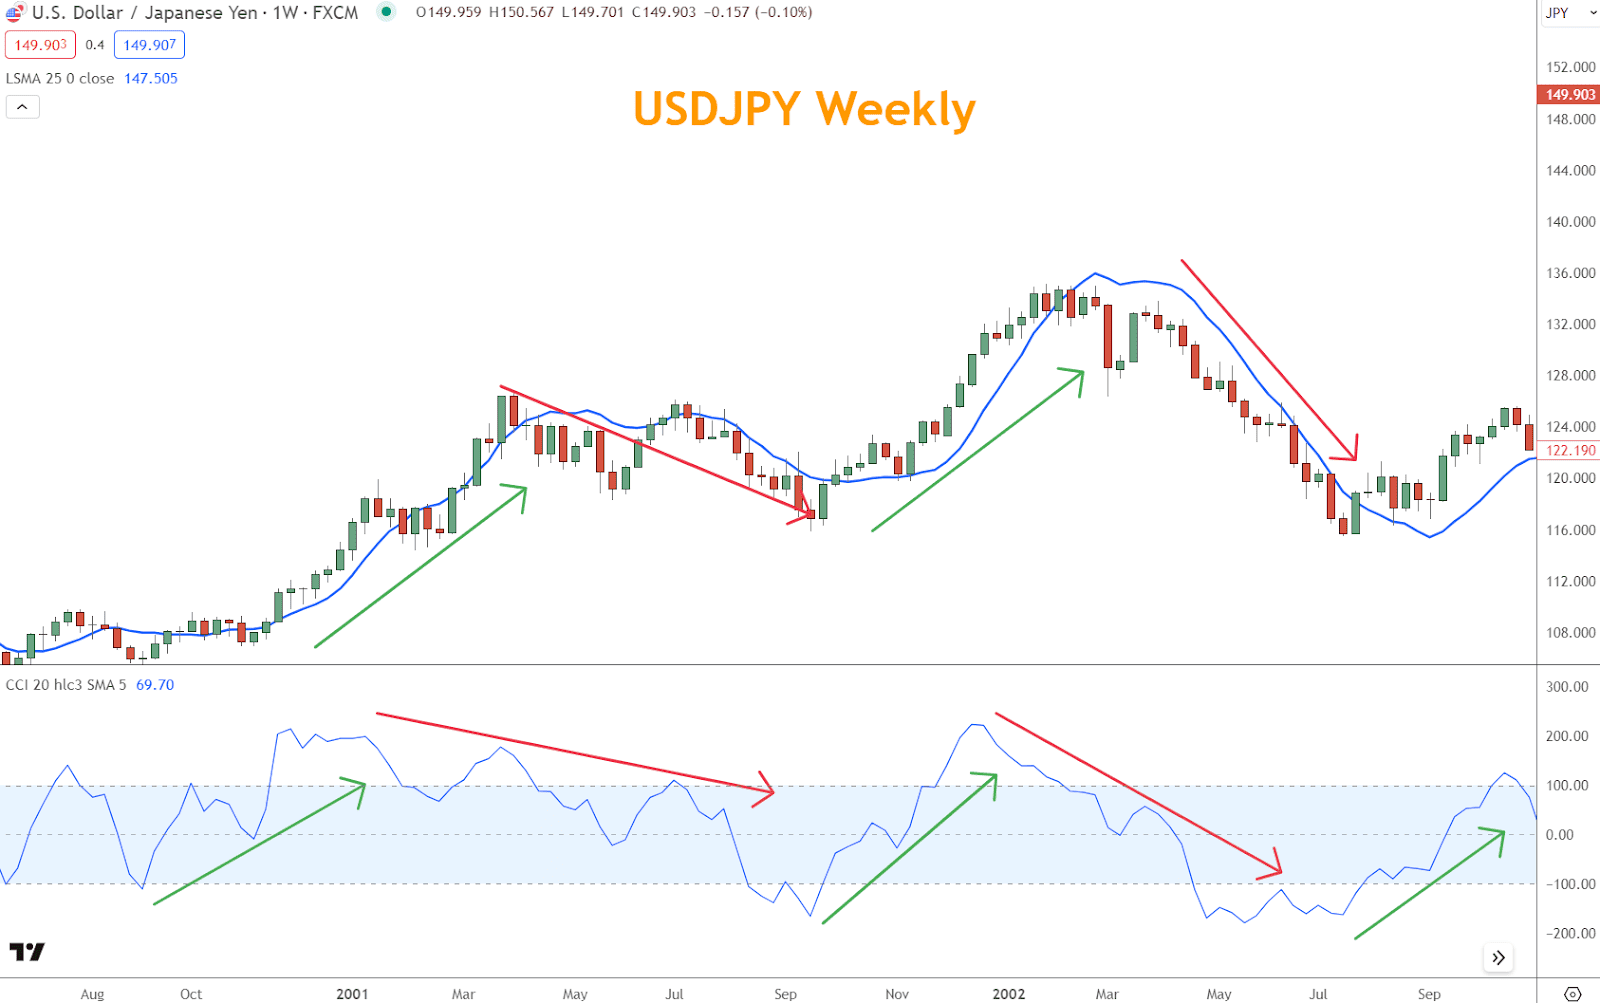
Combining CCI with the LSMA Trend Indicator
Momentum signals gain strength when combined with a reliable trend tool. The Least Squares Moving Average (LSMA) smooths short-term noise by assigning greater weight to recent data.
- Upward LSMA slope = bullish trend.
- Downward LSMA slope = bearish trend.
Integration Strategy
- Confirm LSMA trend with CCI values: bullish trend above zero or bearish trend below zero.
- Watch for reversals when it crosses critical thresholds (+100 or -100) while LSMA changes slope.
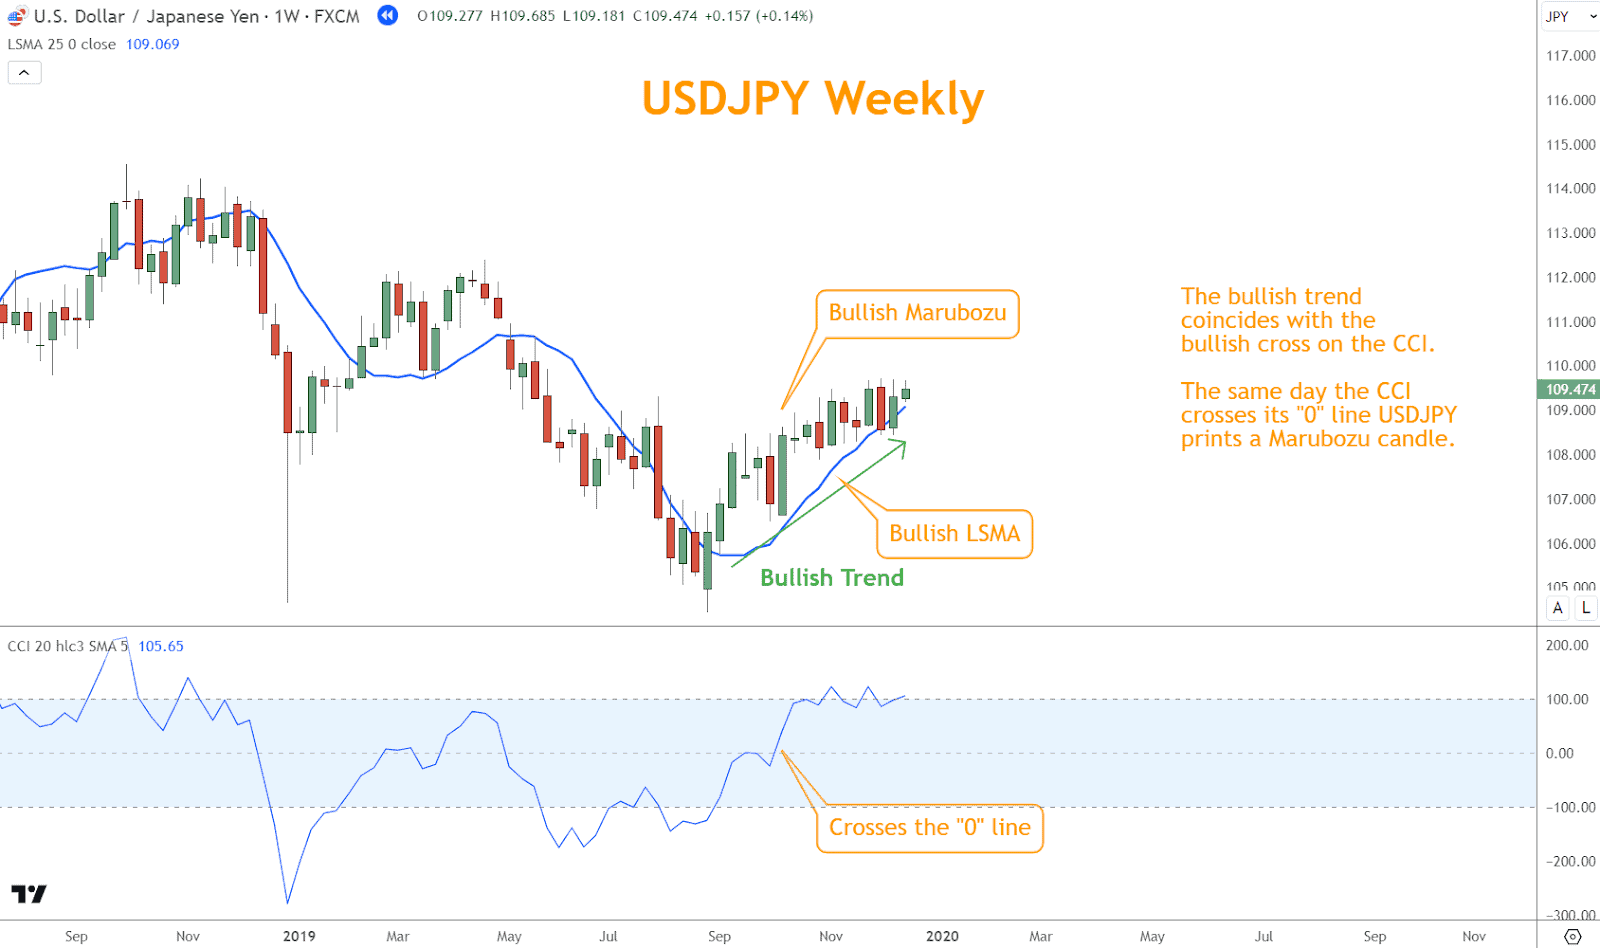
This dual approach strengthens your analysis by aligning both momentum and trend direction.
Can You Integrate Japanese Candlesticks with the CCI Indicator?
Japanese candlestick patterns offer insights into market sentiment and price action.
Combined with the Commodity Channel Index (CCI), these candlestick patterns can provide a comprehensive view of potential market movements, enhancing decision-making and trading strategies.
Understanding Japanese Candlesticks
Japanese candlestick charts display price movements over a specific period using candlestick shapes and colors.
Each candlestick represents the period’s opening, closing, high, and low prices.
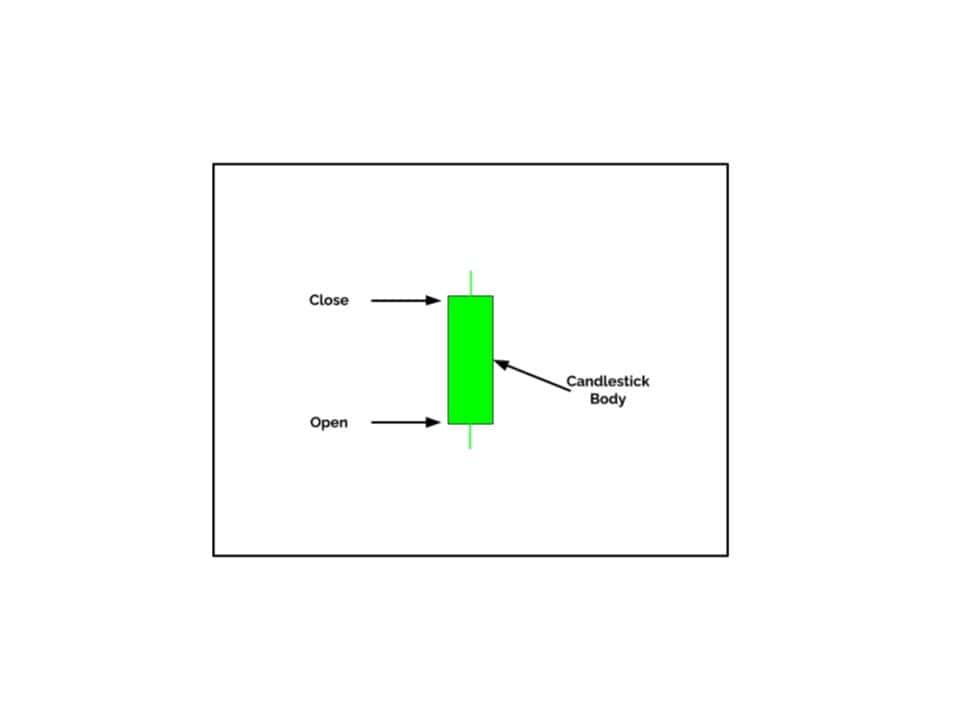
Bullish candlesticks, typically depicted in green or white, indicate that the closing price is higher than the opening price, suggesting bullish momentum.
Conversely, bearish candlesticks, often shown in red or black, signify that the closing price is lower than the opening price, signaling bearish sentiment.
Combining with Candlestick Patterns
When integrating with Japanese candlestick analysis, traders can more confidently validate potential entry and exit points.
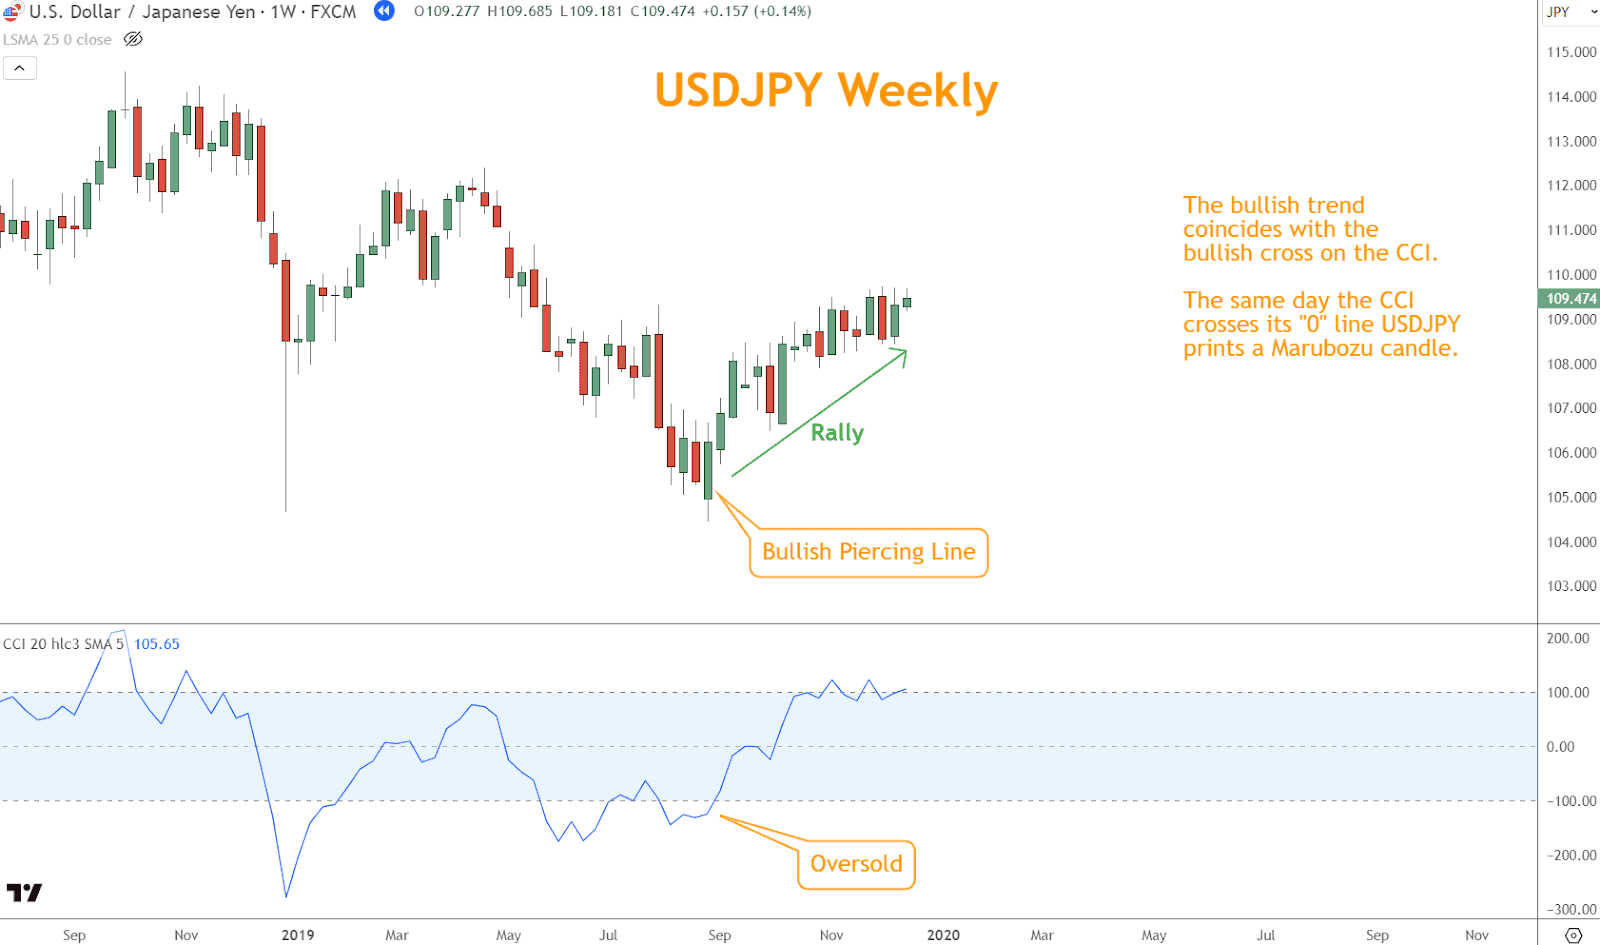
For example, if a bullish Piercing Line forms—a bullish reversal signal—accompanied by a 0 line cross on the CCI, it strengthens the case for a potential upward reversal.
Using Japanese Candlesticks with CCI Indicator
Candlestick patterns visually capture market sentiment. When combined with CCI signals, they add depth and confirmation to trade setups.
- Bullish example: A Piercing Line candlestick forms while the CCI crosses above zero → stronger bullish case.
- Bearish example: A Bearish Engulfing pattern coinciding with CCI over +100 → potential downside reversal.
By blending CCI momentum analysis with candlestick reversals, you can validate entries and reduce false signals.
Looking for a Strategy?
Download the Six Basics of Chart Analysis and sign up for Forex Forecast to learn a bottom-up approach to analyzing Forex markets and weekly market updates.
Can Chart Patterns leverage the CCI Indicator?
In Forex trading, chart patterns are pivotal in identifying potential market reversals, continuations, and breakout opportunities.
When integrated with the Commodity Channel Index (CCI), these patterns can provide additional confirmation signals and insights into market dynamics, bolstering trading strategies and decision-making processes.
Understanding Chart Patterns
Chart patterns are visual representations of price movements over a specific period, offering traders valuable insights into market sentiment and potential future price movements.
Common chart patterns include head and shoulders, triangles, flags, pennants, double tops, and double bottoms.
Each pattern carries unique characteristics and implications for market direction. These are examples of triangle patterns.
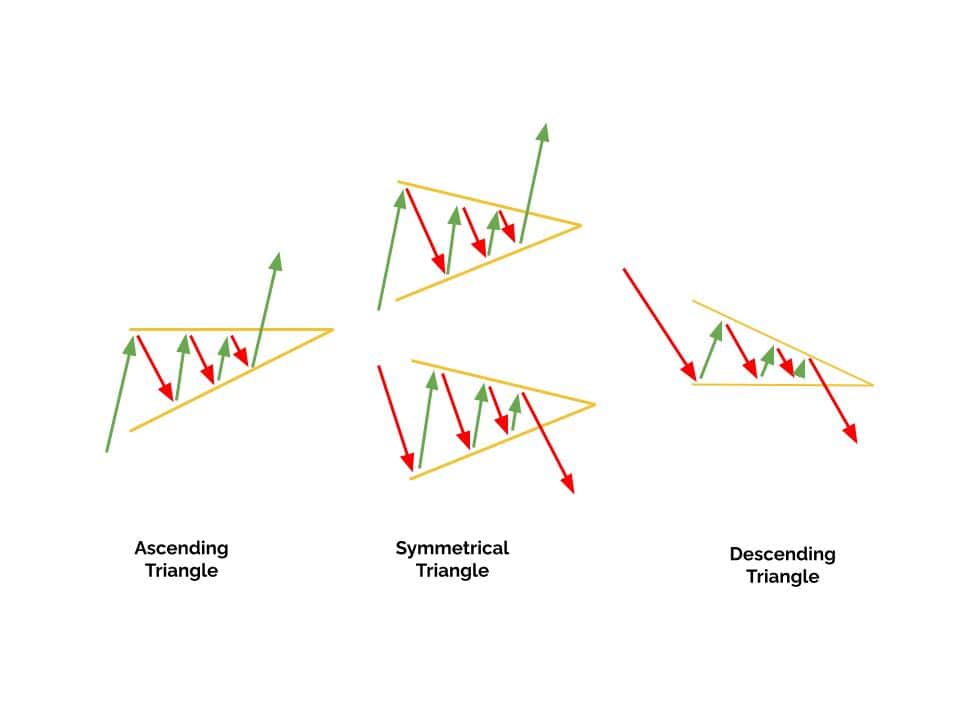
Chart Patterns and CCI
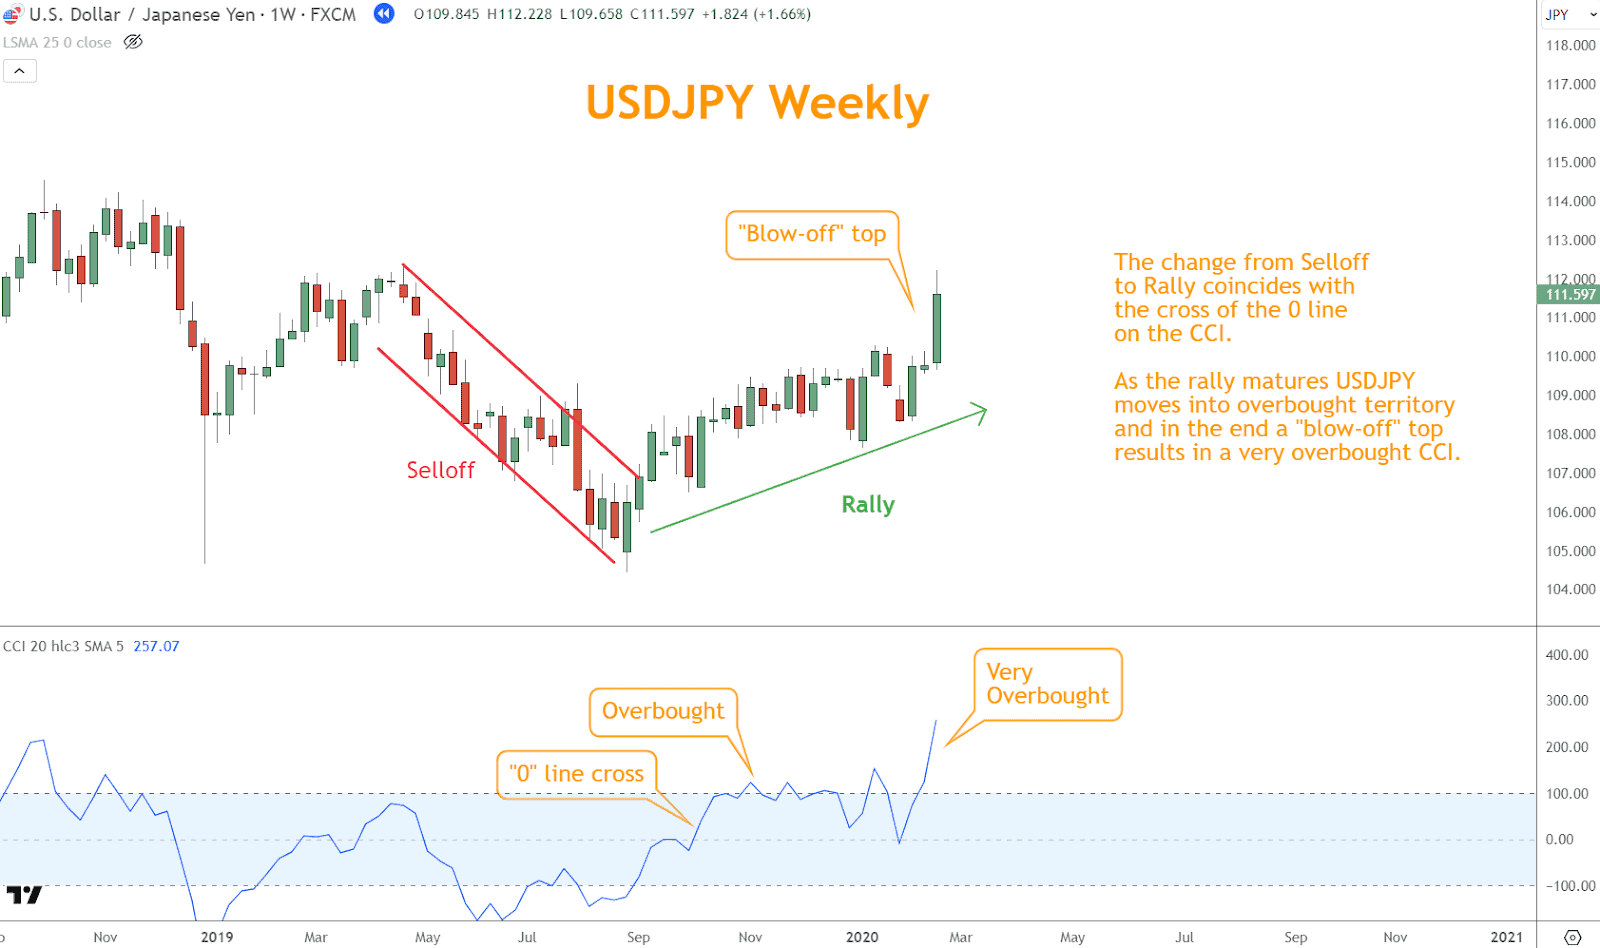
Chart patterns like head and shoulders, triangles, and wedges provide structural insights into potential market direction. CCI can act as a confirming filter.
This integration provides context and momentum validation for chart-based trading strategies.
The example below illustrates a bearish price channel with a diverging CCI. Eventually, the price reverses higher, culminating in a “blow-off” top.
Where can Support and Resistance coordinate with the CCI Indicator?
Support and resistance levels are critical concepts in Forex trading. They represent areas where the price tends to stall or reverse due to underlying supply and demand dynamics.
Combined with the Commodity Channel Index, you can gain valuable insights into potential entry and exit points, enhancing your ability to navigate market movements effectively.
Understanding Support and Resistance
Support levels are price levels where buying interest is sufficiently strong to prevent further price declines.
They are often represented by historical lows or areas where buyers accumulate.
Conversely, resistance levels are price levels where selling pressure outweighs buying interest, hindering further upward movement.
They are typically depicted by historical highs or areas where sellers emerge.
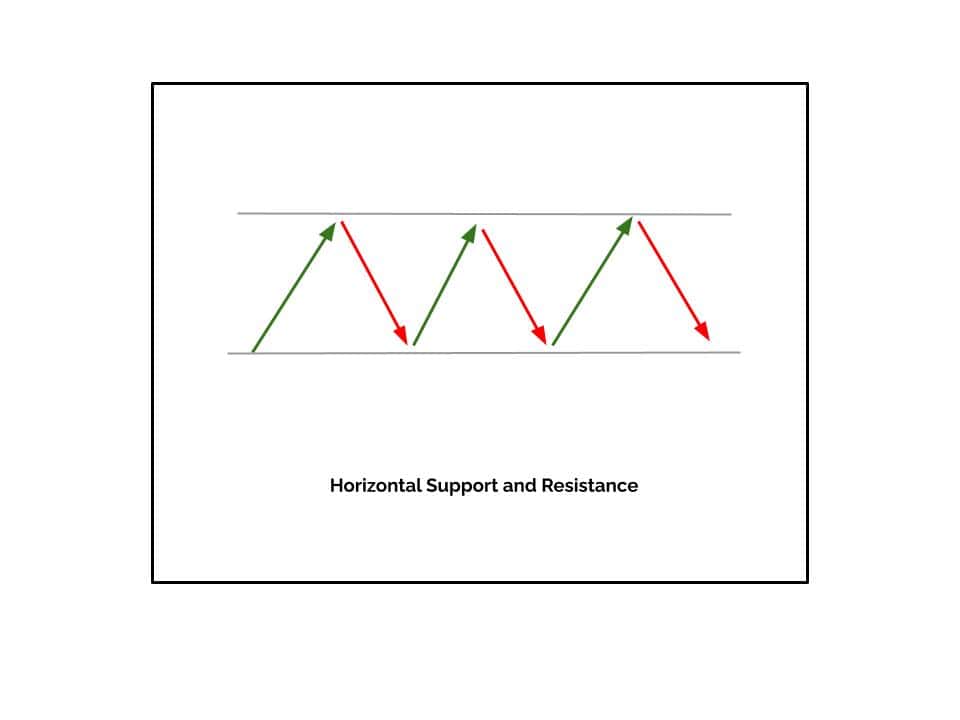
Identifying Support and Resistance Levels
Traders employ various methods to identify support and resistance levels, including horizontal lines drawn across significant price levels, trendlines connecting successive highs or lows, and pivot points derived from previous price action.
Once identified, these levels are reference points for assessing potential trade opportunities and managing risk.
Support and Resistance with CCI
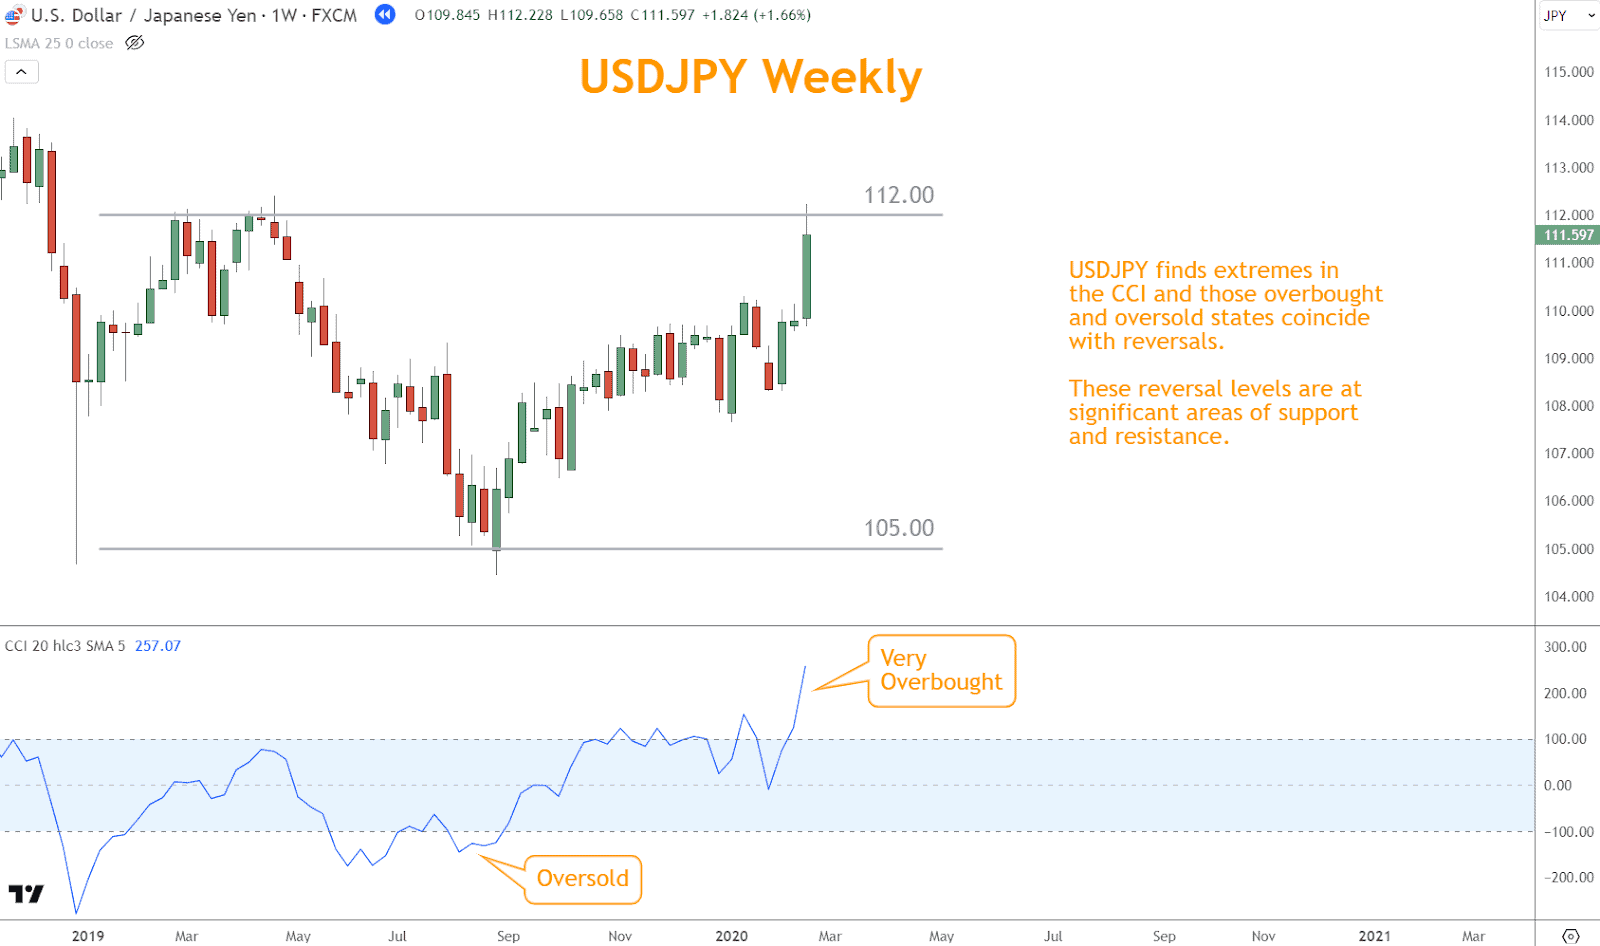
Support and resistance represent key market levels shaped by supply and demand. Adding CCI analysis to these levels helps determine whether the price is likely to hold or break.
- Oversold near support + CCI crossing above -100 → bullish bounce potential.
- Overbought near resistance + CCI crossing below +100 → bearish rejection setup.
This layered approach allows you to combine structural market levels with momentum signals, leading to higher-quality trade entries.
Conclusion
The CCI indicator provides unique momentum insights by tracking price deviations from average levels. On its own, it highlights overbought/oversold conditions and divergence. However, its real strength emerges when combined with LSMA, candlesticks, chart patterns, and support/resistance.
Like any indicator, CCI has limitations. The most effective use comes from applying it with multiple tools, proper risk management, and disciplined trade execution.
Quiz: Understanding the CCI Indicator
- What makes the CCI different from RSI and Stochastic?
a. It measures trend slope
b. It tracks deviations from the average price
c. It compares relative highs and lows
d. It uses volume instead of price - What does a CCI reading above +100 suggest?
a. Oversold conditions
b. Neutral conditions
c. Overbought conditions
d. Trendless market - What does bullish divergence on the CCI indicate?
a. Stronger bearish continuation
b. Weaker bearish momentum and possible reversal
c. Neutral momentum shift
d. Trend exhaustion without reversal - Why should traders combine CCI with other tools?
a. It reduces platform fees
b. It eliminates false signals
c. It provides stronger confirmation of setups
d. It replaces the need for risk management - How can CCI confirm support/resistance levels?
a. By matching candle colors
b. By crossing above/below +100/-100 near those levels
c. By flattening its slope
d. By measuring volume surges
Answer Key:
- b
- c
- b
- c
- b
What’s the Next Step?
Apply the CCI to your charts and experiment with periods, confirming setups with LSMA, candlesticks, chart patterns, and support/resistance.
Want a structured approach? Download the Six Basics of Chart Analysis for free. You’ll also receive the Forex Forecast every Sunday, including:
- Trade ideas based on the Six Basics
- Case studies showing successful applications
- Educational guides and strategy videos
- Updates from PositionForex.com and upcoming webinars
This combination will strengthen your technical foundation and help you use the CCI more effectively in real-world trading.

Forex Trading Disclosure Statement
Risk Warning
Forex trading involves significant risk and may not be suitable for all investors. The leveraged nature of Forex trading can work both for and against you, leading to substantial gains or losses. Before trading Forex, you should carefully consider your financial objectives, experience level, and risk tolerance. It is possible to lose more than your initial investment, and you should only trade with money you can afford to lose.
Market Risks and Volatility
Forex markets are influenced by global economic, political, and social events, which can result in unpredictable price movements. High market volatility can lead to sudden and substantial changes in currency values, potentially causing losses that exceed your initial deposit.
Leverage Risks
Leverage amplifies both potential gains and potential losses. While leverage can increase profitability, it also increases the risk of significant losses, including the loss of your entire trading capital.
Trading Tools and Technology Risks
Forex trading platforms, including those offered by brokers, are subject to technology risks, such as system failures, latency issues, and potential errors in price feeds. Traders should be aware that these risks can impact the execution of trades and trading outcomes.
No Guarantee of Profitability
Past performance in Forex trading is not indicative of future results. There is no guarantee that you will achieve profits or avoid losses when trading Forex. Market conditions and individual trading strategies vary, and no trading system can eliminate the inherent risks of Forex trading.
Educational Purposes Only
Any information provided about Forex trading, including strategies, analysis, or market commentary, is for educational purposes only and should not be considered financial advice. Consult a qualified financial advisor or tax professional before making any trading decisions.
Regulatory Compliance
Forex trading is regulated differently in various jurisdictions. Ensure that you are trading with a licensed and compliant broker in your country of residence.
Responsibility
You are solely responsible for your trading decisions and the associated risks. It is your duty to understand the terms and conditions of Forex trading, including margin requirements, stop-losses, and other risk management tools.
Acknowledgment
By engaging in Forex trading, you acknowledge that you have read, understood, and accepted this disclosure statement. You accept full responsibility for the outcomes of your trading decisions and agree to trade at your own risk.
This disclosure is intended to provide an overview of the risks associated with Forex trading and is not exhaustive. For additional information, consult your broker and other reliable financial resources.