
Candlestick patterns reveal market reversals by exposing price behavior and trader psychology directly on the chart.
When price reaches Overbought or Oversold conditions during Rallies or Selloffs, candlestick patterns often signal a potential change in direction.
This article explains how candlestick patterns work, why they matter, and how to use three core reversal types effectively—without treating them as standalone trading signals.
TL;DR
- Candlestick patterns reflect market psychology, not predictions
- They identify potential reversals, not guaranteed outcomes
- Candlesticks work best as entry-timing tools, not strategies
- One-, two-, and three-candle patterns form the core families
- Reliability increases dramatically when combined with trend, momentum, and support/resistance
- Higher timeframes produce stronger and more reliable signals
Table of Contents
- TL;DR
- What Is a Candlestick?
- A Brief History of Candlesticks (and Why It Matters)
- Why Candlestick Charts Are So Effective
- Each Candlestick Component Communicates Information
- Important Single-Candlestick Names
- Do Candlestick Patterns Really Work?
- Forex vs. Stocks: A Key Difference
- Be Careful with Extremely Long Shadows
- The Three Candlestick Pattern Families
- Commonly Found Candlestick Patterns
- What’s the Next Step?
- Knowledge Check: Candlestick Patterns Quiz
- Forex Trading Disclosure Statement
What Is a Candlestick?
A candlestick represents price movement over a specific period and consists of two main components:
- Body – the open and close
- Shadows (or wicks) – the high and low
Together, these components show the range, direction, and conviction behind price movement during that period.
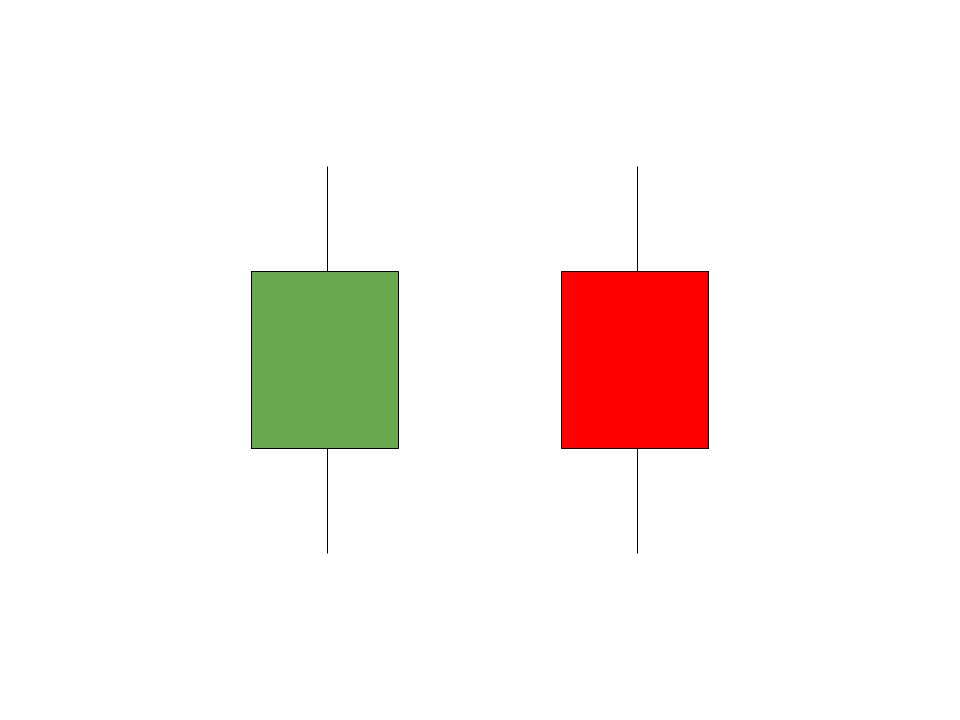
A green (or white) candlestick closes higher than it opens and reflects bullish pressure.
A red (or black) candlestick closes lower than it opens, indicating bearish pressure.
A Brief History of Candlesticks (and Why It Matters)
Candlestick charting originated in 18th-century Japan, where rice traders tracked price fluctuations using visual patterns.
Munehisa Homma formalized these methods and later introduced them to Western markets by Steve Nison.
Candlestick charts endure because they provide a direct view into trader behavior—a feature that remains relevant across markets, platforms, and timeframes.
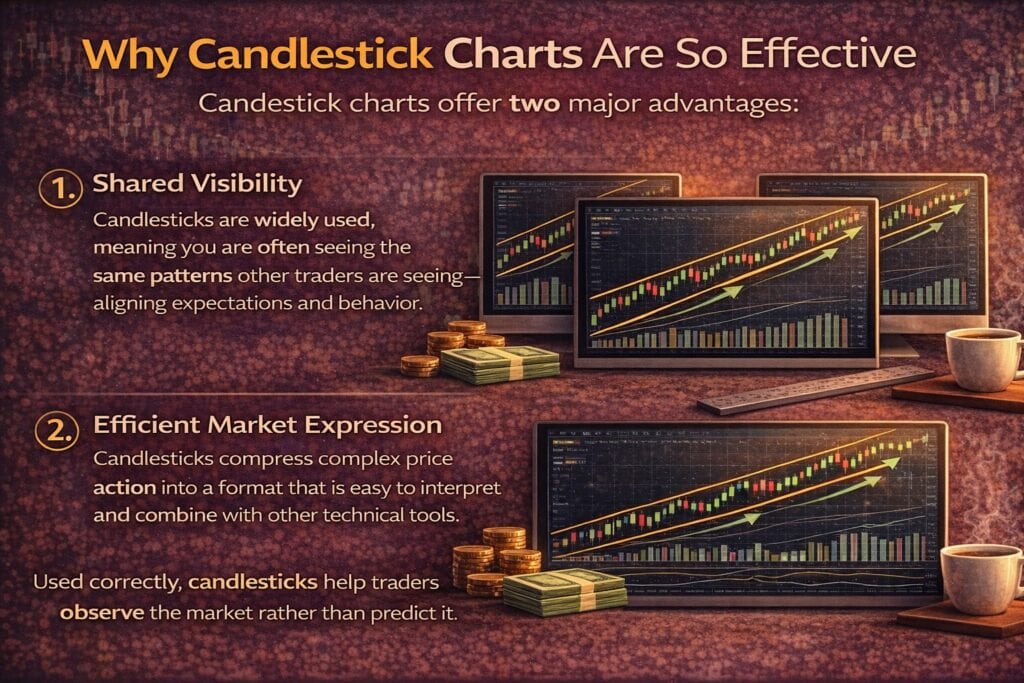
Why Candlestick Charts Are So Effective
Candlestick charts offer two major advantages:
1. Shared Visibility
Candlesticks are widely used, meaning you are often seeing the same patterns other traders are seeing—aligning expectations and behavior.
2. Efficient Market Expression
Candlesticks compress complex price action into a format that is easy to interpret and combine with other technical tools.
Used correctly, candlesticks help traders observe the market rather than predict it.
Each Candlestick Component Communicates Information
Every candlestick contains four prices:
- Open
- Close
- High
- Low
The body reflects conviction between open and close.
The shadows reflect rejection outside that range.
Long shadows often signal failed attempts by buyers or sellers—valuable information when evaluating reversals.
Important Single-Candlestick Names
While individual candles are rarely traded on their own, understanding their meaning is essential.
- Doji – Open and close are nearly equal, signaling indecision
- Spinning Top – Small body with longer shadows, indicating uncertainty
- Marubozu – Large body with little or no shadows, signaling strong conviction
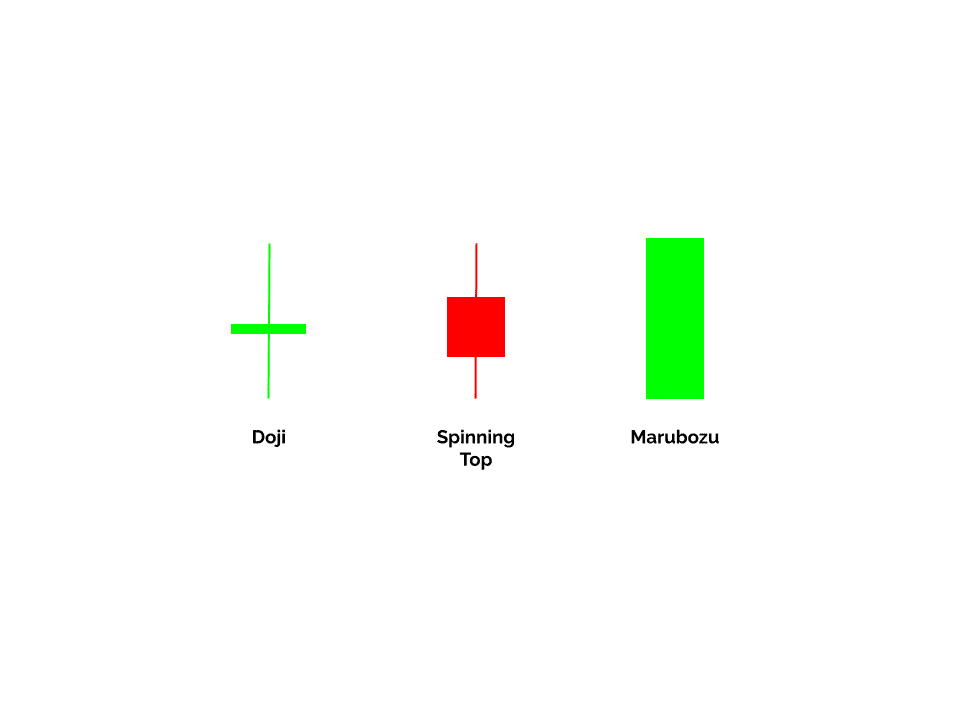
These candles become meaningful only when placed in context.
Do Candlestick Patterns Really Work?
Candlestick patterns do not work in isolation.
On their own, they suggest possibility, not probability. Their effectiveness depends entirely on confirmation from:
- Trend
- Momentum
- Support and Resistance
- Market structure
Without confirmation, candlestick trading often becomes inconsistent and unprofitable.
Forex vs. Stocks: A Key Difference
Forex markets operate 24 hours a day, which means:
- Gaps are rare
- Candlestick continuity is smoother
- Patterns reflect continuous participation
Stock and ETF candlesticks include gaps that change pattern interpretation. Forex candlesticks require forex-specific context.
Looking for a Strategy?
Download the Six Basics of Chart Analysis and sign up for Forex Forecast to learn a bottom-up approach to analyzing Forex markets and weekly market updates.
Be Careful with Extremely Long Shadows
Occasionally, you’ll see unusually long shadows caused by isolated trades or low-liquidity moments.
When this occurs:
- Drop to a lower timeframe
- Identify whether it reflects real participation
- Avoid over-weighting abnormal candles
Not every dramatic candle reflects meaningful sentiment.
The Three Candlestick Pattern Families
Candlestick reversal patterns fall into three broad categories.
One-Candle Patterns
Single candles with small bodies and long shadows.
Examples:
- Hammer
- Inverted Hammer
- Hanging Man
- Shooting Star
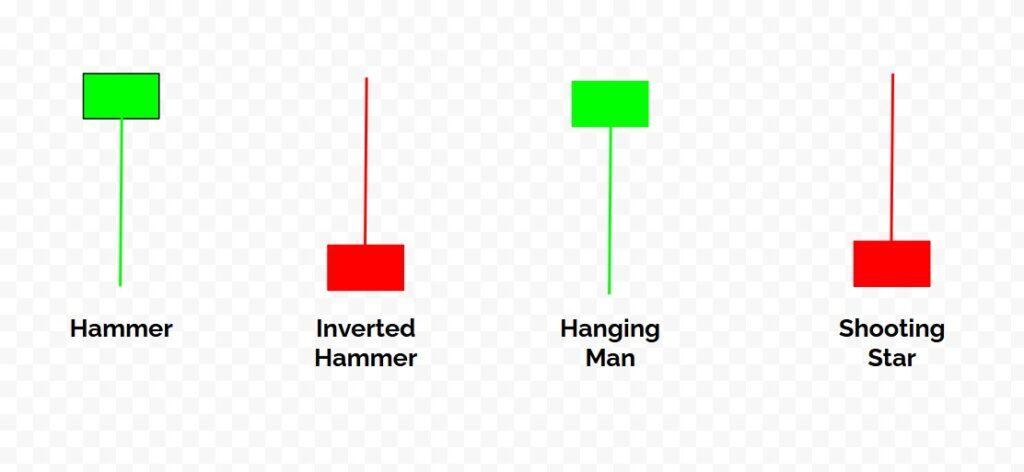
These patterns require strong confirmation.
Two-Candle Patterns
Two consecutive candles that show a clear transfer of control.
Examples:
- Bullish Engulfing
- Bearish Engulfing
- Dark Cloud Cover
- Piercing Pattern
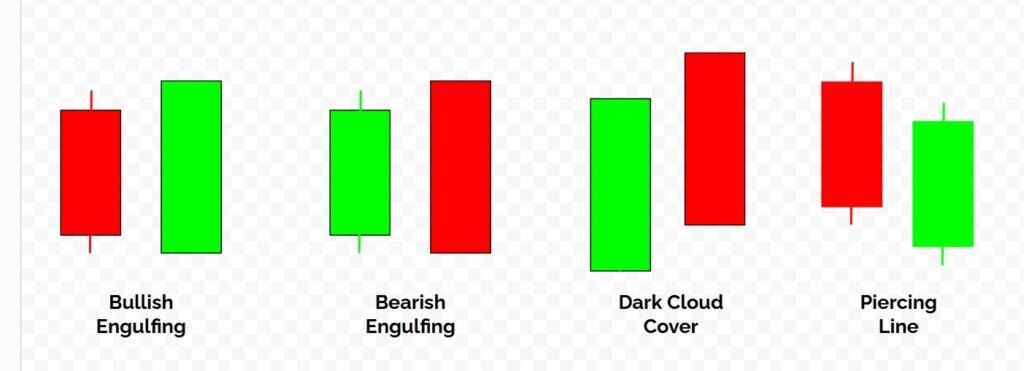
These are among the most reliable candlestick reversals.
Three-Candle Patterns
Three candles demonstrating multi-step transitions from conviction → hesitation → reversal.
Examples:
- Morning Star
- Evening Star
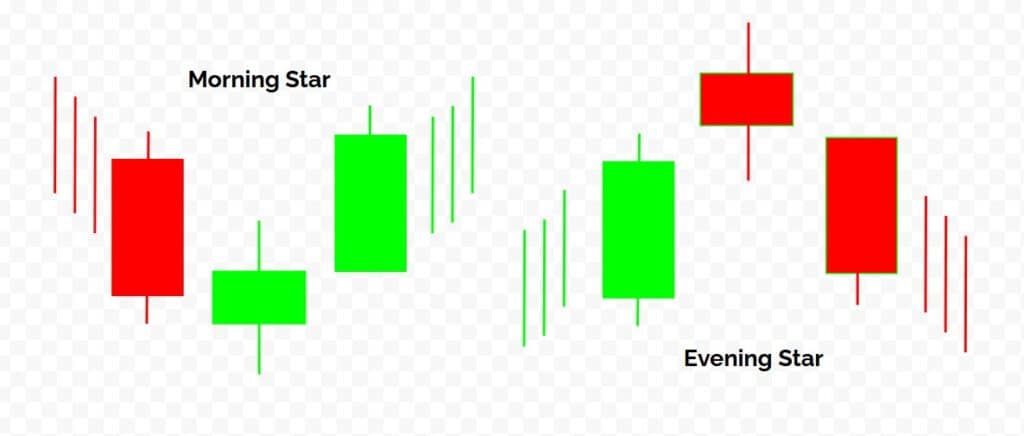
They provide the most straightforward narrative of changing market psychology.
Commonly Found Candlestick Patterns
Hammer and Hanging Man
These patterns share the same shape but appear in different contexts:
- Hammer – Bullish reversal at the end of a Selloff
- Hanging Man – Bearish reversal at the end of a Rally
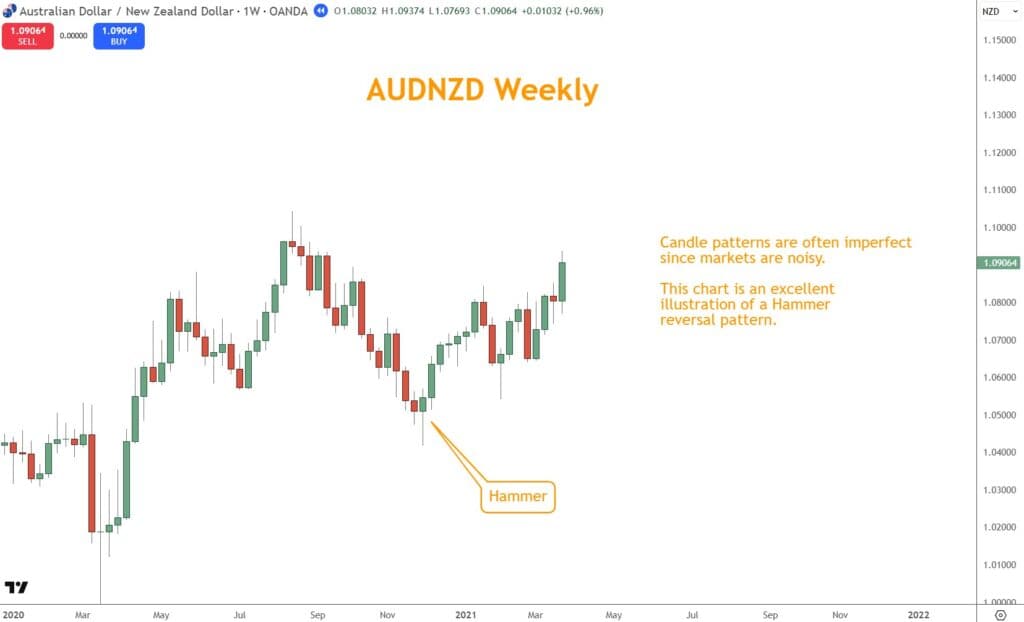
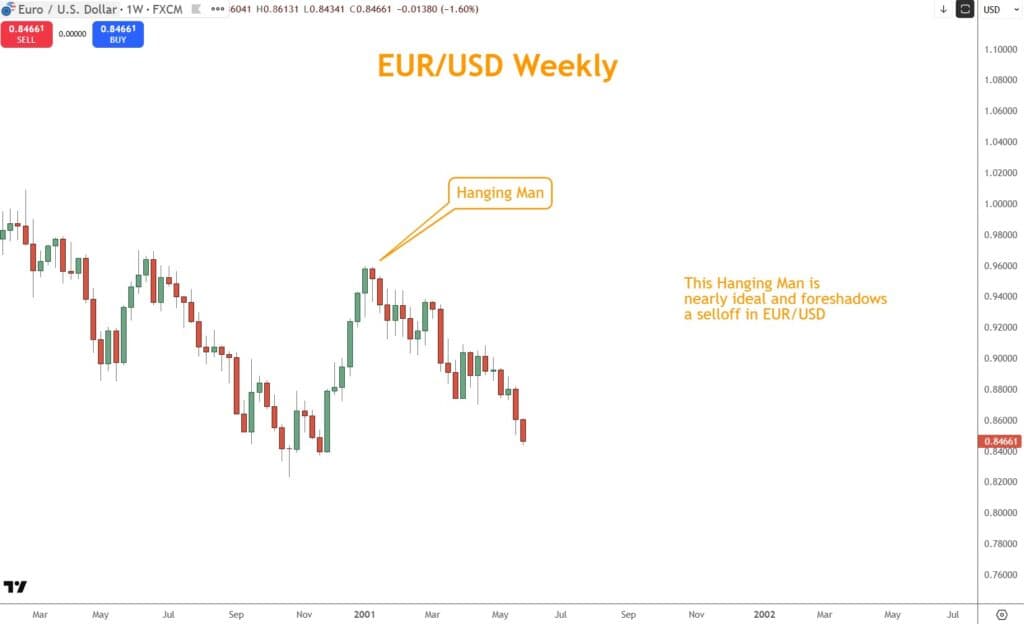
Both signal rejection of extreme prices. Context determines direction.
Bullish and Bearish Engulfing Patterns
Engulfing patterns occur when the second candle completely overtakes the first.
They signal decisive rejection of the prior direction:
- Bullish Engulfing ends selloffs
- Bearish Engulfing ends rallies
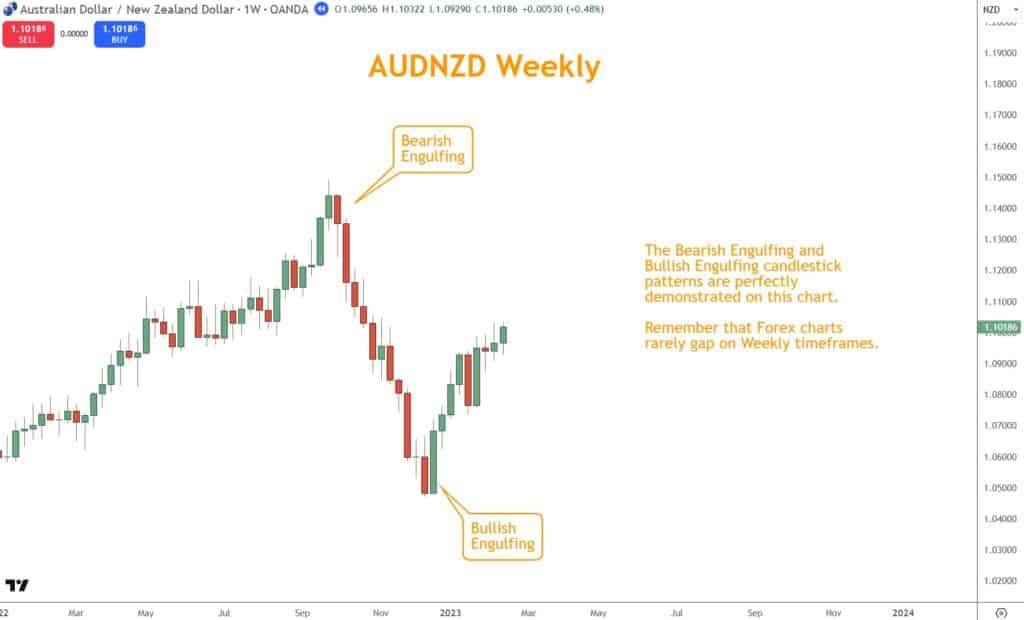
They are most effective near key support or resistance levels.
Morning Star and Evening Star
These three-candle patterns reflect a gradual shift in control.
Morning Star:
- Long Bearish candle
- Small indecision candle
- Strong Bullish candle closing deep into the first
Evening Star is the inverse.
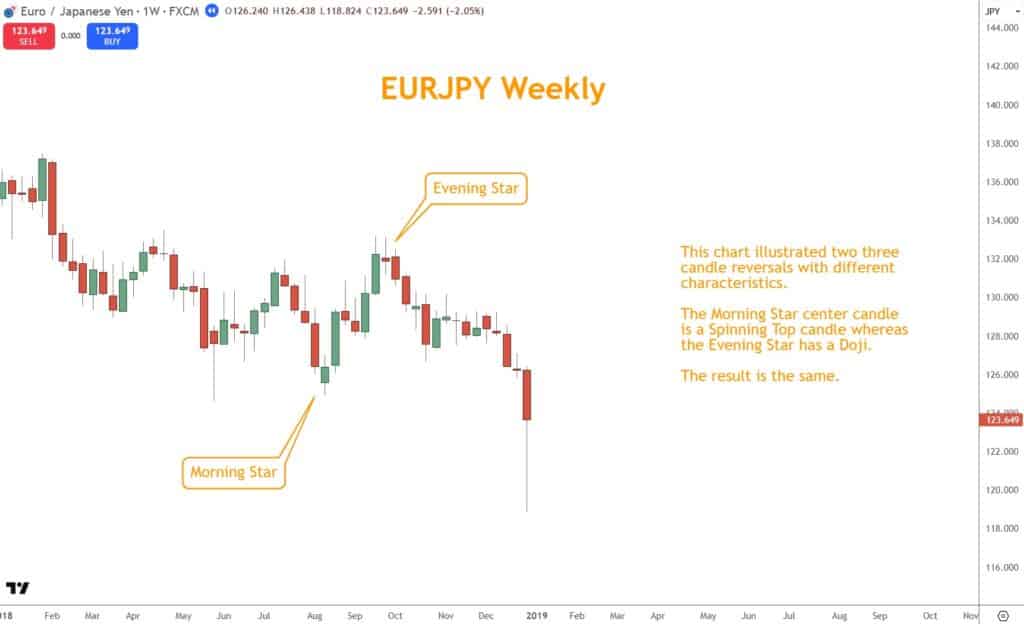
Multi-candle reversals are generally more reliable than single-candle patterns, especially on higher timeframes.
What’s the Next Step?
Evaluate your charts honestly:
- Are candlestick patterns forming at meaningful price levels?
- Do they align with trend and momentum?
- Are you using them to time entries, not predict outcomes?
If you want a structured, position-trading framework that integrates candlesticks correctly, learn the Six Basics of Chart Analysis.
The Six Basics of Chart Analysis and Forex Forecast
This framework is designed specifically for position traders using higher timeframes.
It works across all currency pairs and platforms and keeps your focus on price, structure, and context—where durable trading decisions are made.

You’ll also receive Forex Forecast, delivered every Sunday, featuring real-world chart analysis, trade scenarios, and education—completely free.
Knowledge Check: Candlestick Patterns Quiz
Questions
1. What information does a candlestick primarily represent?
A. News-driven volatility only
B. The relationship between buyers and sellers during a period
C. Indicator-based momentum readings
D. Broker-specific pricing behavior
2. Why do candlestick patterns require confirmation?
A. They only work in ranging markets
B. They predict price targets, not direction
C. They suggest potential reversals but do not confirm them
D. They function independently of trend and structure
3. Which candlestick pattern family is generally the most reliable?
A. One-candle patterns
B. Two-candle patterns
C. Single-session gap patterns
D. Random price spikes
4. Why are candlestick patterns typically more reliable on higher timeframes?
A. Indicators react faster
B. There are fewer candlesticks
C. Broker spreads are narrower
D. More market participants contribute to price formation
5. What is the primary role of candlestick patterns in a trading process?
A. Defining exact profit targets
B. Replacing risk management rules
C. Timing entries within broader market context
D. Predicting fundamental outcomes
Answer Key
- B
- C
- B
- D
- C
Forex Trading Disclosure Statement
Risk Warning:
Forex trading involves significant risk and may not be suitable for all investors. The leveraged nature of Forex trading can work both for and against you, leading to substantial gains or losses. Before trading Forex, you should carefully consider your financial objectives, experience level, and risk tolerance. It is possible to lose more than your initial investment, and you should only trade with money you can afford to lose.
Market Risks and Volatility:
Forex markets are influenced by global economic, political, and social events, which can result in unpredictable price movements. High market volatility can lead to sudden and substantial changes in currency values, potentially causing losses that exceed your initial deposit.
Leverage Risks:
Leverage amplifies both potential gains and potential losses. While leverage can increase profitability, it also increases the risk of significant losses, including the loss of your entire trading capital.
Trading Tools and Technology Risks:
Forex trading platforms, including those offered by brokers, are subject to technology risks, such as system failures, latency issues, and potential errors in price feeds. Traders should be aware that these risks can impact the execution of trades and trading outcomes.
No Guarantee of Profitability:
Past performance in Forex trading is not indicative of future results. There is no guarantee that you will achieve profits or avoid losses when trading Forex. Market conditions and individual trading strategies vary, and no trading system can eliminate the inherent risks of Forex trading.
Educational Purposes Only:
Any information provided about Forex trading, including strategies, analysis, or market commentary, is for educational purposes only and should not be considered financial advice. Consult a qualified financial advisor or tax professional before making any trading decisions.
Regulatory Compliance:
Forex trading is regulated differently in various jurisdictions. Ensure that you are trading with a licensed and compliant broker in your country of residence.
Responsibility:
You are solely responsible for your trading decisions and the associated risks. It is your duty to understand the terms and conditions of Forex trading, including margin requirements, stop-losses, and other risk management tools.
Acknowledgment:
By engaging in Forex trading, you acknowledge that you have read, understood, and accepted this disclosure statement. You accept full responsibility for the outcomes of your trading decisions and agree to trade at your own risk.
This disclosure is intended to provide an overview of the risks associated with Forex trading and is not exhaustive. For additional information, consult your broker and other reliable financial resources.