
Bullish and Bearish Harami patterns are powerful Japanese Candlestick formations that help traders anticipate market reversals in Forex trading.
These two-candle setups reveal a pause or potential shift in sentiment between buyers and sellers.
When combined with confirmation tools such as momentum indicators, chart patterns, and support and resistance, Harami patterns can strengthen your technical analysis and improve decision-making.
Summary
In Forex trading, a Bullish Harami forms during a Selloff and can signal an upward reversal, while a Bearish Harami appears during a Rally and often precedes a downward shift.
This guide explains how to identify both patterns, validate them with complementary analysis techniques, and apply them to improve your trading accuracy.
| Pattern | Market Context | Candle Sequence | Signal Type | Confirmation Tools |
| Bullish Harami | After a Selloff | Large Red Candle → Small Green Candle | Potential Bullish Reversal | RSI Bullish Crossover, Support Level |
| Bearish Harami | After a Rally | Large Green Candle → Small Red Candle | Potential Bearish Reversal | RSI Bearish Crossover, Resistance Level |
TL;DR – How to Trade the Harami Patterns
- A Bullish Harami suggests a shift from sellers to buyers after a Selloff.
- A Bearish Harami hints that buyers may be losing control after a Rally.
- Confirm signals using momentum indicators (RSI), chart patterns, and support/resistance.
- Always seek confirmation before entry to reduce false signals and improve accuracy.
Table of Contents
- Summary
- TL;DR – How to Trade the Harami Patterns
- What Are Bullish and Bearish Harami Patterns?
- How to Use Momentum with Bullish and Bearish Harami Patterns
- Chart Patterns Can Validate Harami Signals
- Support and Resistance as Confirmation Tools
- Conclusion
- What’s the Next Step?
- Quiz: Understanding Harami Patterns in Forex
- Frequently Asked Questions
- Forex Trading Disclosure Statement
What Are Bullish and Bearish Harami Patterns?
Harami patterns are two-candle reversal formations that signal a possible change in market direction.
They reflect a momentary pause or shift in momentum between buyers and sellers.
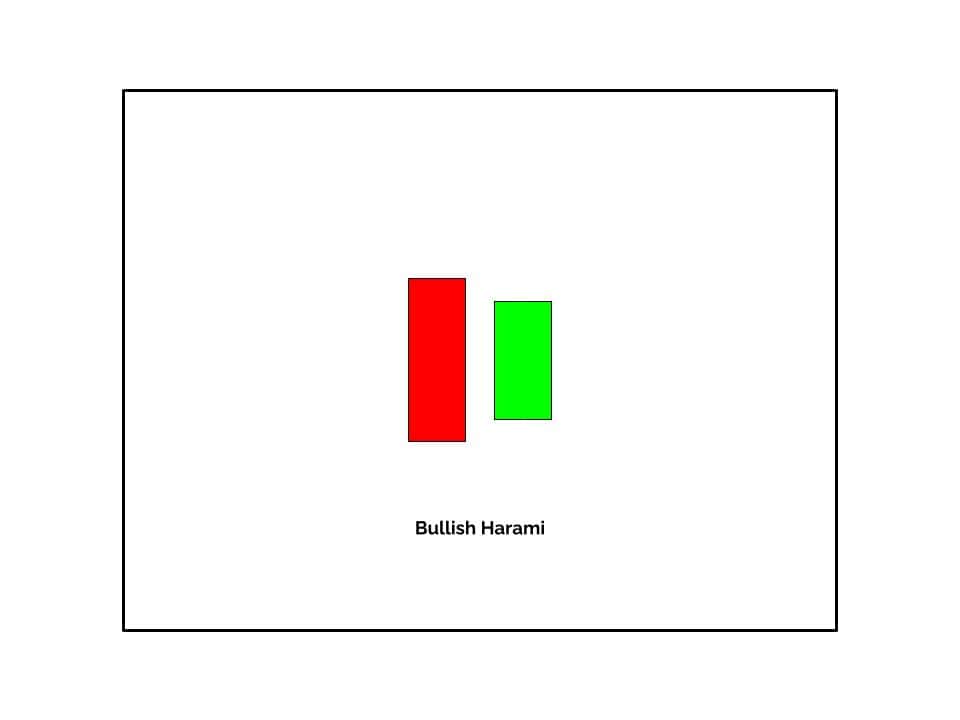
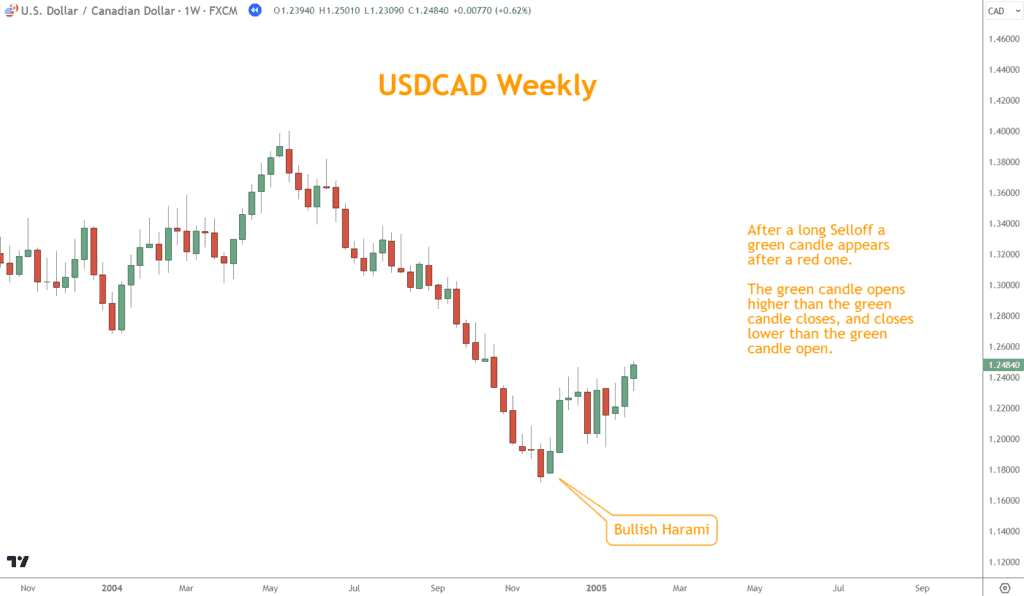
Bullish Harami: Appears in a downtrend (Selloff). A large red candle is followed by a small green candle contained within the prior candle’s body.
This indicates weakening selling pressure and potential reversal upward.
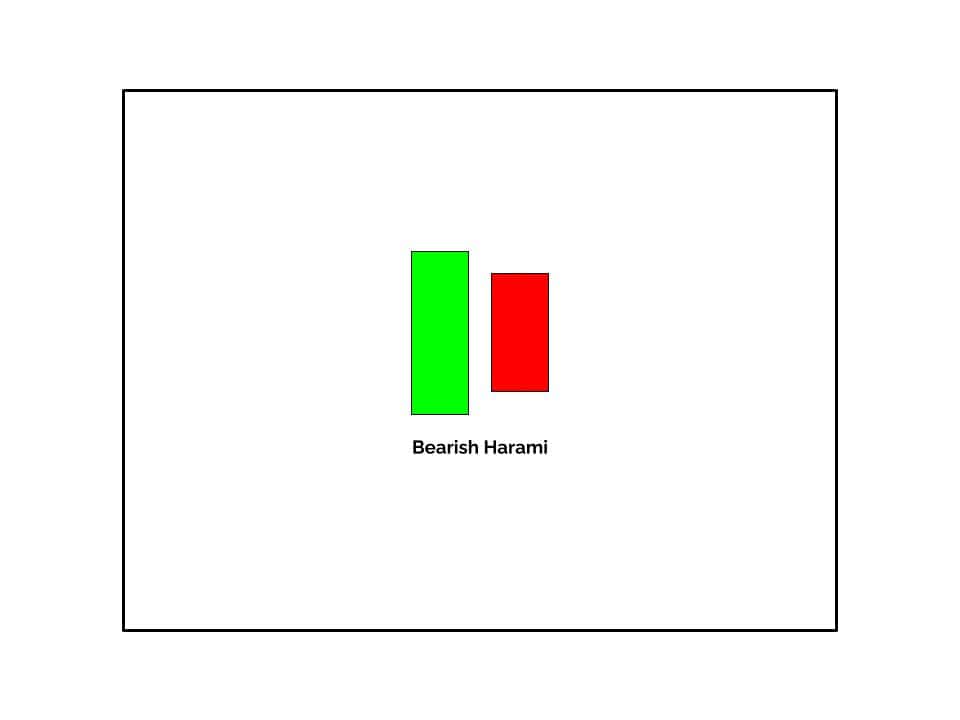
Bearish Harami: Forms in an uptrend (rally). A large green candle is followed by a smaller red candle within its range, signaling buyer fatigue and a possible reversal downward.
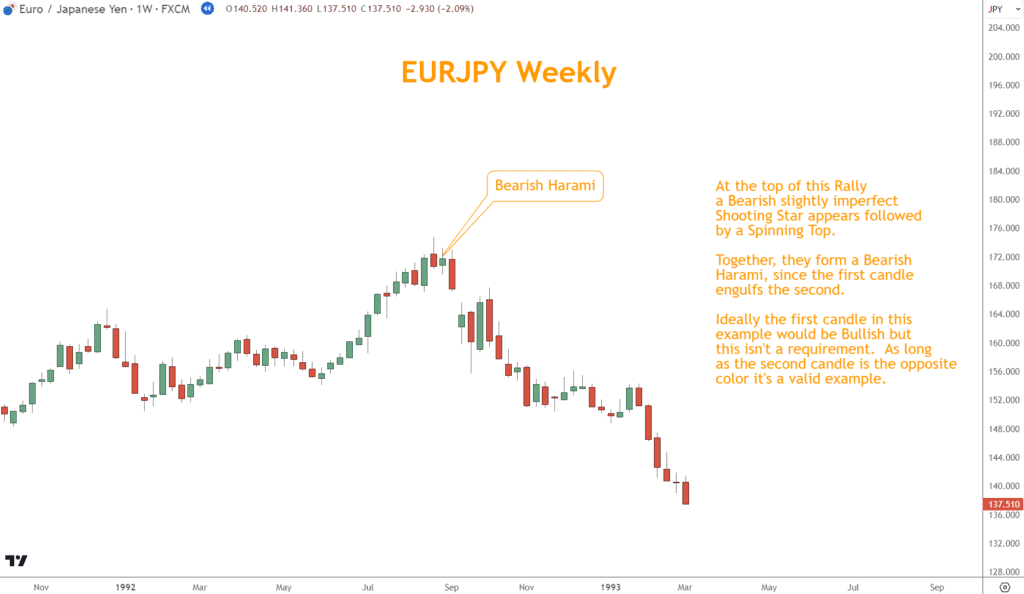
Recognizing these patterns is key to anticipating trend shifts and refining your entry and exit timing.
How to Use Momentum with Bullish and Bearish Harami Patterns
Momentum reveals the speed and strength of price movement — a critical factor for confirmation.
It acts as a measure of market energy and helps you validate Harami signals before acting.
Key Steps for Confirmation
- Apply a momentum indicator such as the Relative Strength Index (RSI).
- Check if the RSI shows an oversold condition (below 30) for a bullish Harami or overbought (above 70) for a bearish Harami.
- Look for a momentum crossover or divergence to support the candlestick signal.
In the example below, a bearish Harami coincides with the RSI’s overbought status before a significant selloff.
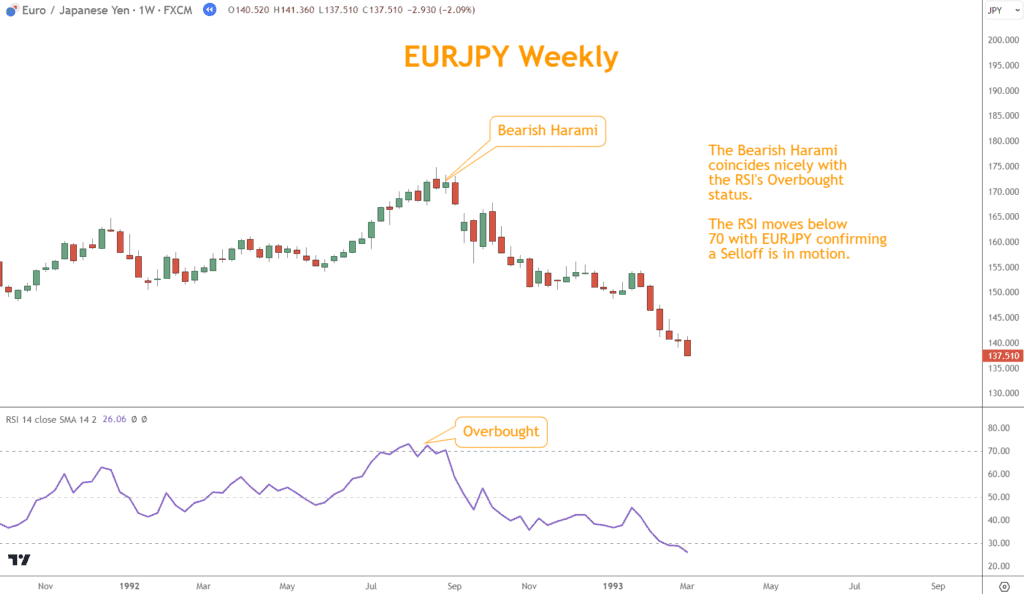
Using momentum reduces false positives and adds quantitative support to pattern-based setups.
Looking for a Strategy?
Download the Six Basics of Chart Analysis and sign up for Forex Forecast to learn a bottom-up approach to analyzing Forex markets and weekly market updates.
Chart Patterns Can Validate Harami Signals
Chart patterns — graphical illustrations of market psychology — provide context for Harami formations.
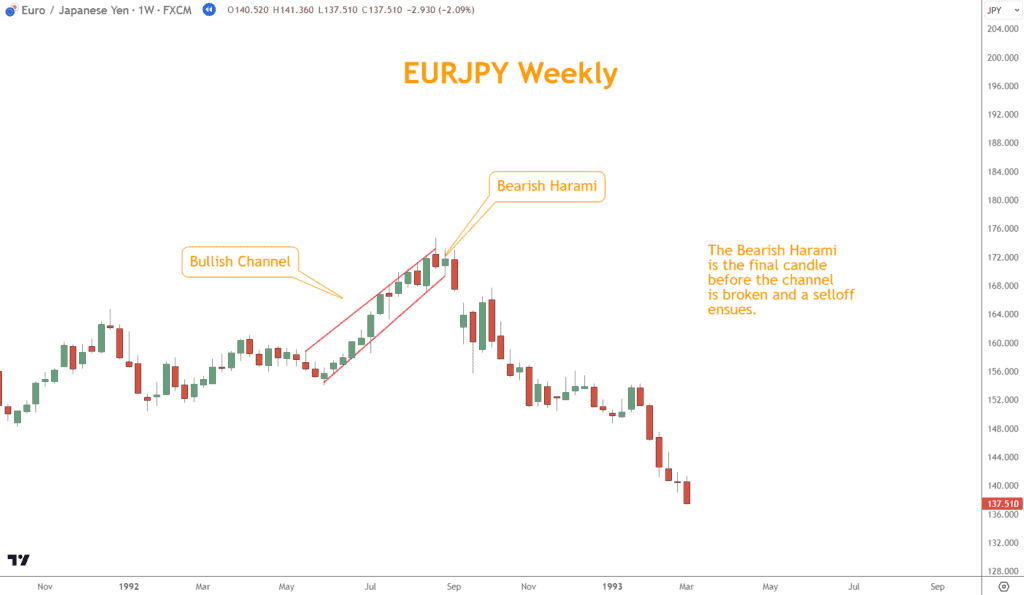
They help you determine whether a Harami signal is part of a larger continuation or reversal structure.
- Continuation Patterns (e.g., Flags, Pennants) imply the trend will continue.
- Reversal Patterns (e.g., Double Bottoms, Head and Shoulders) indicate a potential turn.
When a reversal Chart Pattern appears alongside a Harami signal, it reinforces the probability of a trend change and boosts confidence in your trade setup.
Support and Resistance as Confirmation Tools
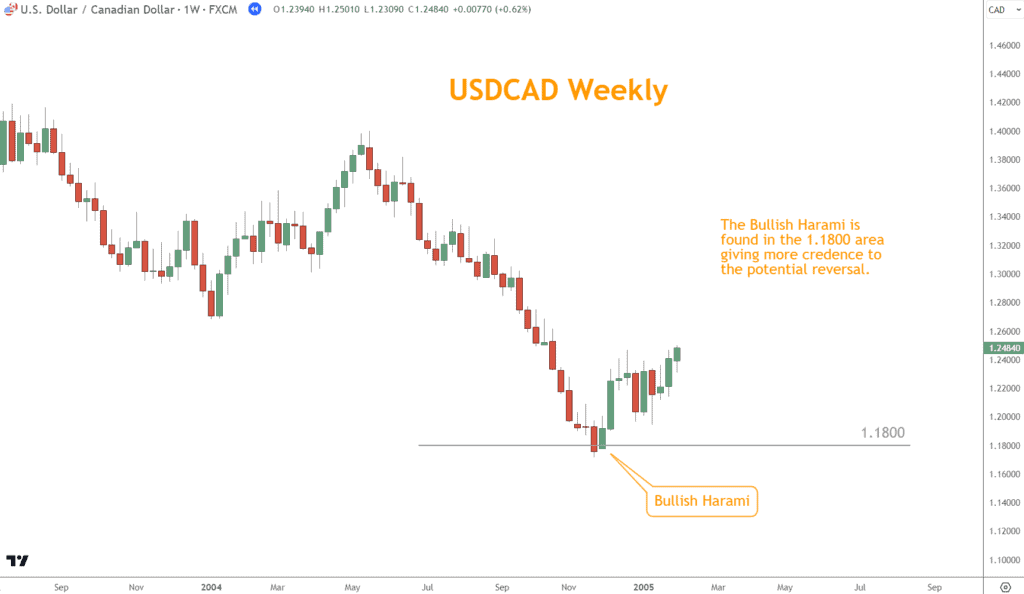
Support and Resistance levels represent price zones where buyers and sellers have previously reacted strongly.
These zones often act as decision points for trend continuation or reversal — making them excellent confirmation tools for Harami patterns.
Integration Example
- A Bullish Harami near a major Support Level suggests a likely Rally.
- A Bearish Harami near a key Resistance Level signals a potential Selloff.
The convergence of candlestick signals with Support and Resistance enhances forecast accuracy and risk management.
Conclusion
Mastering Harami patterns requires context.
By combining them with Momentum analysis, Chart Patterns, and Support/Resistance zones, you can identify high-probability reversals with greater confidence.
Applied correctly, these techniques improve decision quality, control risk, and support consistent Forex performance.
What’s the Next Step?
Put what you’ve learned into practice:
- Open a chart and spot Harami patterns.
- Combine them with Momentum, Chart Patterns, and Support/Resistance for confirmation.
- Use these signals to refine entry and exit timing.

Need a structured framework? Download the Six Basics of Chart Analysis free and get the Forex Forecast newsletter every Sunday with:
- Trade Ideas and Market Analysis
- Case Studies from Profitable Setups
- Educational Videos and Strategy Guides
- Weekly Article Updates and Webinar Invitations
Quiz: Understanding Harami Patterns in Forex
1. What does a Bullish Harami typically indicate?
a. Continuation of a downtrend
b. Potential upward reversal
c. Lack of momentum
d. Sideways movement
2. What tool is commonly used to confirm Harami signals?
a. RSI (Momentum Indicator)
b. MACD
c. Simple Moving Average
d. Volume Oscillator
3. Where is a Bullish Harami most significant?
a. At Resistance
b. At Support
c. Mid-trend
d. After a Rally
4. How does a Bearish Harami form?
a. Small green candle → large red candle
b. Large green candle → small red candle
c. Large red candle → small green candle
d. Two identical red candles
5. Why should Harami patterns be combined with other technical tools?
a. To increase trade frequency
b. To confirm signals and avoid false entries
c. To reduce chart time
d. To increase lot sizes
Answer Key
- b. Potential upward reversal
- a. RSI (Momentum Indicator)
- b. At Support
- b. Large green candle → small red candle
- b. To confirm signals and avoid false entries
Frequently Asked Questions
What is the significance of a Harami pattern in Forex trading?
It signals a potential reversal in price direction, helping you anticipate optimal entry and exit points.
How reliable are Harami patterns?
They are useful indicators but require confirmation through Momentum and other technical tools to filter false signals.
Can Harami patterns be used for long-term strategies?
Yes, though they are typically more effective on shorter timeframes where market momentum is clearer.
How can traders differentiate between genuine and false Harami signals?
Use confirmation from Momentum, Support/Resistance, and Chart Patterns to validate the signal’s strength.
Can Harami patterns be combined with other technical tools?
Absolutely — their effectiveness increases when used alongside Momentum, trend analysis, and chart structures.
Forex Trading Disclosure Statement
Risk Warning:
Forex trading involves significant risk and may not be suitable for all investors. The leveraged nature of Forex can amplify both gains and losses. Trade only with capital you can afford to lose.
Market Risks and Volatility:
Currency values are influenced by global economic and political events that may cause sudden price fluctuations. High volatility can result in losses exceeding your initial deposit.
Leverage Risks:
While leverage can increase profit potential, it also magnifies loss risk and may lead to margin calls or account liquidation.
Technology Risks:
Trading platforms are subject to system failures and latency issues that may impact execution accuracy or timing.
No Guarantee of Profitability:
Past performance does not guarantee future results. No system can eliminate the risks inherent in Forex trading.
Educational Purpose Only:
This material is for educational purposes and should not be construed as financial advice. Consult a qualified financial advisor before making trading decisions.
Responsibility:
You bear full responsibility for your trading decisions and their outcomes. Understand margin requirements, stop-loss tools, and risk management strategies before participating.
Acknowledgment:
By engaging in Forex trading, you acknowledge these risks and accept that all trades are undertaken at your own risk.