
The Bullish and Bearish Engulfing patterns are two of the most important Japanese candlestick formations in Forex trading. They capture the ongoing battle between buyers and sellers and often mark turning points in market direction.
A Bullish Engulfing forms after a Selloff and signals a potential upward reversal.
A Bearish Engulfing forms after a Rally and suggests a possible downward shift.
This guide will show you how to identify both patterns, understand their psychology, and use them alongside tools like momentum indicators, chart patterns, and support/resistance for better confirmation and higher-probability trades.
Quick Reference Table: Comparing Bullish and Bearish Engulfing Patterns
| Pattern Type | Market Context | Candle Sequence | Signal Type | Confirmation Tools |
|---|---|---|---|---|
| Bullish Engulfing | After a selloff | Small red candle followed by a large green candle that engulfs it | Potential Bullish Reversal | TSI Bullish Cross, Support Level |
| Bearish Engulfing | After a rally | Small green candle followed by a large red candle that engulfs it | Potential Bearish Reversal | TSI Bearish Cross, Resistance Level |
TL;DR – Key Takeaways
- Bullish and Bearish Engulfing patterns signal possible trend reversals.
- Confirm with momentum indicators, chart patterns, and support/resistance.
- Avoid trading them in isolation — confirmation is essential.
- These patterns visually reveal a shift in market sentiment between buyers and sellers.
- Combining them with other tools improves timing and accuracy.
What Are the Basics of a Japanese Candlestick?
Understanding candlesticks is the first step to mastering Engulfing patterns.
Each candle represents the open, close, high, and low prices within a timeframe. The body shows the open-close range, while the wicks (or shadows) display the highest and lowest points reached.
The examples below illustrate the basic Japanese candlestick.
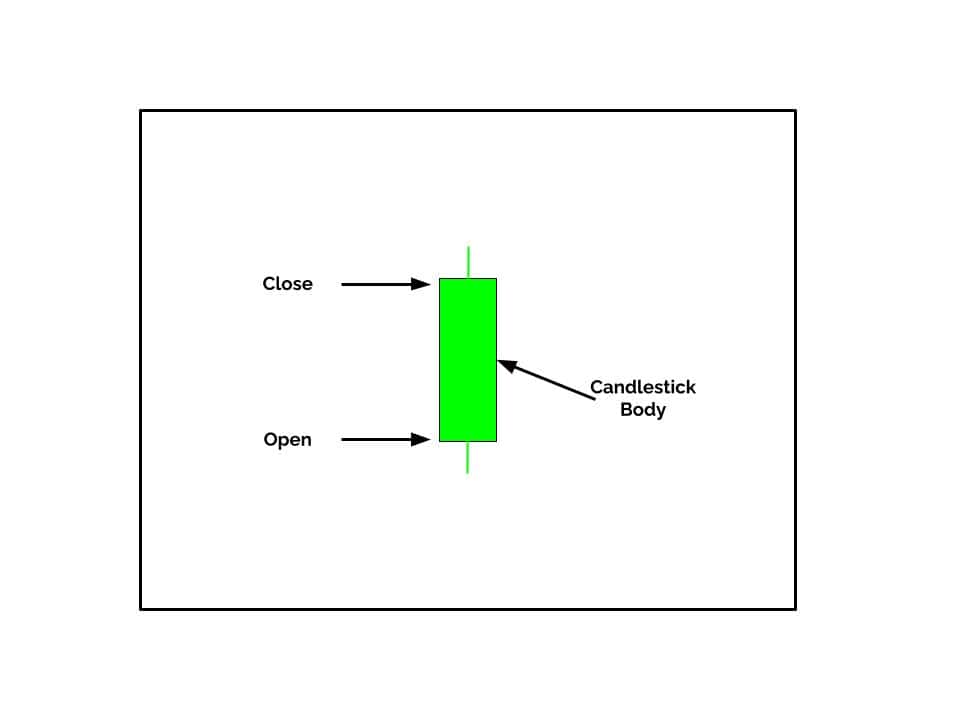
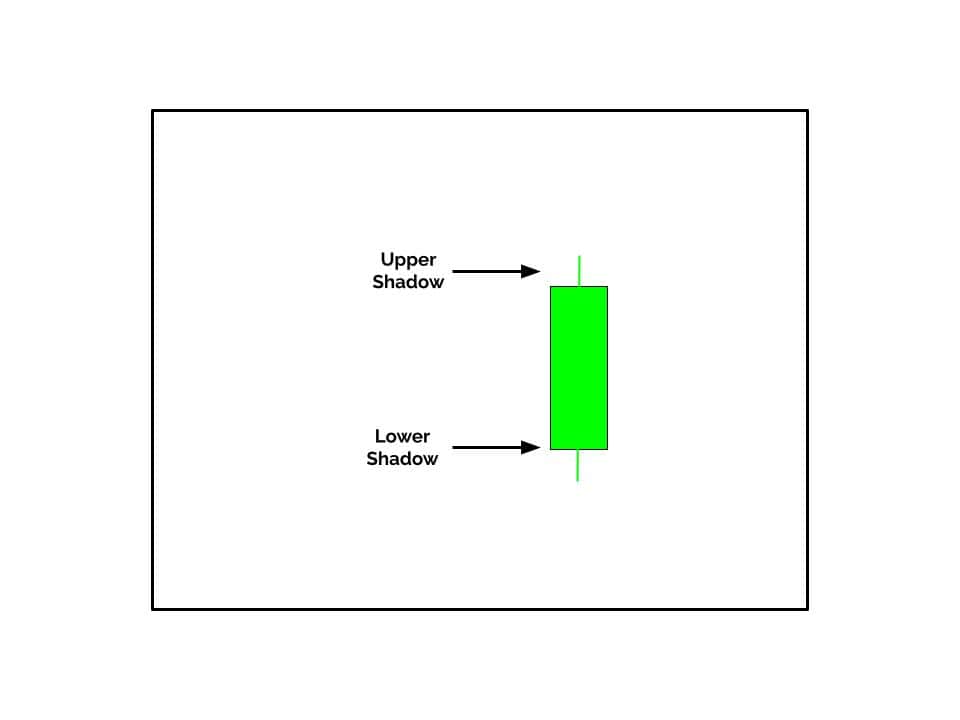
This structure provides a clear visual of market sentiment during that period.
Once you understand individual candles, interpreting multi-candle formations—like the Bullish and Bearish Engulfing patterns—becomes much easier.
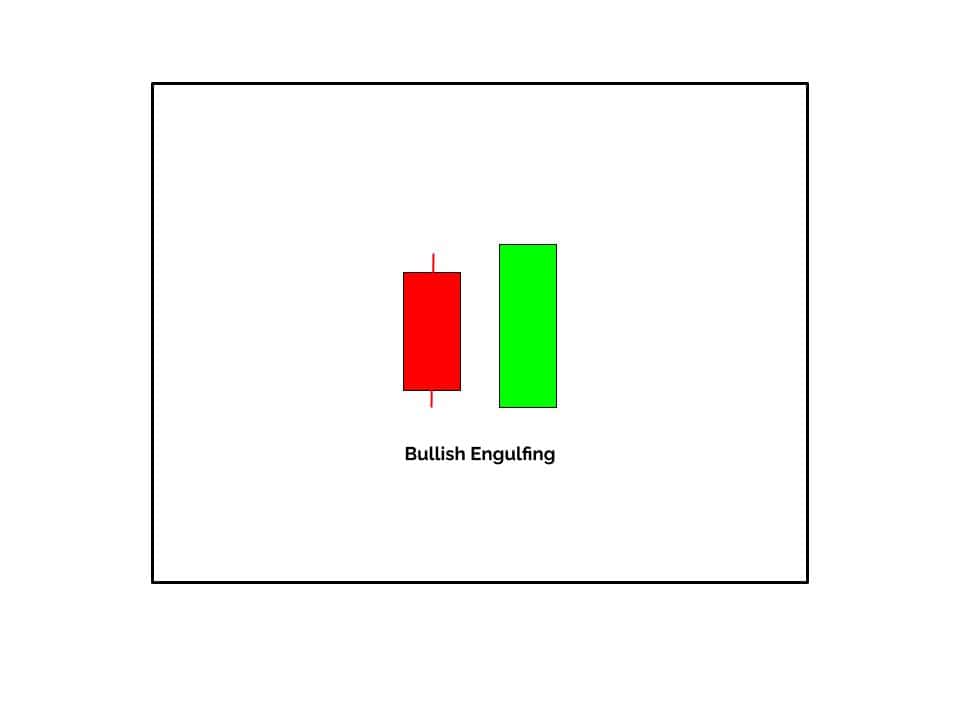
How to Identify a Bullish Engulfing Pattern
A Bullish Engulfing Pattern occurs during a Selloff and hints at a potential reversal to the upside.
The example below illustrates how a small bearish candle is followed by a larger bullish candle that fully engulfs the previous body. This shows that buying pressure has overtaken selling pressure.
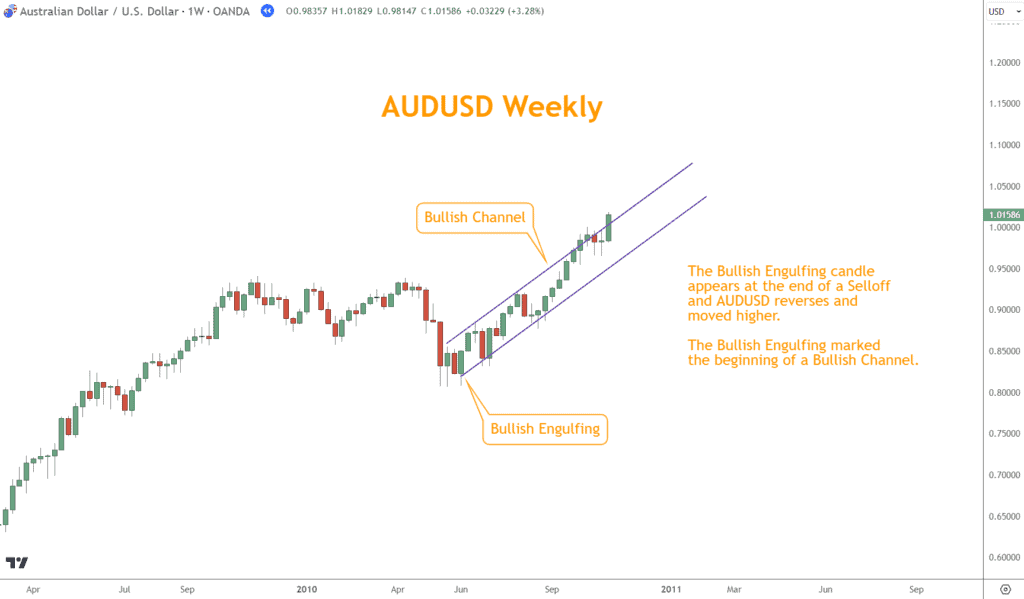
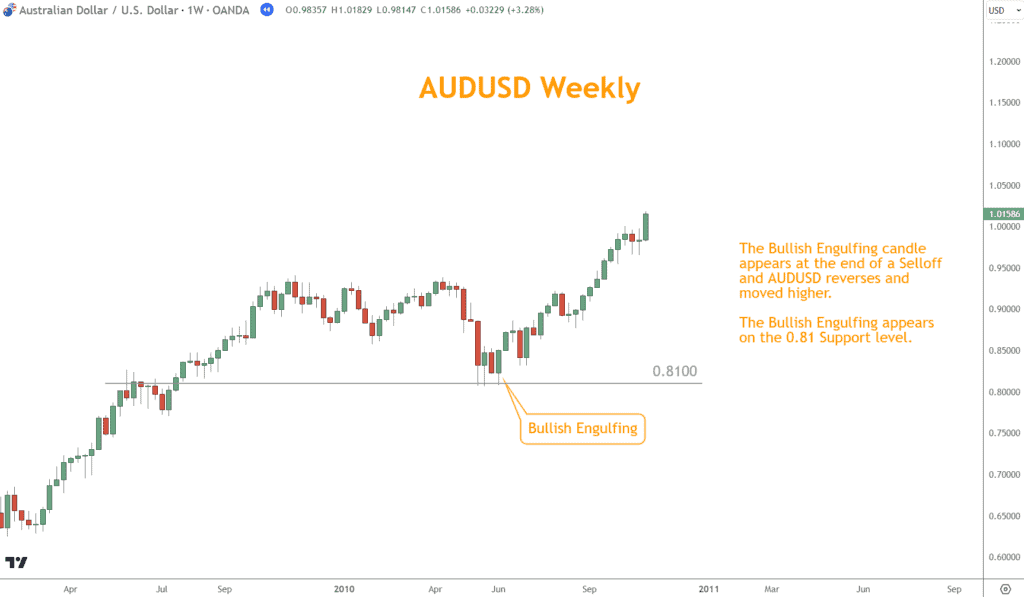
This AUD/USD example below illustrates how the pattern reverses a selloff into a rally.
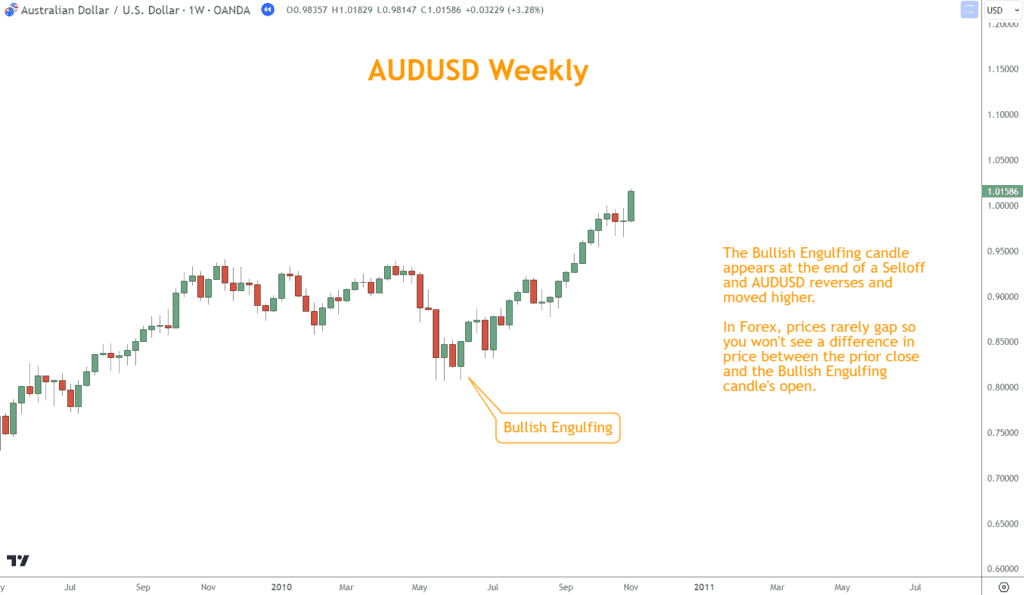
When this formation appears near a support level, it signals that buyers are stepping in and a rally could begin.
Confirmation from a momentum indicator or chart pattern adds credibility to the setup and helps filter false signals.
What Is a Bearish Engulfing Pattern?
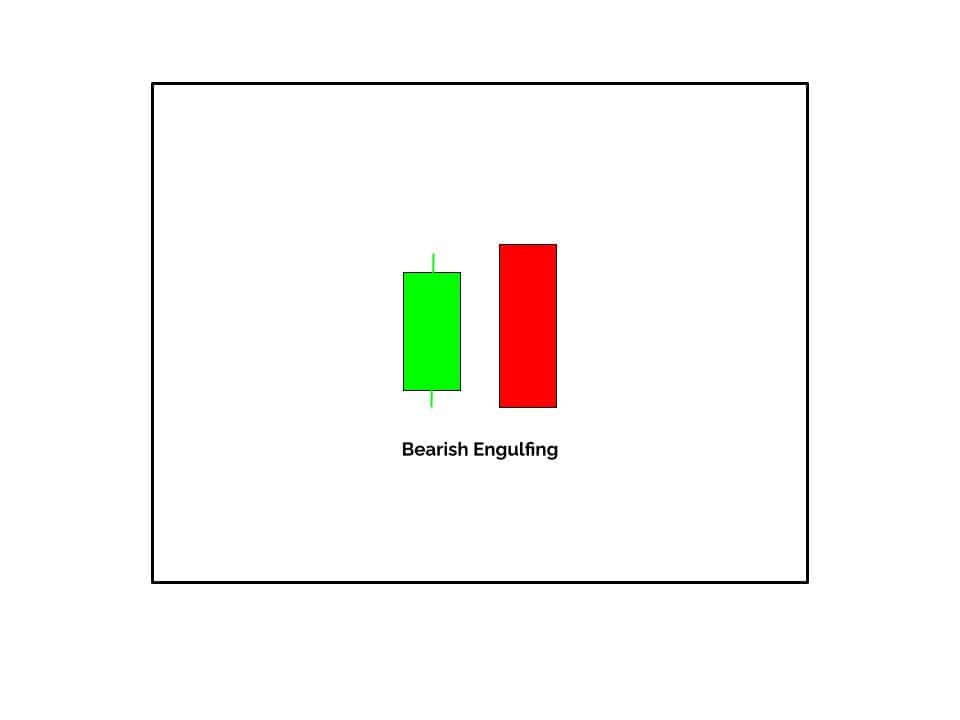
A Bearish Engulfing Pattern develops during a Rally and suggests a possible downward reversal.
It starts with a small bullish candle, followed by a larger bearish candle that completely engulfs the earlier candle’s body, as shown below. This shows sellers overpowering buyers.
This AUD/USD example demonstrates how the pattern reverses a rally, triggering a selloff.
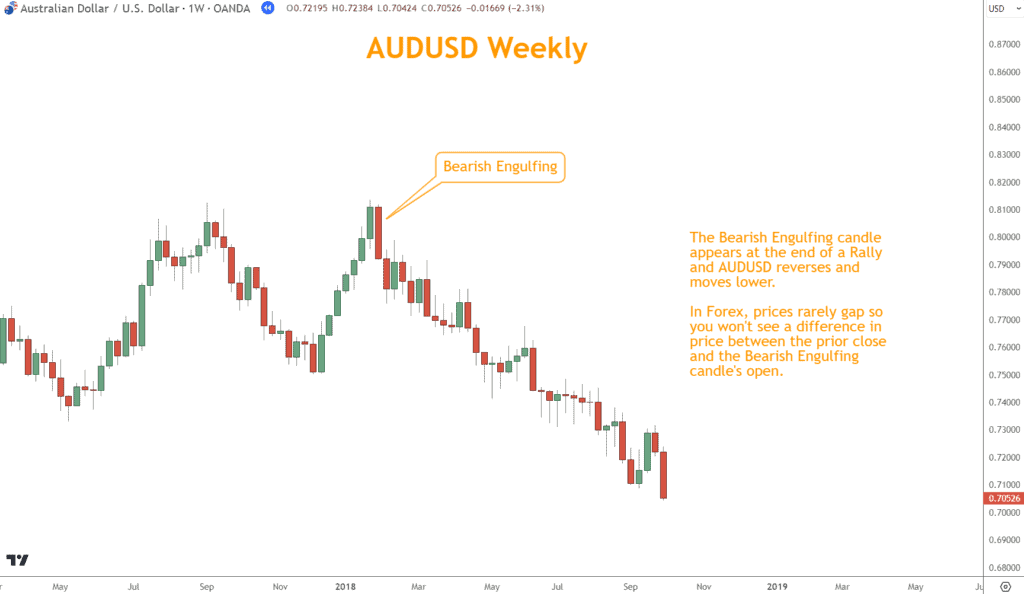
When this pattern forms near resistance or after a strong uptrend, it often signals the return of selling pressure.
Recognizing this shift early helps you tighten stops, take profit, or plan a short trade.
Looking for a Strategy?
Download the Six Basics of Chart Analysis and sign up for Forex Forecast to learn a bottom-up approach to analyzing Forex markets and weekly market updates.
Using Engulfing Patterns with Other Technical Tools
Engulfing patterns are powerful but incomplete on their own.
To increase their reliability, combine them with momentum indicators, chart structures, and key price levels.
This confirmation-based approach transforms simple visual cues into actionable, higher-confidence trades.
1. Momentum Indicators: True Strength Index (TSI)
Momentum determines whether price action matches the market’s internal strength.
The True Strength Index (TSI) helps confirm whether a potential reversal is genuine or temporary noise.
- A Bullish Engulfing pattern confirmed by a TSI Bullish Cross strengthens the case for a rally.
- A Bearish Engulfing confirmed by a TSI Bearish Cross suggests a credible downtrend reversal.
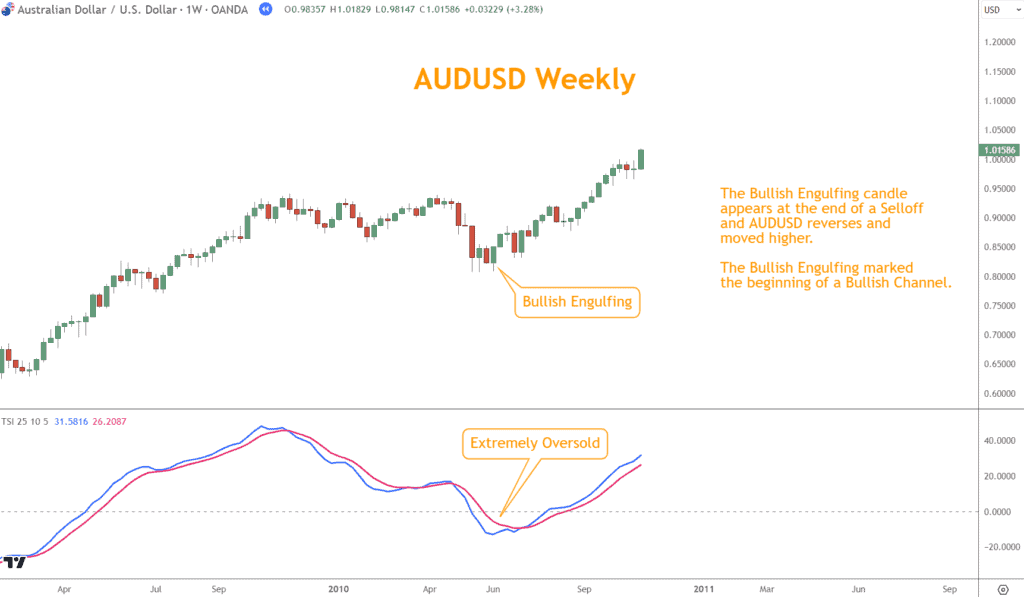
Momentum confirmation ensures you trade in sync with real buying or selling pressure instead of emotional impulses.
2. Chart Patterns
Chart patterns provide context for engulfing setups and help validate their timing.
- A Bullish Engulfing at the base of a Descending Channel or along the support line of a Descending Triangle signals a potential buy.
- A Bearish Engulfing near the top of an Ascending Channel or along the resistance line of an Ascending Triangle signals a potential sell.
When both the candlestick and the broader chart structure indicate a reversal, confidence in the trade setup increases significantly.
3. Support and Resistance
Support and Resistance levels represent critical price zones where reactions often occur.
Aligning engulfing patterns with these levels filters out false setups and reveals high-probability opportunities.
- A Bullish Engulfing near Support signals renewed buyer interest and a potential rebound.
- A Bearish Engulfing near Resistance signals renewed selling pressure and a possible pullback.
When candlestick behavior aligns with historical turning points, it strengthens both your analysis and execution timing.
Conclusion
These Engulfing patterns are key two-candle reversal signals that help traders visualize shifts in market sentiment.
Using these patterns effectively requires confirmation through momentum, structure, and key levels.
This disciplined approach helps you avoid false signals, trade with greater confidence, and refine your technical analysis over time.
Frequently Asked Questions
This section clarifies how to use Engulfing patterns effectively and safely. Each answer stays focused on practical decisions—confirmation, risk, and process—so you can apply the insights on real charts without guesswork.
Q1. What is the significance of Japanese candlestick patterns in Forex trading?
Japanese candlestick patterns visualize price action and trader sentiment within a timeframe. They help you determine who is in control (buyers or sellers) and anticipate potential shifts, improving the timing of entries, exits, and risk control.
Q2. How reliable are Bullish and Bearish Engulfing patterns?
They are proper reversal signals, but should not be traded in isolation. Reliability rises when you confirm them with momentum (e.g., a TSI cross), chart context (triangles, channels), and nearby support/resistance, combined with disciplined risk management.
Q3. How can I differentiate between a valid reversal and a false signal?
Start with context: trend direction, location (support/resistance), and structure (chart pattern). Then seek confirmation from momentum or subsequent price action. If confirmation is missing or mixed, treat the setup as lower probability.
Q4. How important is risk management when trading with these patterns?
It’s essential. Use proper position sizing, predefined stop-loss and take-profit levels, and sensible leverage. Even strong Engulfing signals can fail—risk management protects your account and maintains consistency in your process.
Q5. Can beginners use these patterns effectively?
Yes—if they practice on a demo account first and follow a structured analysis routine. Focus on one timeframe, log examples, and require confirmation before live trades to reduce avoidable mistakes.
Q6. Should I rely solely on candlestick patterns for trading decisions?
No. Candlesticks provide the signal, but confirmation comes from momentum, support/resistance, and chart patterns. A well-rounded trading plan integrates all three to improve accuracy and consistency.
Next Steps for Traders
Now that you understand Bullish and Bearish Engulfing patterns:
- Open a chart and look for these patterns in real market conditions.
- Confirm each setup with momentum indicators, chart patterns, and support/resistance.
- Practice recognizing both bullish and bearish reversals across different market environments.
If you don’t yet have a structured trading process, start with our Six Basics of Chart Analysis — a free guide that builds a strong foundation for practical technical analysis.
By signing up, you’ll also receive Forex Forecast, a free weekly newsletter that includes:
- Trade ideas and setups using the Six Basics
- Case studies from real-world trades
- Educational guides and videos
- Updates on new articles and webinars

Quiz: Understanding Bullish and Bearish Engulfing Patterns
1. What does a Bullish Engulfing pattern indicate?
a. A continuation of a downtrend
b. A potential upward reversal after a Selloff
c. Market indecision
d. Overbought conditions
2. What confirms the strength of an Engulfing pattern?
a. Only the candlestick’s size
b. Random chart patterns
c. Momentum indicators and nearby support/resistance
d. Trading volume alone
3. When is a Bearish Engulfing pattern most reliable?
a. During a downtrend
b. Near resistance after a rally
c. During consolidation
d. When paired with a bullish crossover
4. Why combine Engulfing patterns with other tools?
a. To improve confirmation and accuracy
b. To trade more frequently
c. To avoid using stop-losses
d. To ignore fundamentals
5. What does the second candle in a Bullish Engulfing pattern do?
a. Matches the first candle in size
b. Engulfs the previous bearish candle’s body completely
c. Has no wick
d. Is smaller than the first candle
Answer Key
- b. A potential upward reversal after a selloff
- c. Momentum indicators and nearby support/resistance
- b. Near resistance after a rally
- a. To improve confirmation and accuracy
- b. Engulfs the previous bearish candle’s body completely
Forex Trading Disclosure Statement
Risk Warning:
Forex trading involves significant risk and may not be suitable for all investors. The leveraged nature of Forex trading can work both for and against you, leading to substantial gains or losses. Before trading Forex, you should carefully consider your financial objectives, experience level, and risk tolerance. It is possible to lose more than your initial investment, and you should only trade with money you can afford to lose.
Market Risks and Volatility:
Forex markets are influenced by global economic, political, and social events, which can result in unpredictable price movements. High market volatility can lead to sudden and substantial changes in currency values, potentially causing losses that exceed your initial deposit.
Leverage Risks:
Leverage amplifies both potential gains and potential losses. While leverage can increase profitability, it also increases the risk of significant losses, including the loss of your entire trading capital.
Trading Tools and Technology Risks:
Forex trading platforms, including those offered by brokers, are subject to technology risks such as system failures, latency issues, and potential errors in price feeds. Traders should be aware that these risks can impact the execution of trades and trading outcomes.
No Guarantee of Profitability:
Past performance in Forex trading is not indicative of future results. There is no guarantee that you will achieve profits or avoid losses when trading Forex. Market conditions and individual trading strategies vary, and no trading system can eliminate the inherent risks of Forex trading.
Educational Purposes Only:
Any information provided about Forex trading, including strategies, analysis, or market commentary, is for educational purposes only and should not be considered financial advice. Consult a qualified financial advisor or tax professional before making any trading decisions.
Regulatory Compliance:
Forex trading is regulated differently in various jurisdictions. Ensure that you are trading with a licensed and compliant broker in your country of residence.
Responsibility:
You are solely responsible for your trading decisions and the associated risks. It is your duty to understand the terms and conditions of Forex trading, including margin requirements, stop-losses, and other risk management tools.
Acknowledgment:
By engaging in Forex trading, you acknowledge that you have read, understood, and accepted this disclosure statement. You accept full responsibility for the outcomes of your trading decisions and agree to trade at your own risk.
This disclosure is intended to provide an overview of the risks associated with Forex trading and is not exhaustive. For additional information, consult your broker and other reliable financial resources.