
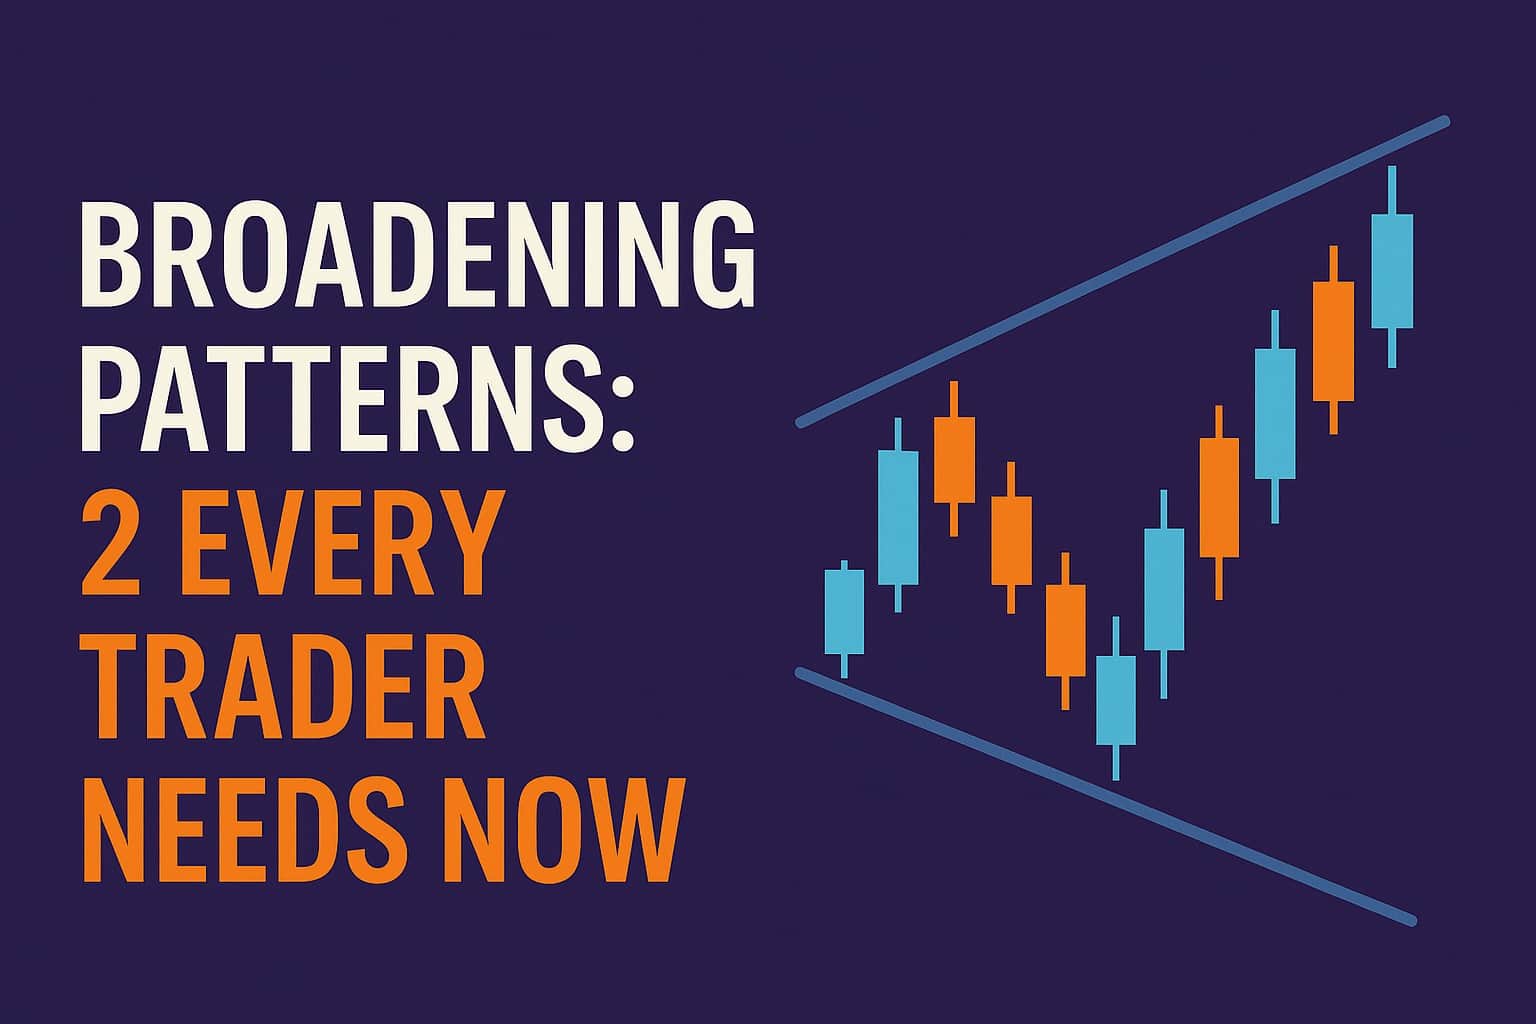
Broadening Patterns are significant chart formations that reveal expanding price behavior over time.
These patterns often emerge during periods of heightened volatility and uncertainty, where buyers and sellers repeatedly overpower each other. As price swings widen, the market creates a megaphone-like shape on the chart.
Understanding these formations can help you interpret market sentiment, anticipate potential reversals, and better time your trading decisions.
This guide explains how these patterns form, how to trade them, and how to use momentum, candlesticks, and support/resistance to confirm each setup.
Quick Reference Table: Broadening Patterns
| Pattern Type | Market Context | Psychology | Signal Bias | Confirmation Tools |
| Ascending Broadening | After a Rally | Higher highs with increasingly higher lows | Typically Bearish | Break below the lower line, Momentum, Candlesticks |
| Descending Broadening | After a Selloff | Lower lows but increasingly higher highs | Typically Bullish | Break above the upper line, Momentum, Candlesticks |
TL;DR – Master These 2 Broadening Patterns
This article teaches you how to identify and trade the two primary Broadening Patterns:
- Ascending Broadening Pattern (Bearish)
- Descending Broadening Pattern (Bullish)
You’ll learn how price expands during uncertainty, how pattern psychology signals trend exhaustion, and why confirmation is essential.
You’ll also see how to combine them with Momentum tools, Japanese Candlestick Patterns, and Support and Resistance for stronger setups.
Table of Contents
- TL;DR – Master These 2 Broadening Patterns
- How Broadening Patterns Form
- What Is an Ascending Broadening Pattern?
- What Is a Descending Broadening Pattern?
- Harnessing Their Power in Trading
- Enhancing Confirmation Strength with Other Indicators
- Broadening Wedge Patterns Are Not Standalone Indicators
- What’s the Next Step?
- Frequently Asked Questions (FAQs)
- Forex Trading Disclosure Statement
How Broadening Patterns Form
Broadening Patterns develop when both buyers and sellers aggressively test new highs and lows, thereby widening the trading range.
This results in a megaphone-like pattern, reflecting indecision, volatility, and a lack of clear market control.
The alternating optimism and pessimism create expanding swings. Recognizing this structure early can help you anticipate trend shifts before they fully materialize.
What Is an Ascending Broadening Pattern?
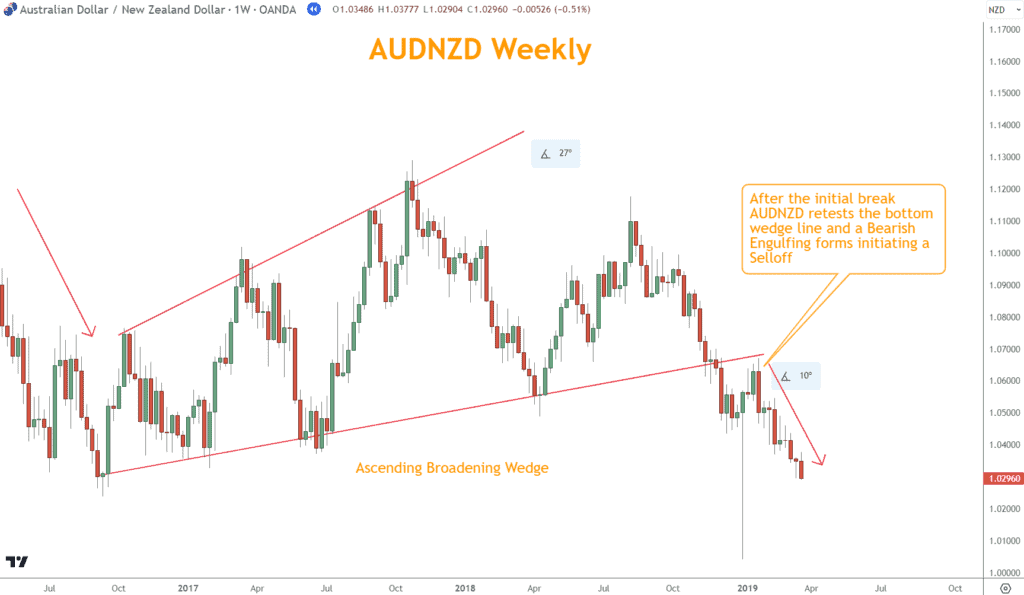
An Ascending Broadening Pattern forms when price rises while the range between highs and lows expands.
The upper boundary rises gently, while the lower boundary rises more steeply, creating two diverging upward trendlines.
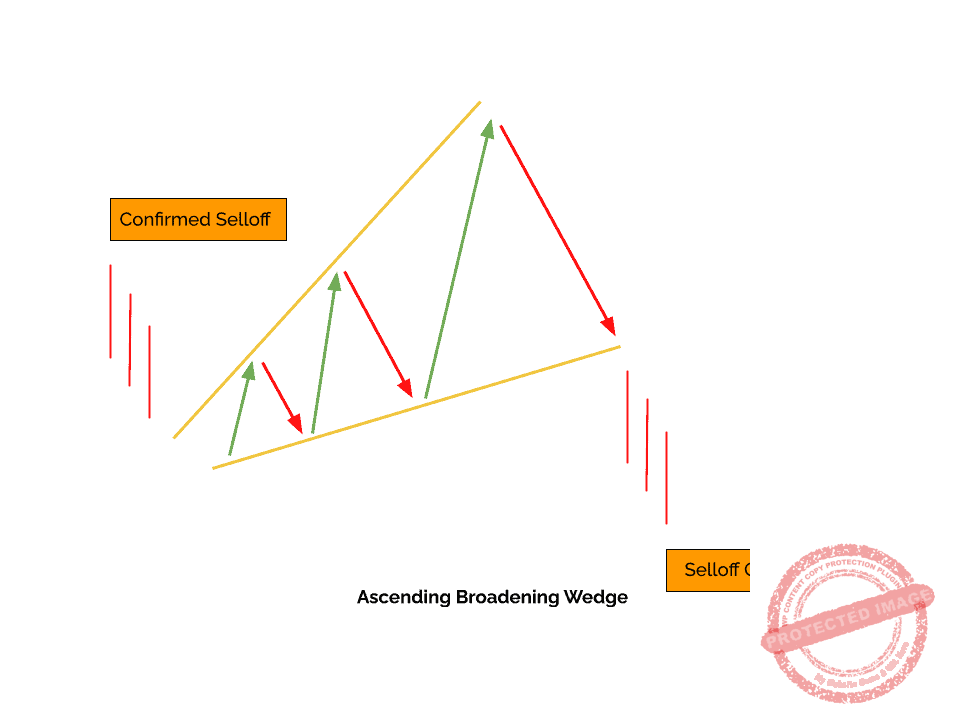
This behavior often follows a strong Rally and, despite its upward slope, typically signals a weakening Bullish trend.
Why It Forms
This pattern reflects the buyer’s attempts to push the price higher, but each new low becomes significantly broader, revealing increasing uncertainty.
This inconsistency in bullish strength often precedes a pullback or reversal.
How to Trade It
A confirmed break below the lower line is the standard trigger for a short trade.
Stops are commonly set above the most recent high to control risk. As always, traders should wait for a decisive break rather than anticipating one prematurely.
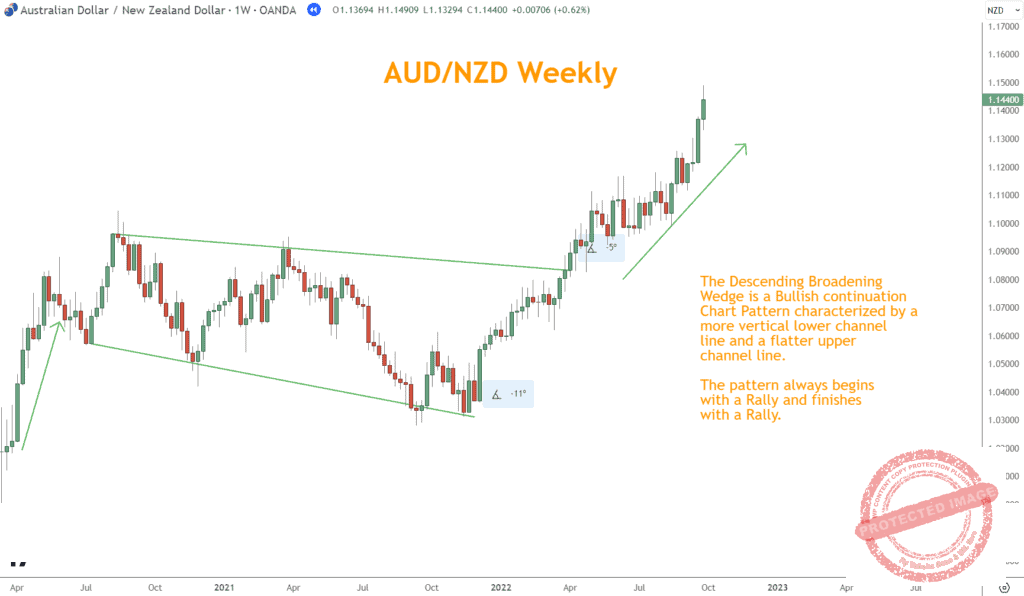
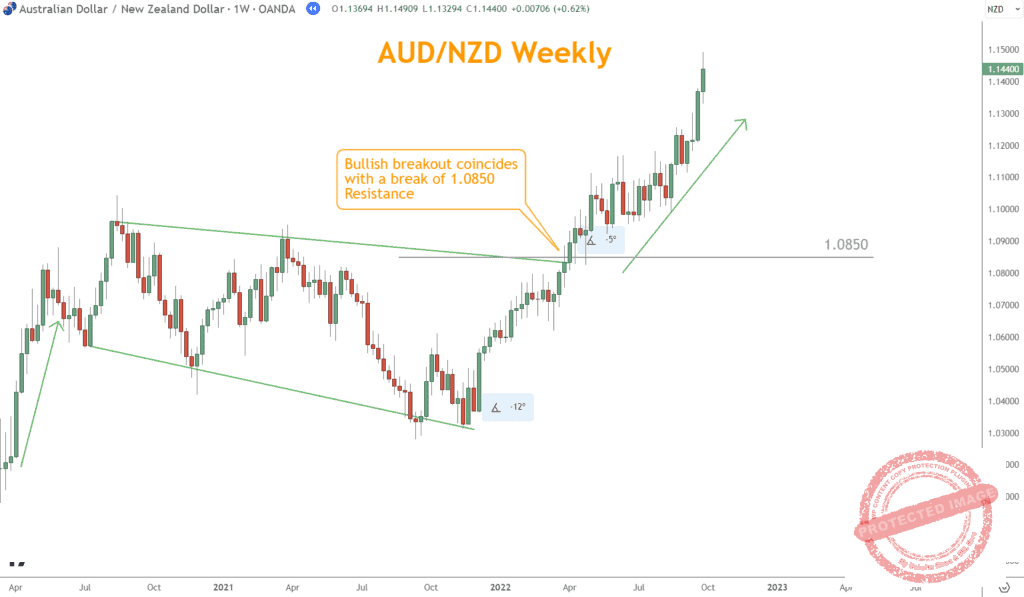
What Is a Descending Broadening Pattern?
A Descending Broadening Pattern expands downward, with the upper line sloping downward slowly and the lower line declining more sharply.
The price swings widen as the pattern progresses.
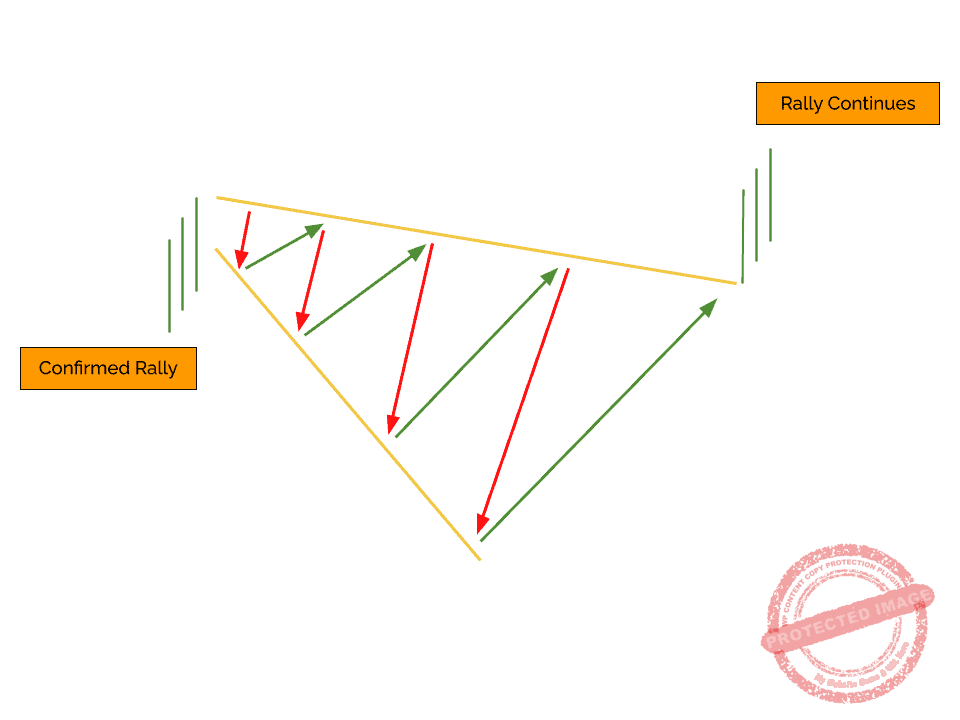
Despite its downward direction, this formation is typically Bullish and often appears after pronounced selloffs.
Why It Forms
The pattern reflects the seller’s attempts to push prices lower, but the increasingly higher highs show rising hesitation and strengthening Bullish interest.
Sellers lose momentum even as new lows form. This shift often precedes a major reversal or Rally.
How to Trade It
A confirmed break above the upper diverging line signals a potential long entry.
Stop losses are commonly placed below the most recent low, providing adequate protection while capturing the early stages of a trend reversal.
Harnessing Their Power in Trading
Broadening Patterns are most effective when applied with a disciplined entry and exit strategy.
Because these formations indicate growing volatility, traders must plan their trades carefully.
Short entries for Ascending Broadening patterns typically occur after breaks below the lower trendline, while long entries for Descending Broadening Patterns follow breaks above the upper line.
If you come across an Ascending Broadening pattern, it might be a good idea to open a short position once you confirm a break below the lower line. Consider setting a stop-loss just above the most recent high to manage your risk.
Conversely, a Descending Broadening pattern might initiate a long position after a confirmed break above the upper line, with a stop-loss set just below the latest low.
Position Planning
- Ascending Broadening (Bearish): Consider short entries after confirmation and place stop-losses above the recent high.
- Descending Broadening (Bullish): Consider long entries after confirmation and place stop-losses below the most recent low.
- Take-profit levels can be based on Support/Resistance or the widest span of the pattern.
- Take-profit levels can be based on Support/Resistance or the widest span of the pattern.
Looking for a Strategy?
Download the Six Basics of Chart Analysis and sign up for Forex Forecast to learn a bottom-up approach to analyzing Forex markets and weekly market updates.
Enhancing Confirmation Strength with Other Indicators
Broadening Patterns gain significant predictive strength when combined with complementary tools. Indicators and patterns help validate whether a breakout is genuine or likely to fail.
Momentum, Japanese Candlesticks, and Support and Resistance are especially effective at filtering noise and identifying reliable trade setups.
How to Combine Them
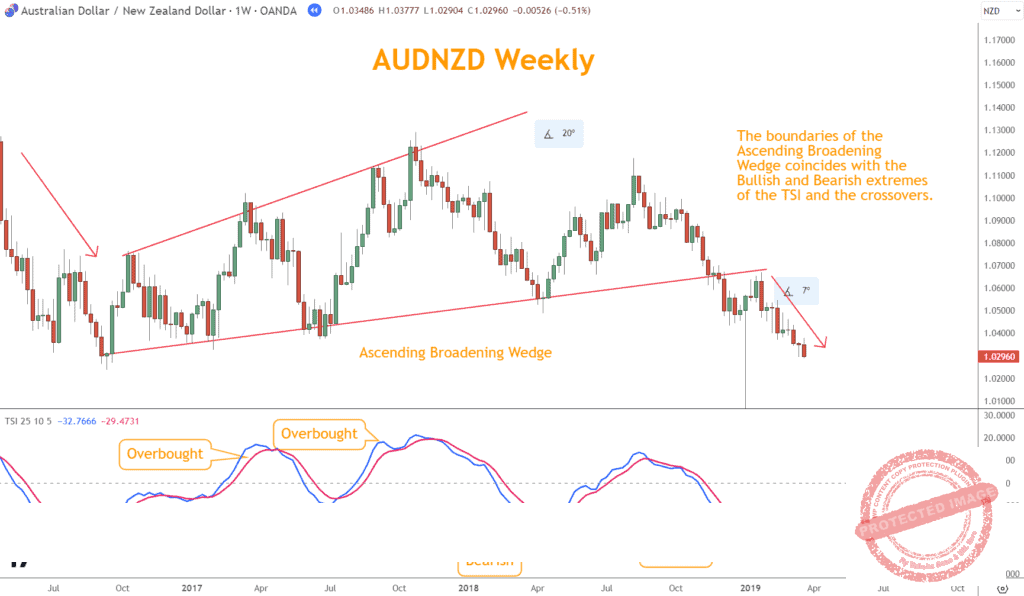
- Momentum (TSI): Helps determine whether the Rally or Selloff fueling the pattern is weakening. A divergence between price and TSI can signal an impending reversal.
- Candlestick Patterns: Useful for identifying precise turning points within the pattern’s structure.
- Support and Resistance: Helps confirm breakout zones and locate higher-probability entry and exit points.
For instance, the interaction of price with momentum during such patterns can offer clues about the strength and potential longevity of the Rally.
The True Strength Indicator (TSI) can identify overbought or oversold conditions, providing context to the broadening formation.
A divergence between the TSI and the price, especially during the pattern formation, can signal weakening Momentum and potential reversals.
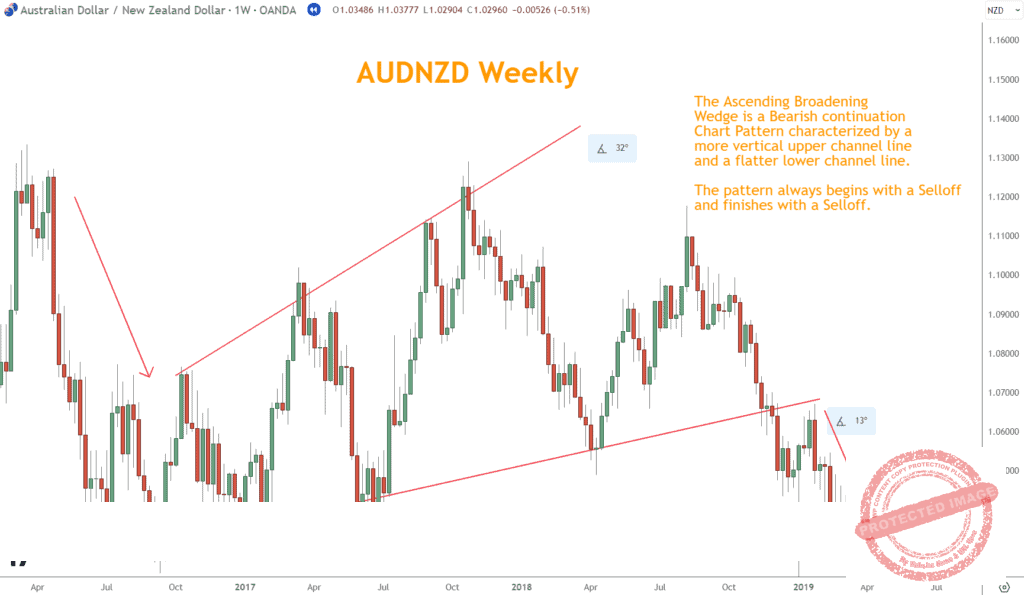
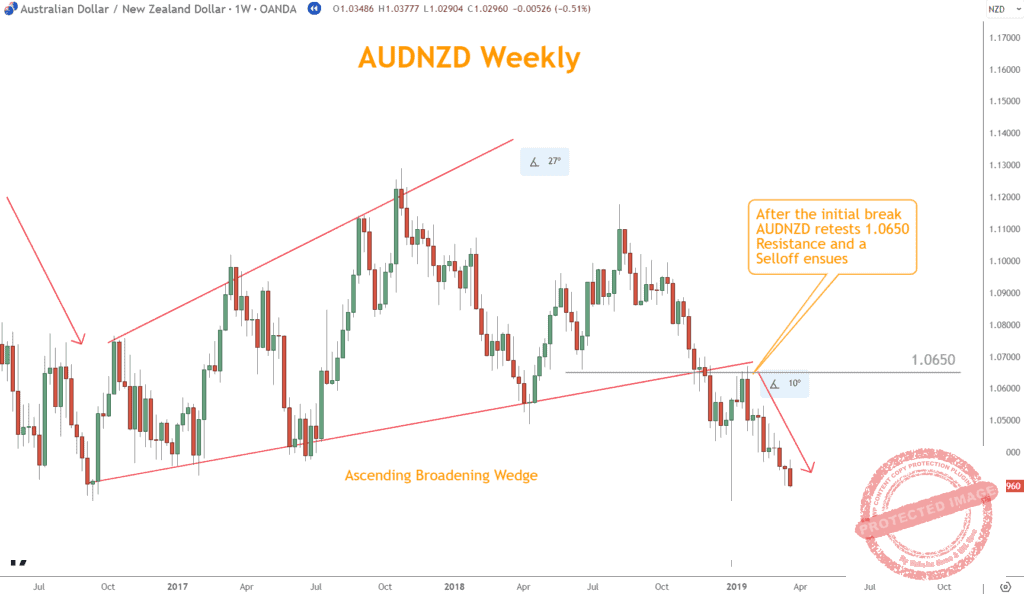
The selloff in the pattern coincides with the TSI’s oversold and lower move in the AUD/NZD example below.
Utilizing Japanese Candlestick Patterns can help to pinpoint reversals and improve the accuracy of entry and exit points. The Bearish Engulfing candlestick pattern coincides with the move lower in AUD/NZD after the pattern.
Lastly, support and resistance can highlight areas of frequent reversal that precede significant price movements. In this AUD/NZD example, the rally out of the pattern and above the resistance happens together.
The same is true for the AUD/NZD selloff example as well. The last reversal occurs at a well-established support and resistance level.
Integrating these elements adds clarity, reduces false signals, and boosts trading accuracy.
Broadening Wedge Patterns Are Not Standalone Indicators
Broadening Patterns offer powerful insights, but no single chart pattern can guarantee a specific outcome.
These formations can fail under intense volatility, fundamental shocks, or shifts in market sentiment.
To avoid relying too heavily on any one tool, traders must combine Broadening Patterns with a broader analytical context.
Key Limitations
- External events (economic data, central bank actions, geopolitical shocks) can override technical patterns.
- Market dynamics can cause patterns to break early or late.
- Risk management must always accompany pattern-based trading.
Using diverse tools and strict risk parameters helps mitigate unexpected reversals or false breakouts.
What’s the Next Step?
Open a chart and look for Broadening Patterns using the techniques outlined in this guide.
Then, layer additional tools—Momentum, Japanese Candlesticks, and Support and Resistance—to evaluate how they reinforce or weaken the setup.
If you need a structured approach, you can learn the Six Basics of Chart Analysis for free to establish a foundation for analyzing any currency pair.
When you get the Six Basics, you’ll also receive Forex Forecast every Sunday, which includes:
- Trade ideas based on the Six Basics
- Case studies from top trades
- Educational guides and videos
- New article alerts
- PositionForex updates
- Free webinar invitations
- And additional trading tools

All of it is free.
Frequently Asked Questions (FAQs)
What are Broadening Patterns in Forex Trading?
They are chart formations where price expands over time, forming a megaphone shape. They can be ascending or descending and often signal potential reversals.
How reliable are Ascending and Descending Broadening Patterns?
They are useful tools, but like all patterns, they require confirmation and should be used alongside other indicators and awareness of fundamental events.
Can I trade solely based on Broadening Patterns?
Trading solely on any single pattern or indicator is not recommended. A multi-tool approach is more reliable.
How do I set stop-loss and take-profit levels with Broadening Patterns?
Stops typically go above the most recent high (ascending) or below the most recent low (descending). Take-profit zones can come from S/R or the pattern’s widest area.
How do indicators like TSI or Candlestick Patterns interact with Broadening Patterns?
TSI helps identify Overbought/Oversold conditions or divergence. Candlestick Patterns help pinpoint reversals and strengthen confirmation.
Forex Trading Disclosure Statement
Risk Warning:
Forex trading involves significant risk and may not be suitable for all investors. The leveraged nature of Forex trading can work both for and against you, leading to substantial gains or losses. Before trading Forex, you should carefully consider your financial objectives, experience level, and risk tolerance. It is possible to lose more than your initial investment, and you should only trade with money you can afford to lose.
Market Risks and Volatility:
Forex markets are influenced by global economic, political, and social events, which can result in unpredictable price movements. High market volatility can lead to sudden and substantial changes in currency values, potentially causing losses that exceed your initial deposit.
Leverage Risks:
Leverage amplifies both potential gains and potential losses. While leverage can increase profitability, it also increases the risk of significant losses, including the loss of your entire trading capital.
Trading Tools and Technology Risks:
Forex trading platforms, including those offered by brokers, are subject to technology risks such as system failures, latency issues, and potential errors in price feeds. Traders should be aware that these risks can impact the execution of trades and trading outcomes.
No Guarantee of Profitability:
Past performance in Forex trading is not indicative of future results. There is no guarantee that you will achieve profits or avoid losses when trading Forex. Market conditions and individual trading strategies vary, and no trading system can eliminate the inherent risks of Forex trading.
Educational Purposes Only:
Any information provided about Forex trading, including strategies, analysis, or market commentary, is for educational purposes only and should not be considered financial advice. Consult a qualified financial advisor or tax professional before making any trading decisions.
Regulatory Compliance:
Forex trading is regulated differently in various jurisdictions. Ensure that you are trading with a licensed and compliant broker in your country of residence.
Responsibility:
You are solely responsible for your trading decisions and the associated risks. It is your duty to understand the terms and conditions of Forex trading, including margin requirements, stop-losses, and other risk management tools.
Acknowledgment:
By engaging in Forex trading, you acknowledge that you have read, understood, and accepted this disclosure statement. You accept full responsibility for the outcomes of your trading decisions and agree to trade at your own risk.
This disclosure provides an overview of the risks associated with Forex trading and is not exhaustive. For additional information, consult your broker and other reliable financial resources.