
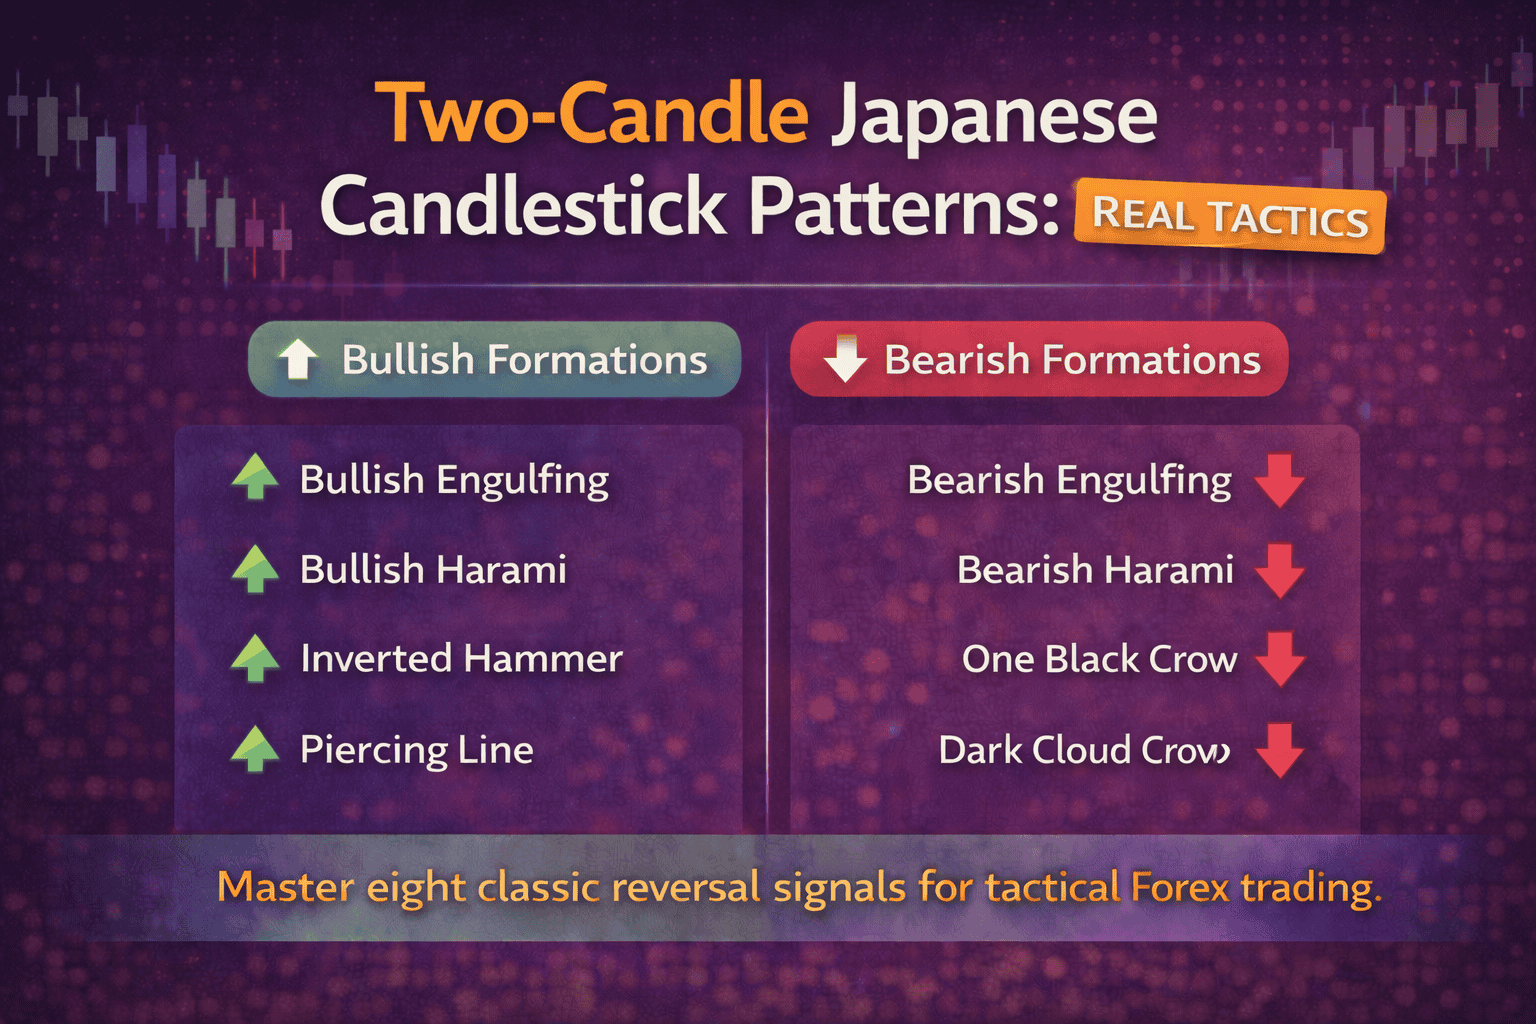
Two-candle Japanese Candlestick patterns give traders a clearer view of market sentiment than single-candle signals.
By studying the interaction between two consecutive candles, you can identify potential reversals with greater accuracy and improve your timing on entries and exits.
This guide breaks down eight high-value two-candle patterns, how they work, how to confirm them, and how to avoid common mistakes.
You will also learn how to combine these patterns with Momentum, Chart Patterns, and Support/Resistance for maximum effectiveness.
TL;DR (Quick Summary)
- Two-candle patterns are more reliable at revealing reversals than single-candle patterns.
- Focus on the strongest patterns: Engulfing, Harami, Piercing Line, One White Soldier, Dark Cloud Cover, and One Black Crow.
- Combine candlesticks with Support/Resistance, Momentum (RSI/TSI), and Chart Patterns for confirmation.
- Avoid relying on candlesticks alone—context and confluence drive success.
Table of Contents
- TL;DR (Quick Summary)
- What Are Two-Candle Japanese Candlestick Patterns?
- Anatomy of a Two-Candle Pattern
- Bullish Candlestick Patterns to Focus On
- Bullish Patterns Table
- Which Bearish Candlestick Patterns Should You Focus On?
- Bearish Candlestick Patterns to Focus On
- Complementary Signals for Stronger Accuracy
- Common Mistakes Traders Make
- Quiz: Test Your Knowledge
- 1. What makes two-candle candlestick patterns more reliable than single-candle patterns?
- 2. Which two-candle pattern signals a strong Bearish reversal?
- 3. Which complementary tool is most helpful in confirming a candlestick reversal at a major price level?
- 4. What is a common mistake traders make when using two-candle patterns?
- 5. Which Momentum indicator is highlighted as a strong companion to two-candle patterns?
- Answer Key
- Conclusion
- Forex Trading Disclosure Statement
What Are Two-Candle Japanese Candlestick Patterns?
Two-candle patterns help forecast reversals by showing a shift in control between buyers and sellers.
Examples include:
- Bullish Engulfing
- Bearish Engulfing
- Bullish Harami
- Bearish Harami
- Piercing Line
- Dark Cloud Cover
- One White Soldier
- One Black Crow
These patterns work on all timeframes but require confirmation from structure and momentum to avoid false signals.
Anatomy of a Two-Candle Pattern
Before analyzing two-candle reversals, understand what makes them unique. They require:
- A candle showing the existing direction
- A second candle showing a shift in control
- A relationship between candle bodies (engulfing, inside, closing above/below midpoint)
They are stronger when aligned with:
| Component | Why It Matters |
| Support & Resistance | Increases the probability of a meaningful reversal |
| Momentum (RSI/TSI) | Confirms energy behind the reversal |
| Chart Patterns | Provides structural confirmation (Double Bottoms, Rising Wedges, etc.) |
Bullish Candlestick Patterns to Focus On
Bullish candlestick patterns signal a potential reversal of a selloff, indicating buying pressure and optimism in a Forex pair.
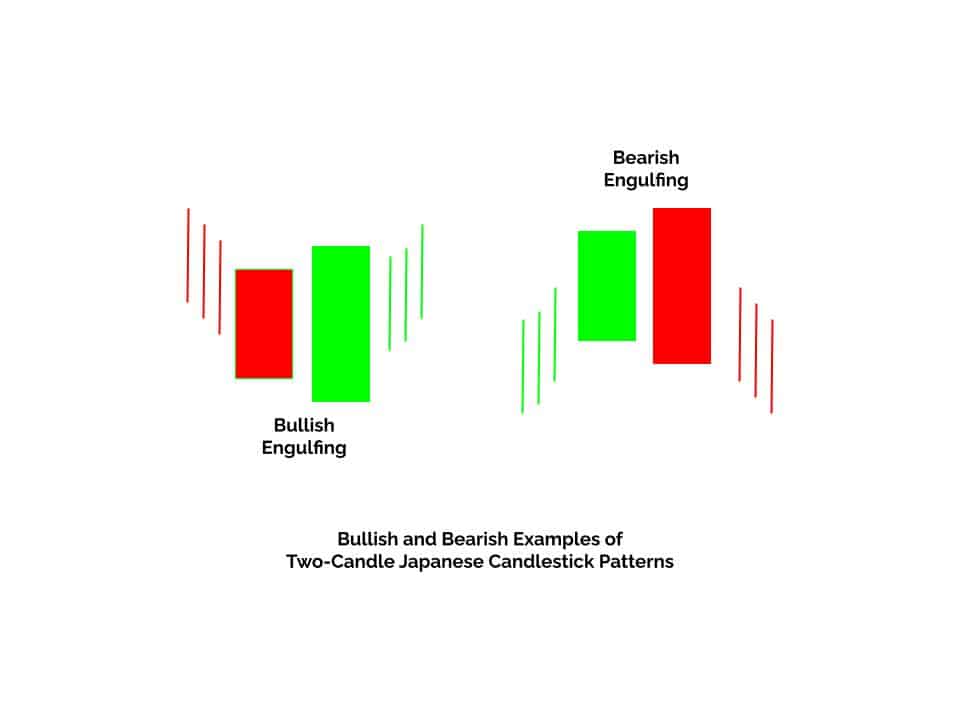
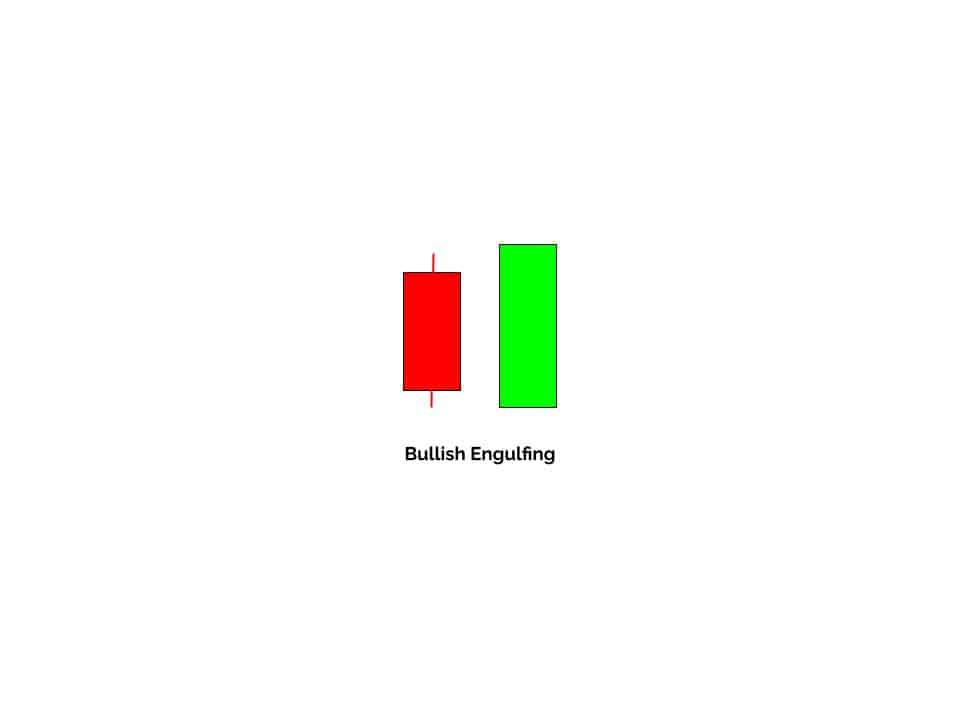
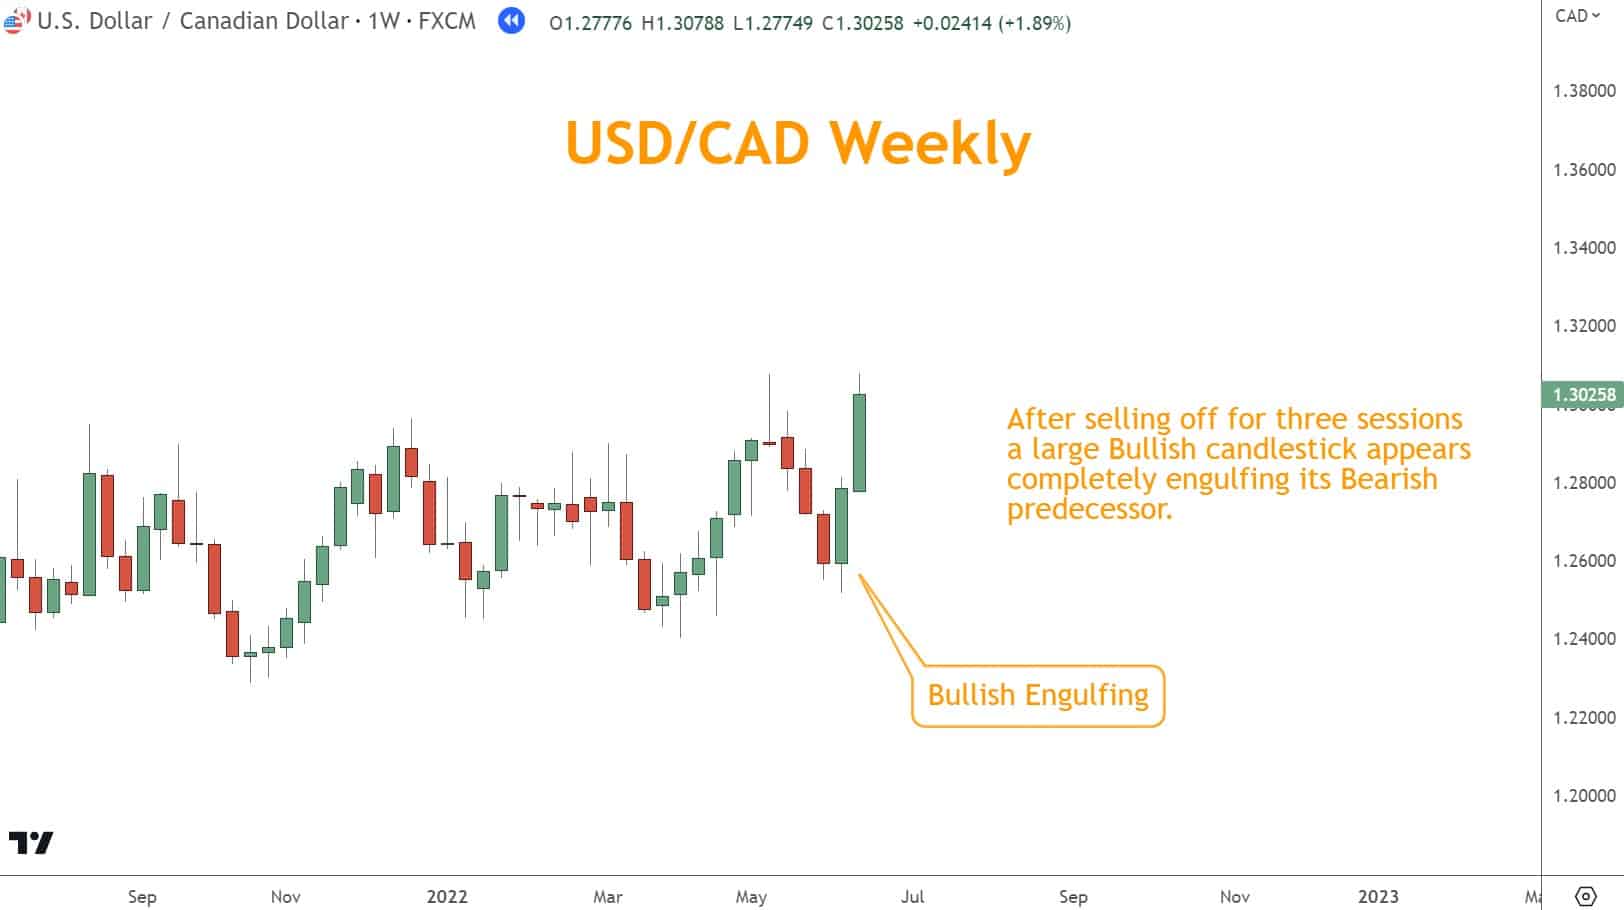
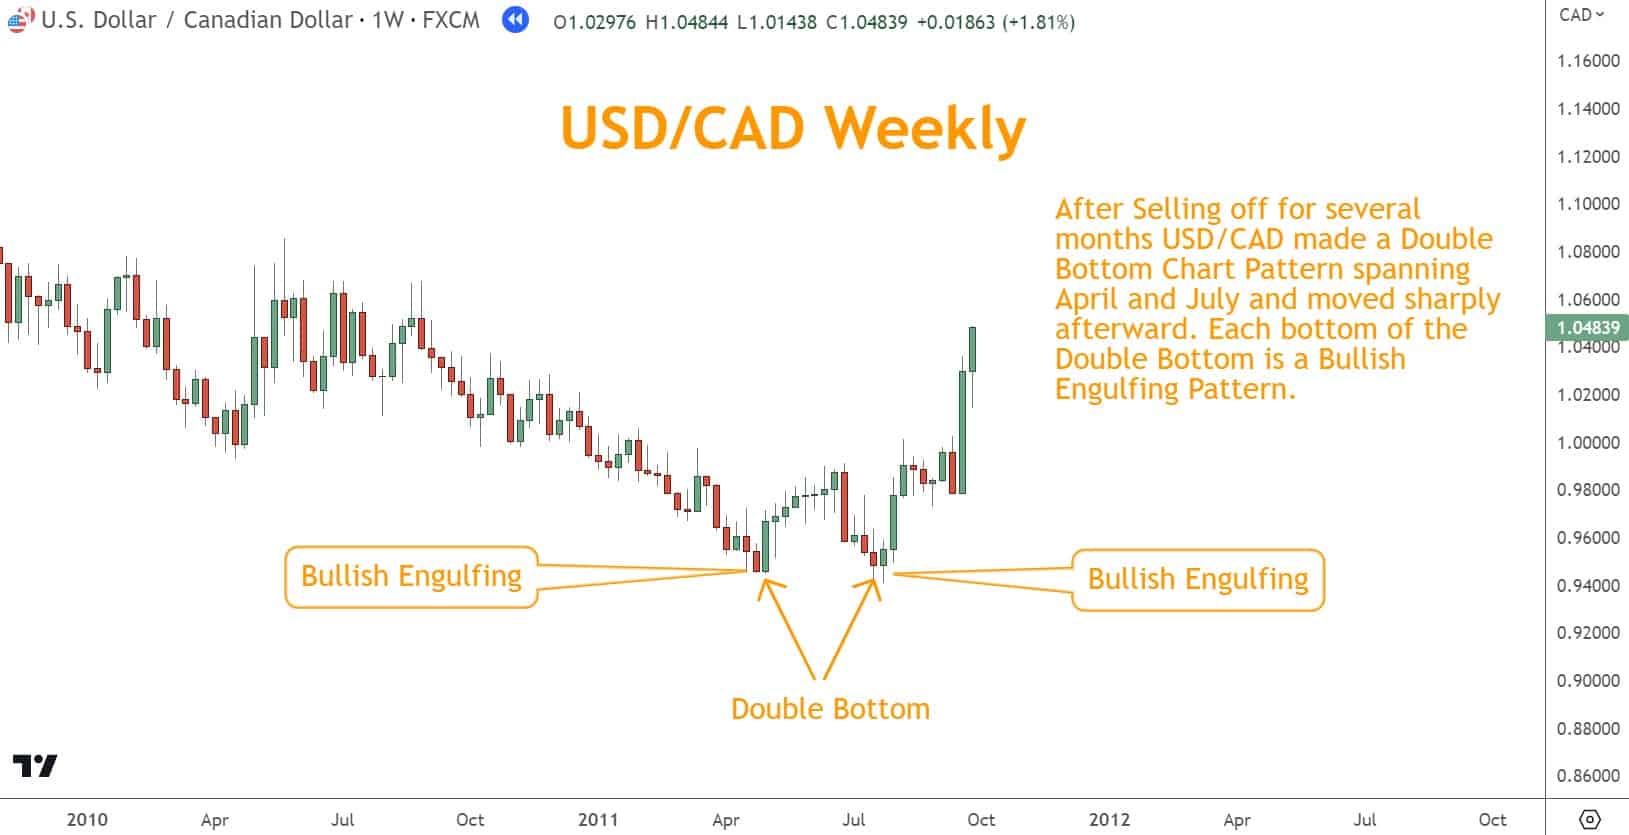
Bullish Engulfing
You can identify potential reversals with the Bullish Engulfing pattern. This signal forms when a small red candlestick is followed by a more sizeable green candlestick that engulfs the previous one.
Engulfing means opening lower and closing higher than the previous candle.
Buyers take control of the market and push prices higher after this setup. This pattern is found at selloff bottoms since it indicates a Bullish reversal.
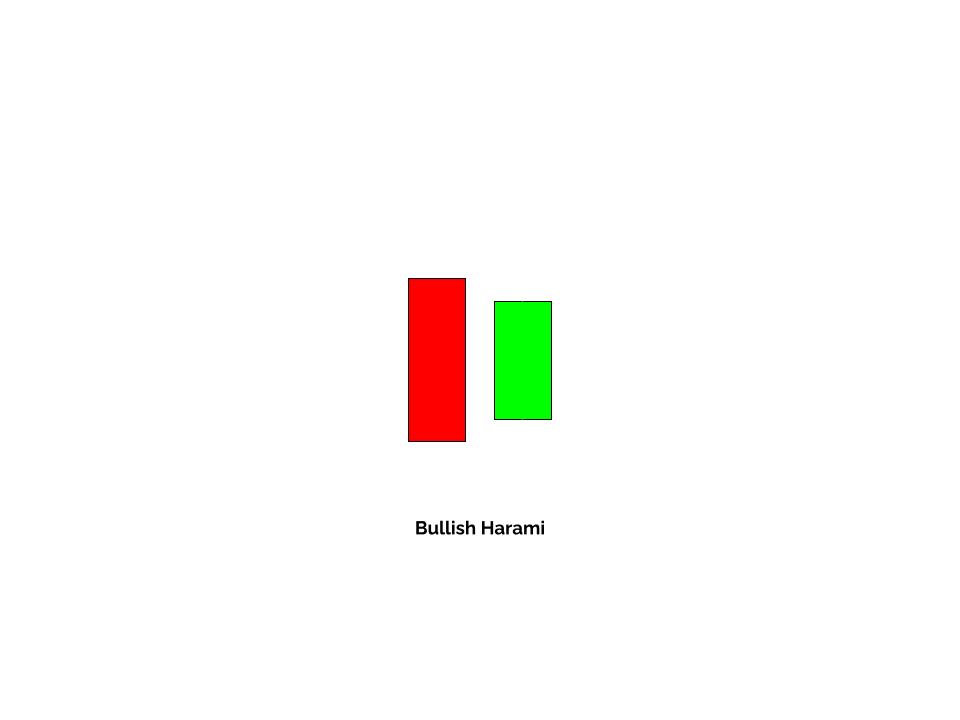
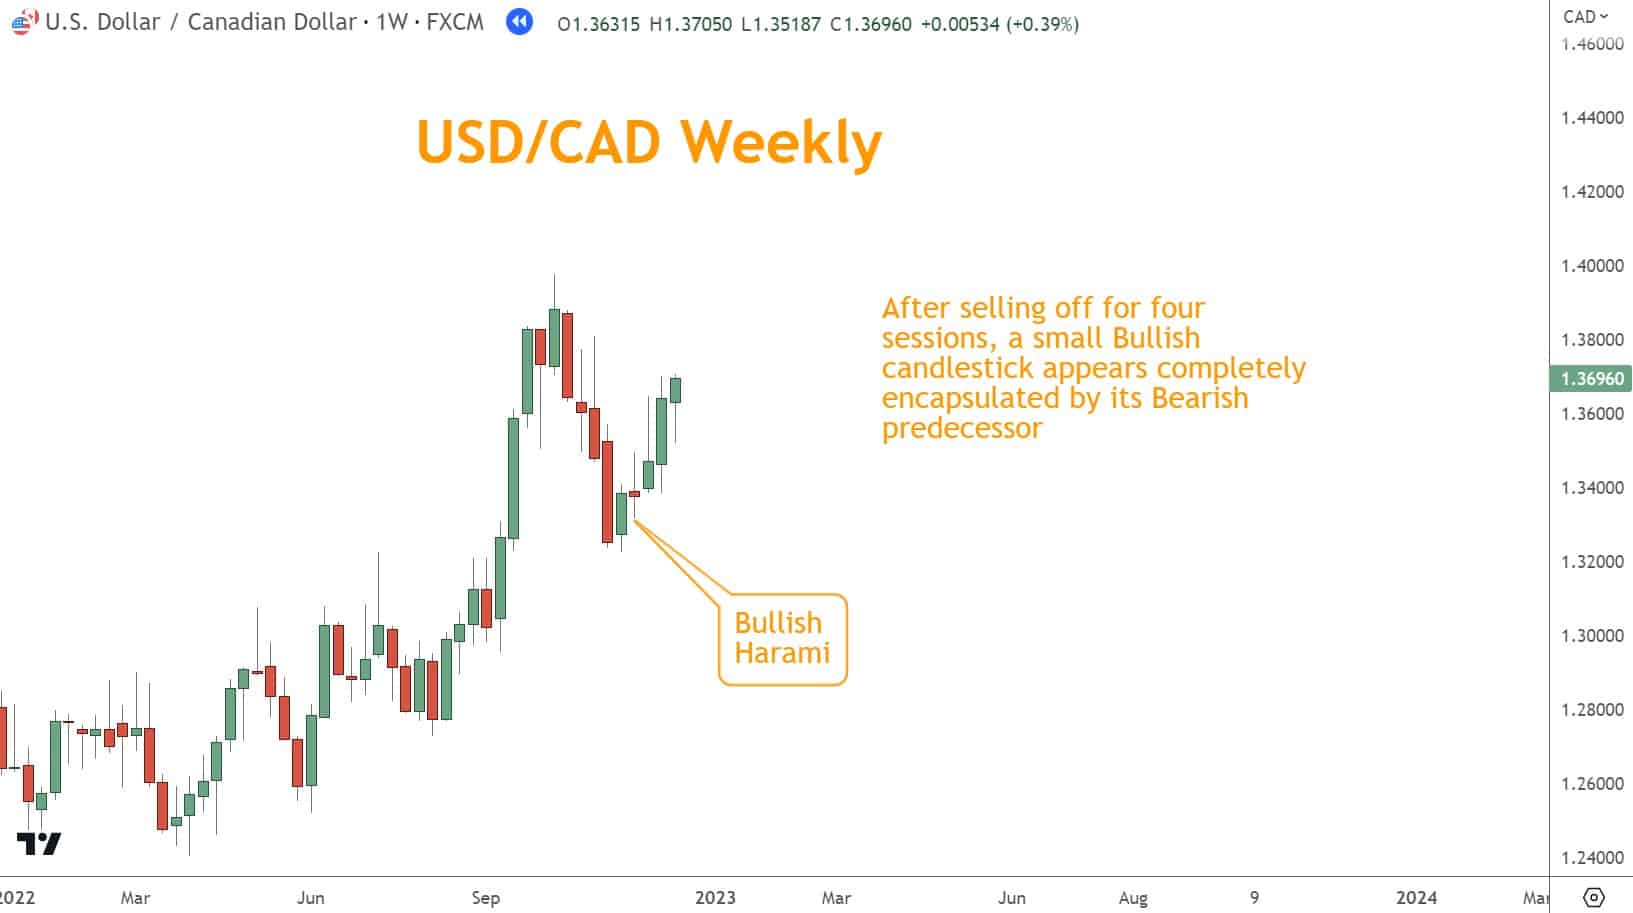
Bullish Harami
A Bullish Harami indicates a potential reversal in a downtrend. The first candlestick of this pattern is usually bearish and can have a considerable body.
On the other hand, the second candlestick of this pattern is smaller and opens higher and closes lower than the first candle.
This pattern suggests that selling pressure may decrease while buying pressure may increase, leading to a potential price reversal at the bottom of a downtrend.
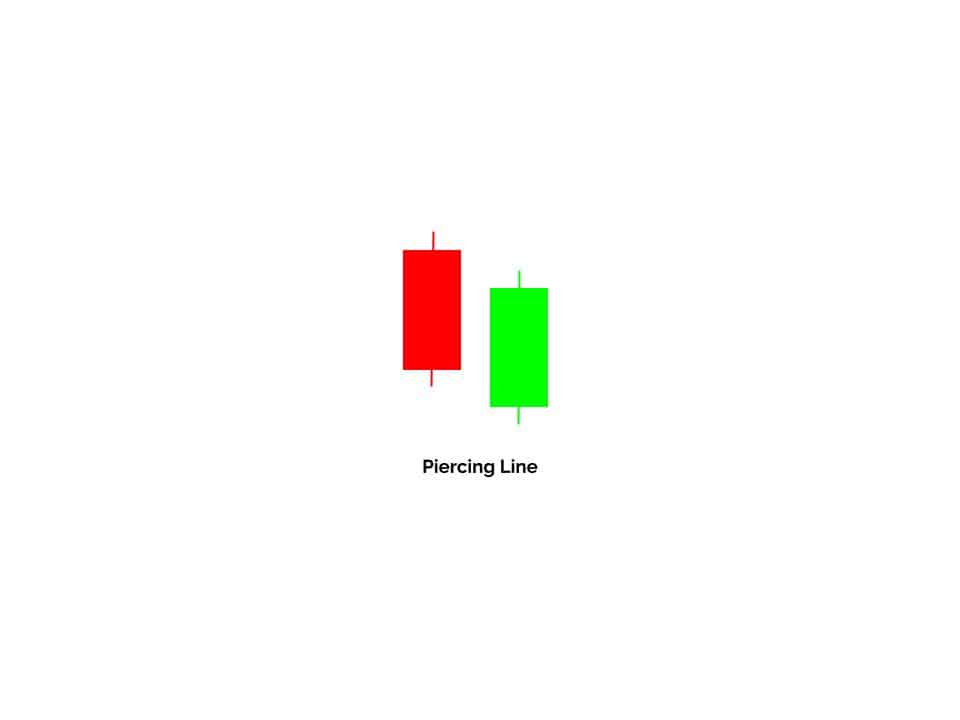
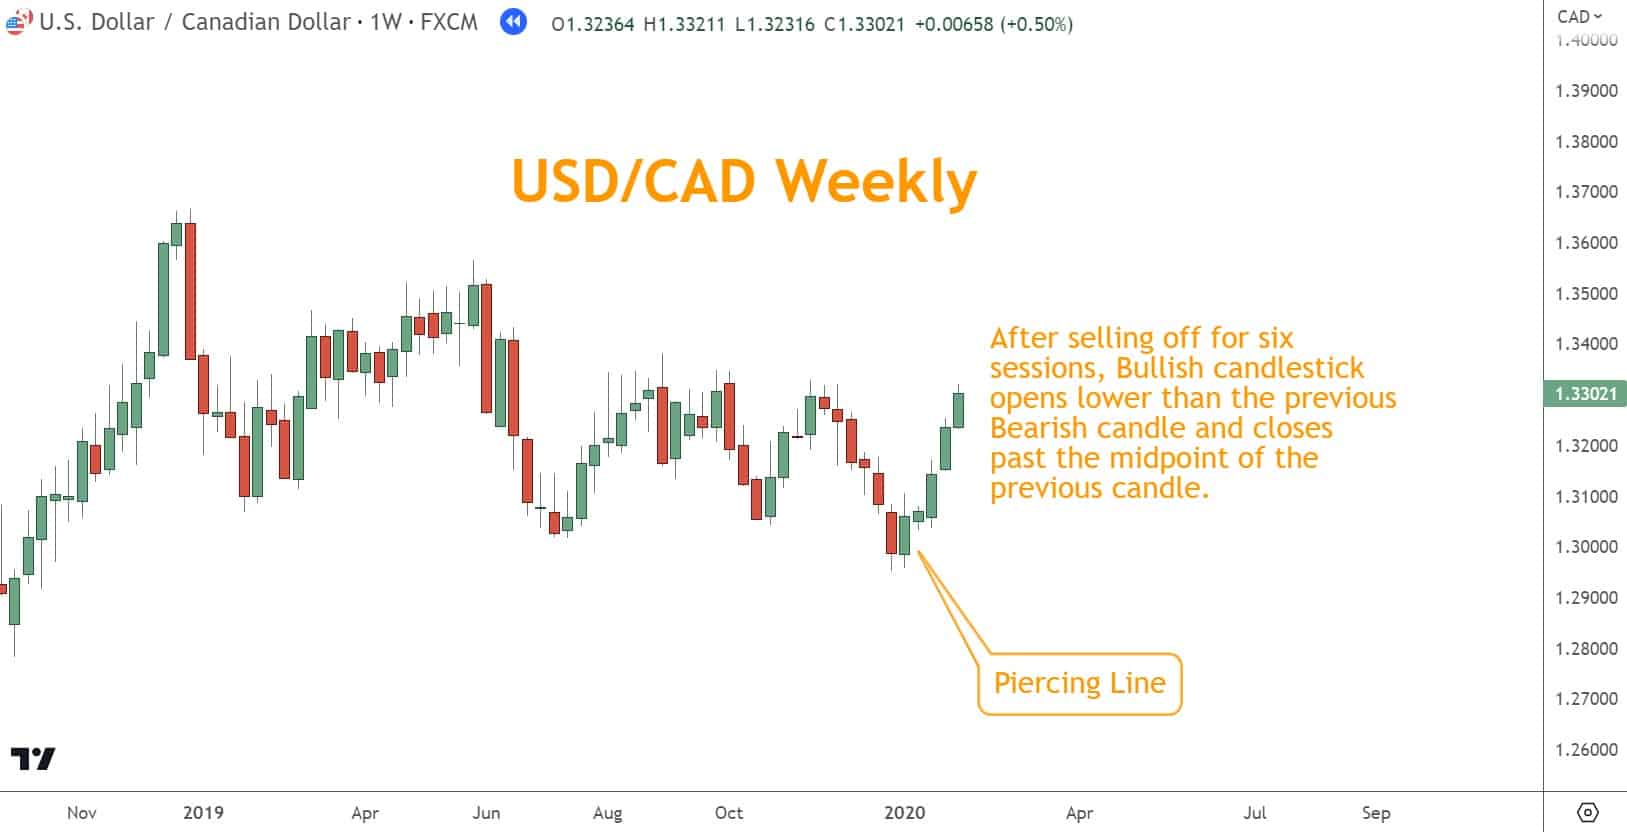
Piercing Line
A Piercing Line is a bullish candlestick Pattern comprising two candles – a bearish candle followed by a bullish one that opens lower. Still, it closes above the midpoint of the bearish candle.
It signals a reversal as buying pressure overcomes the initial selling pressure.
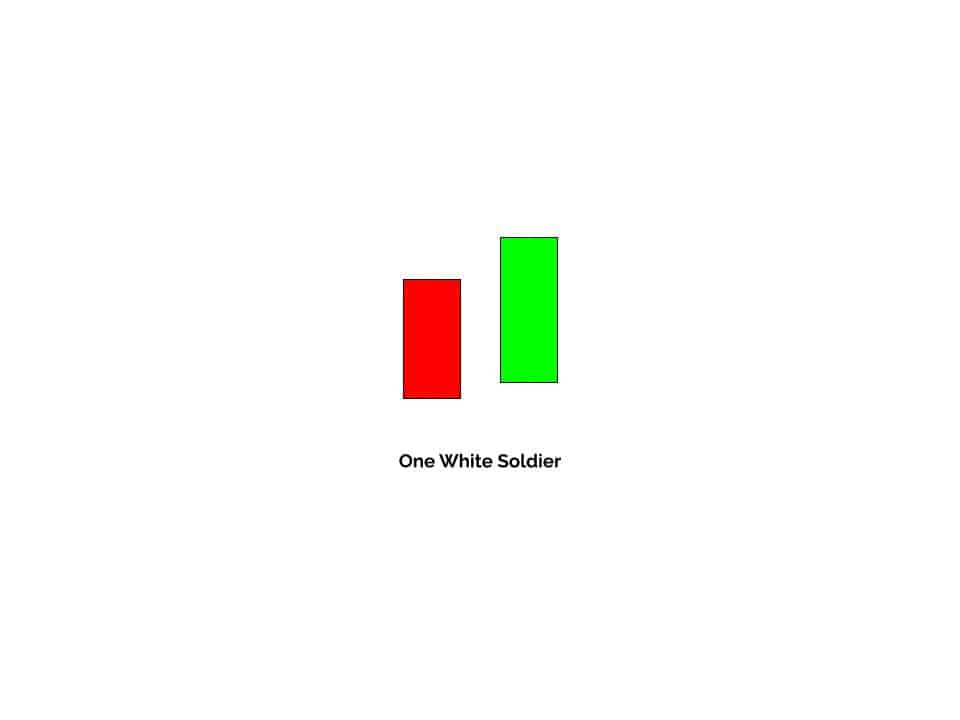
One White Soldier
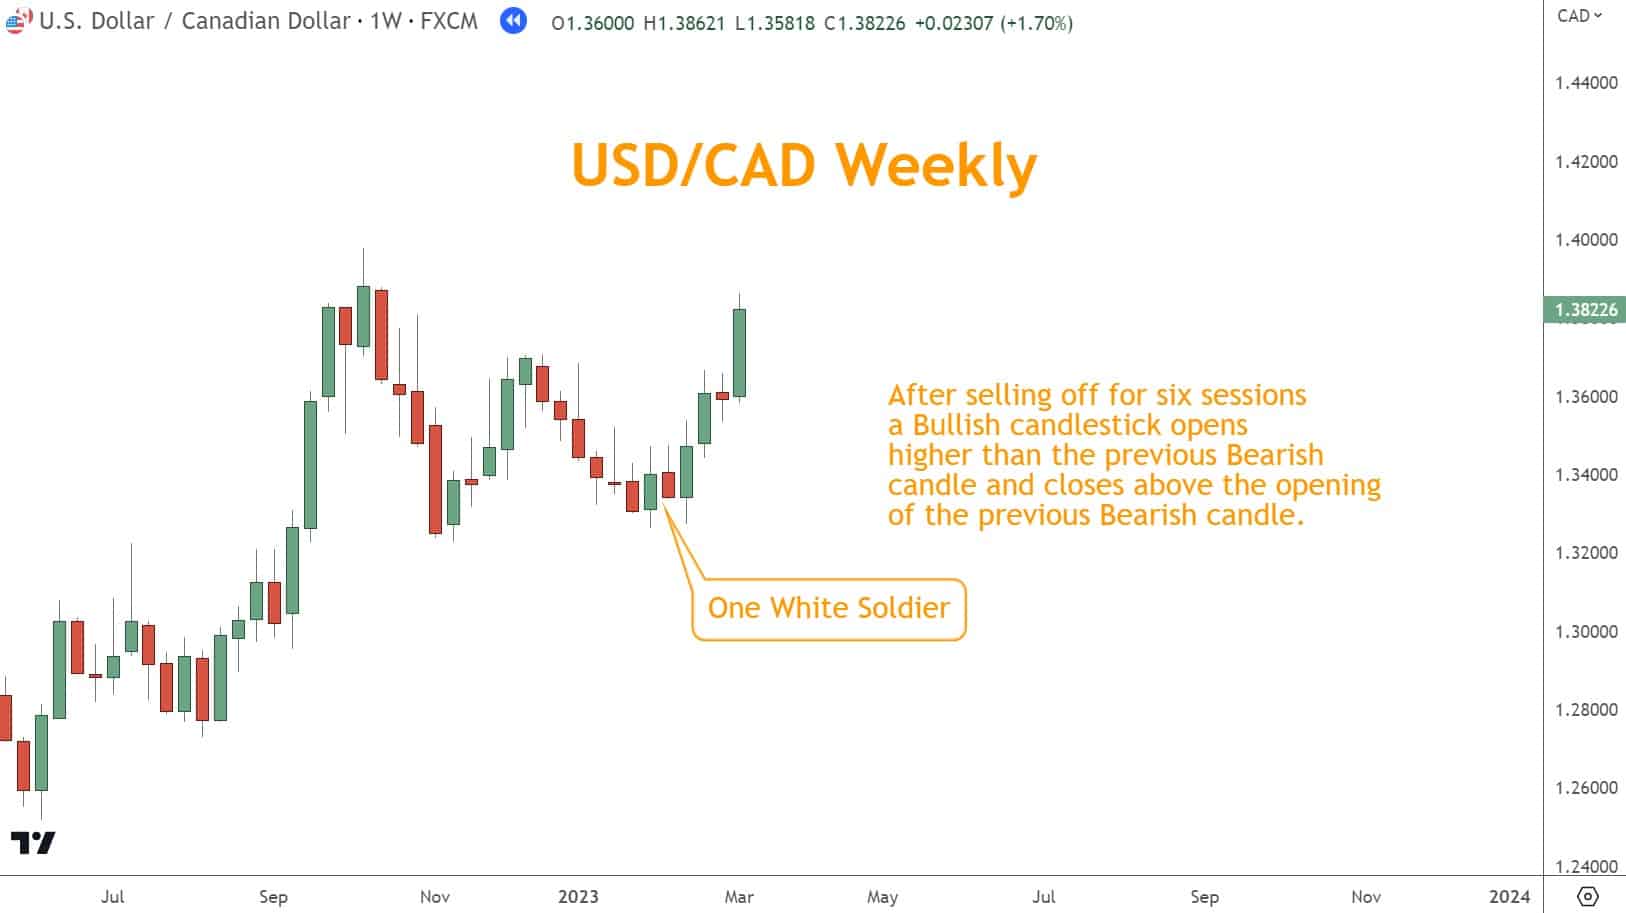
One White Soldier is a powerful bullish reversal pattern consisting of two candles that appear at the bottom of a downtrend.
The first candle has a long body and represents selling pressure. The second candle opens above the previous day’s closing price and rallies to close above it.
Here is a structured table outlining the most reliable bullish two-candle reversals.
Bullish Patterns Table
| Pattern | Structure | Signals | Ideal Location | Confirmation Tools |
| Bullish Engulfing | Large green candle fully engulfs the prior red candle | Substantial shift from selling to buying pressure | Bottom of a Selloff | Momentum (RSI/TSI), Support levels, Divergence |
| Bullish Harami | Large red candle followed by a smaller green candle inside its body | Selling pressure weakening; early bullish reversal | Bottoms of downtrends or consolidations | Support, Momentum neutrality, Candlestick confirmation |
| Piercing Line | Bearish candle followed by bullish candle closing above the midpoint of the previous candle | Buyers aggressively reclaim control | Oversold areas near major Support | RSI Oversold, TSI crossover |
| One White Soldier | Small or large bearish candle followed by a strong bullish candle opening higher and closing near its high | Strong, sustained bullish reversal | End of extended Selloff | Break of structure, Support, Momentum increasing |
Looking for a Strategy?
Download the Six Basics of Chart Analysis and sign up for Forex Forecast to learn a bottom-up approach to analyzing Forex markets and weekly market updates.
Which Bearish Candlestick Patterns Should You Focus On?
Bearish Candlestick Patterns are potent tools for identifying potential reversals at the end of a rally.
These patterns reflect the trader’s psychology in their formation. A few bearish reversal patterns include Bearish Engulfing, Bearish Harami, Dark Cloud Cover, and One Black Crow.
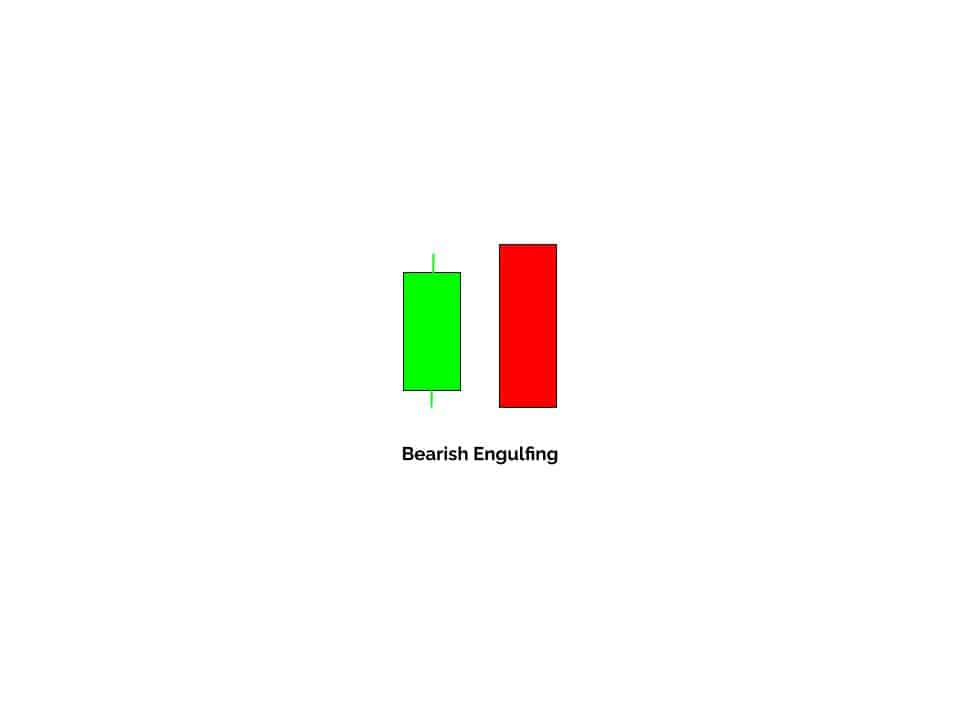
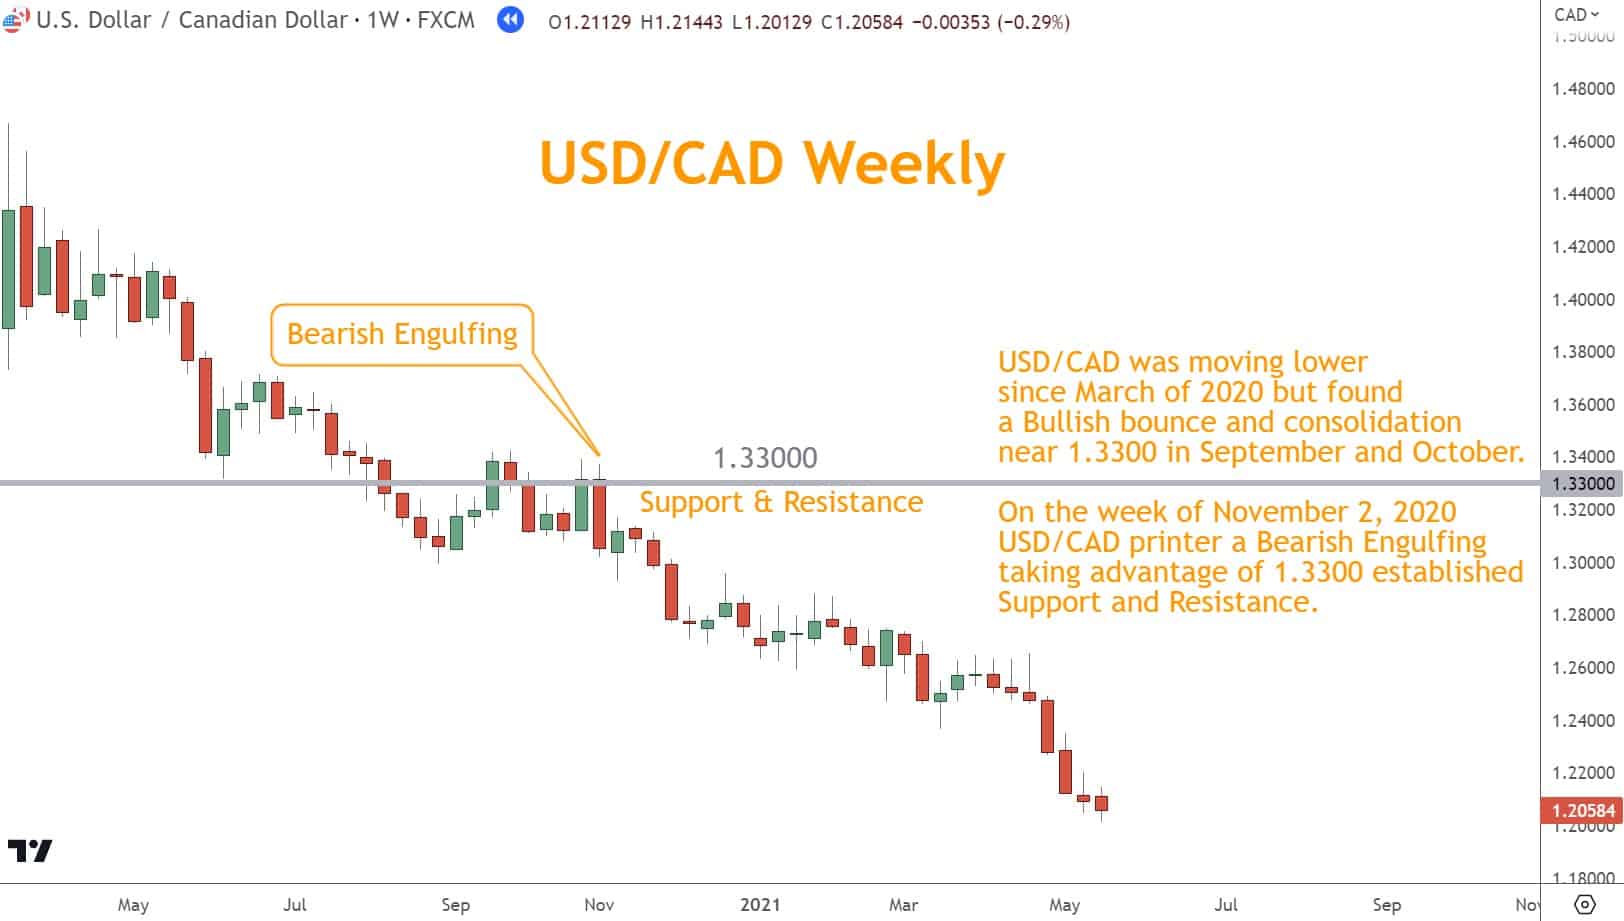
Bearish Engulfing
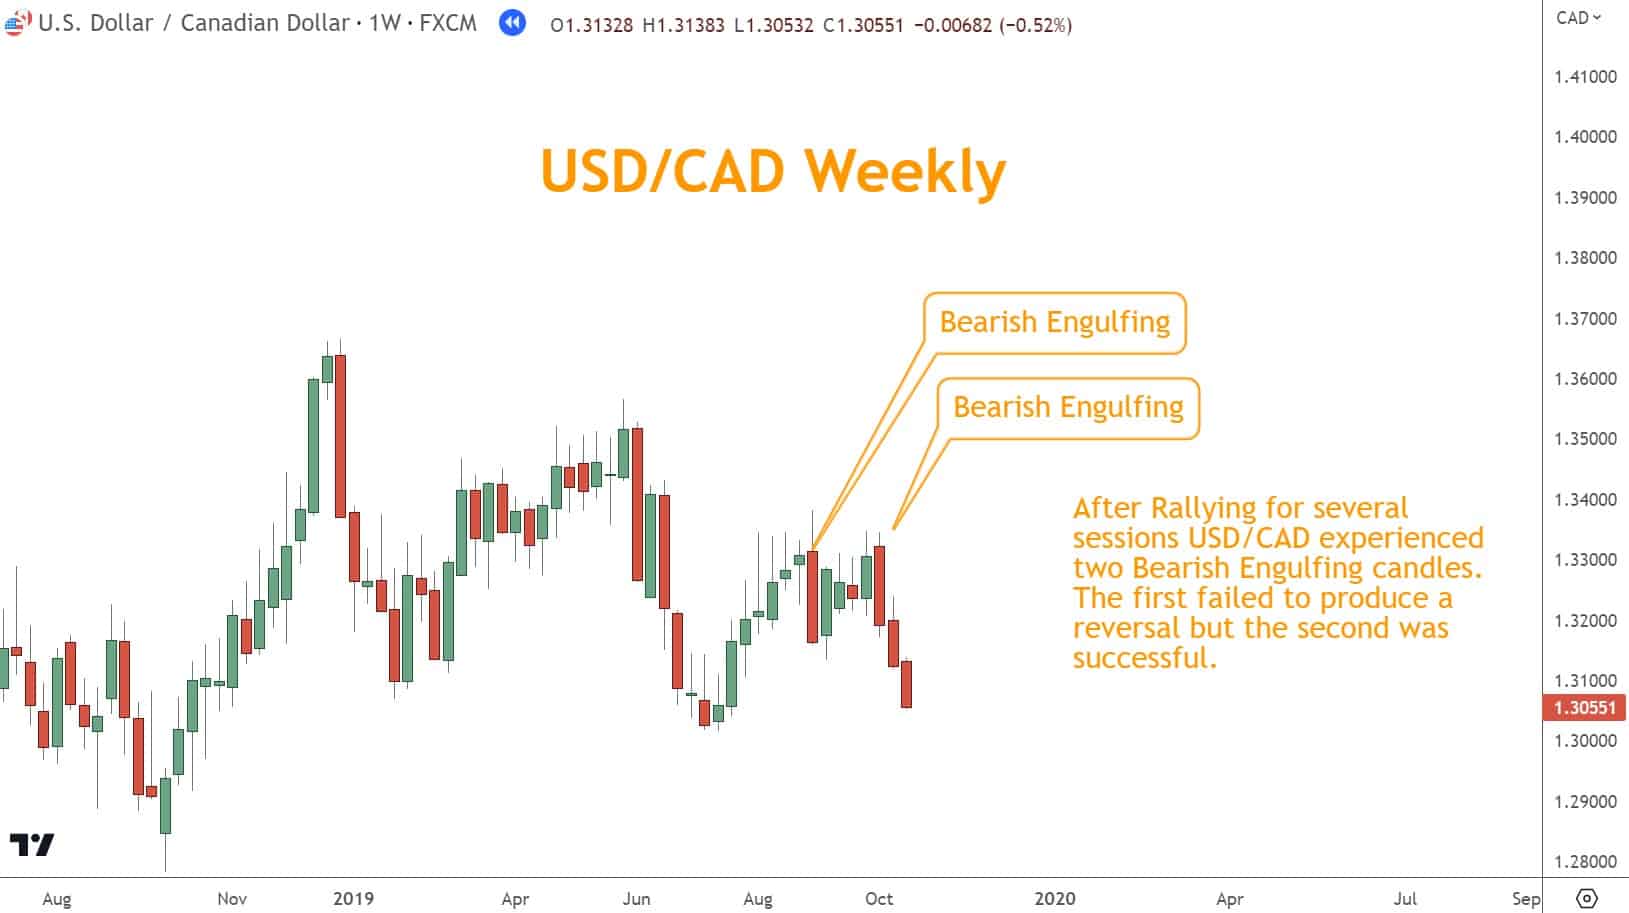
The Bearish Engulfing pattern is a two-candlestick reversal pattern you can use to signal the end of an uptrend.
A small bullish candle is at the end of a rally, followed by a sizeable bearish candlestick engulfing the last green candle.
This price action implies that selling pressure has taken over, and prices could fall.
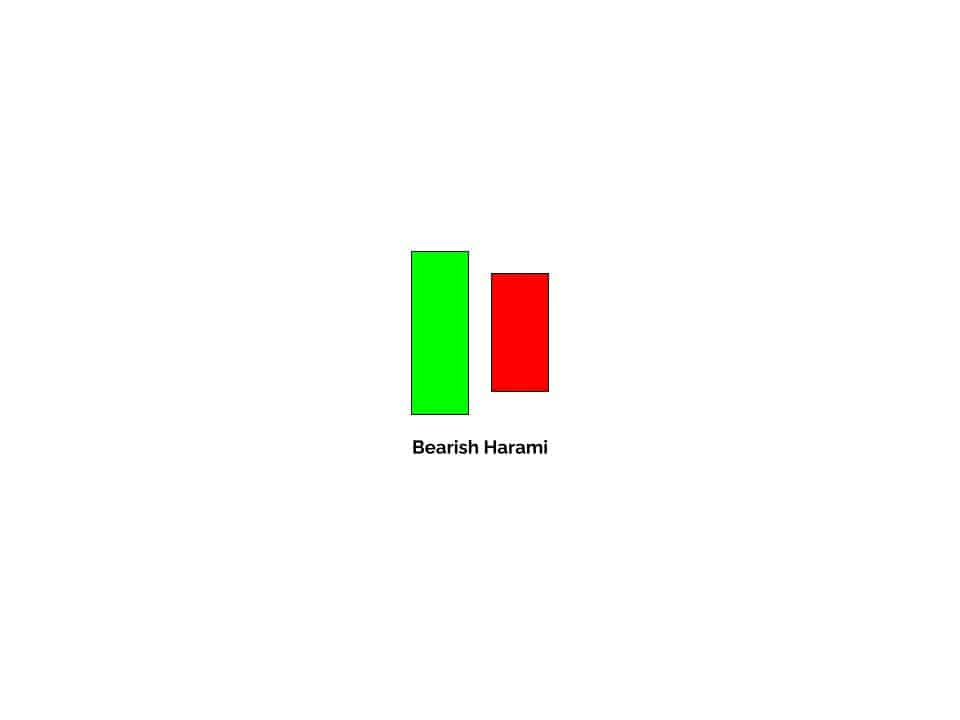
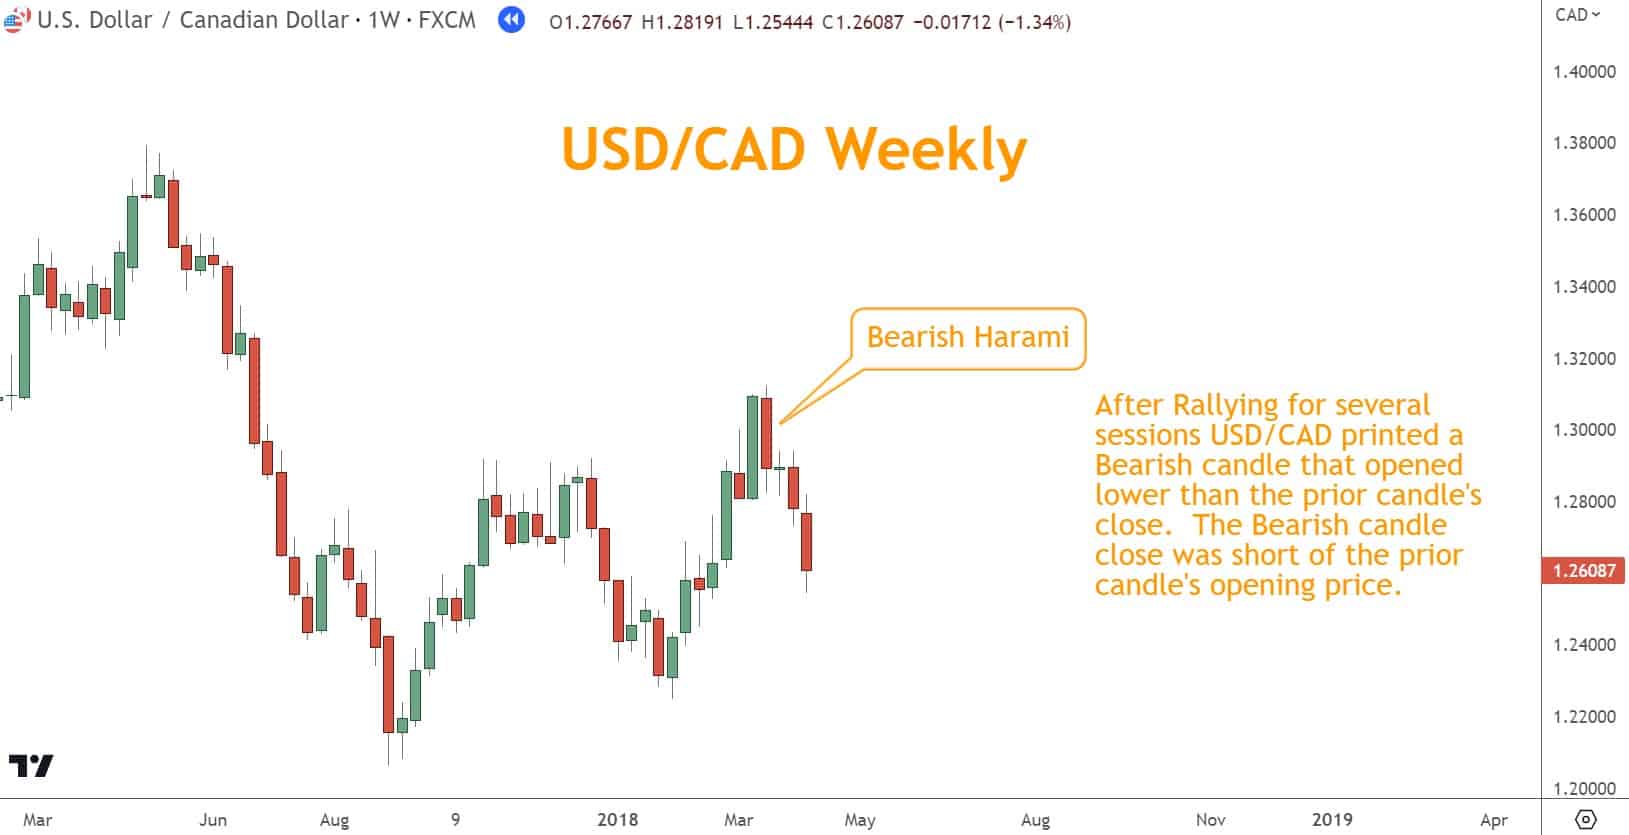
Bearish Harami
The Bearish Harami is a useful two-candlestick pattern to help you identify potential reversals.
This candlestick pattern occurs when the first candlestick is larger and bullish, while the second, smaller candlestick is bearish.
A Bearish Harami indicates that buying has slowed and prices may decline.
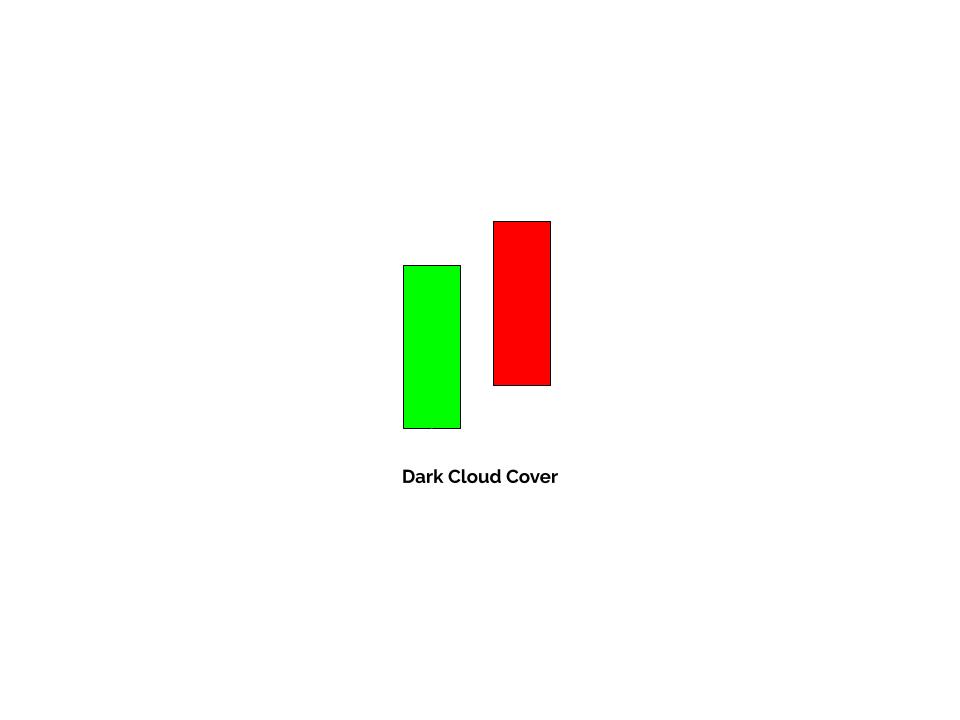
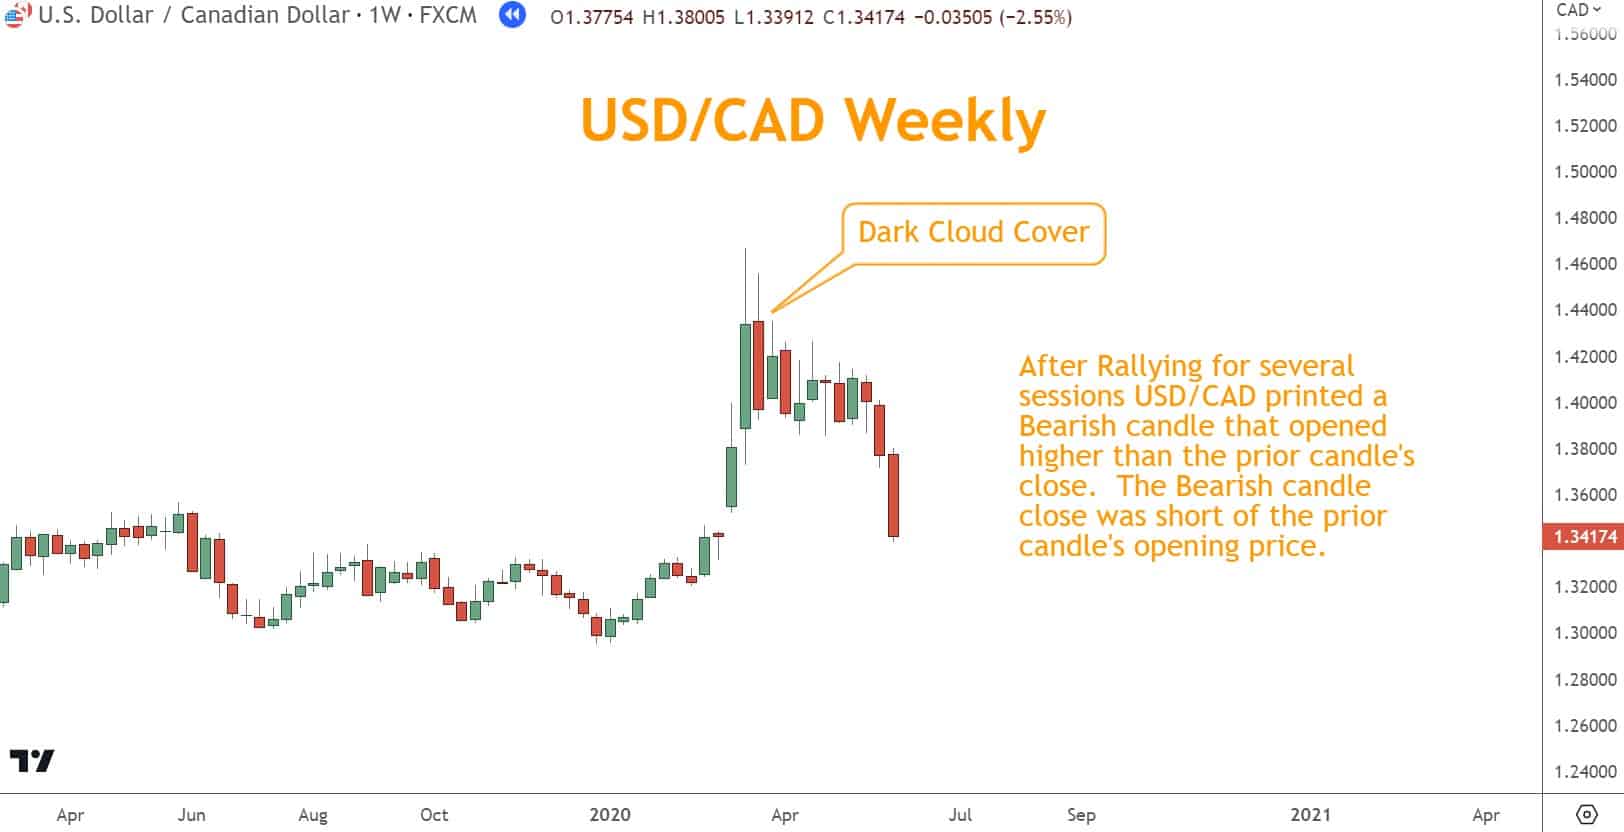
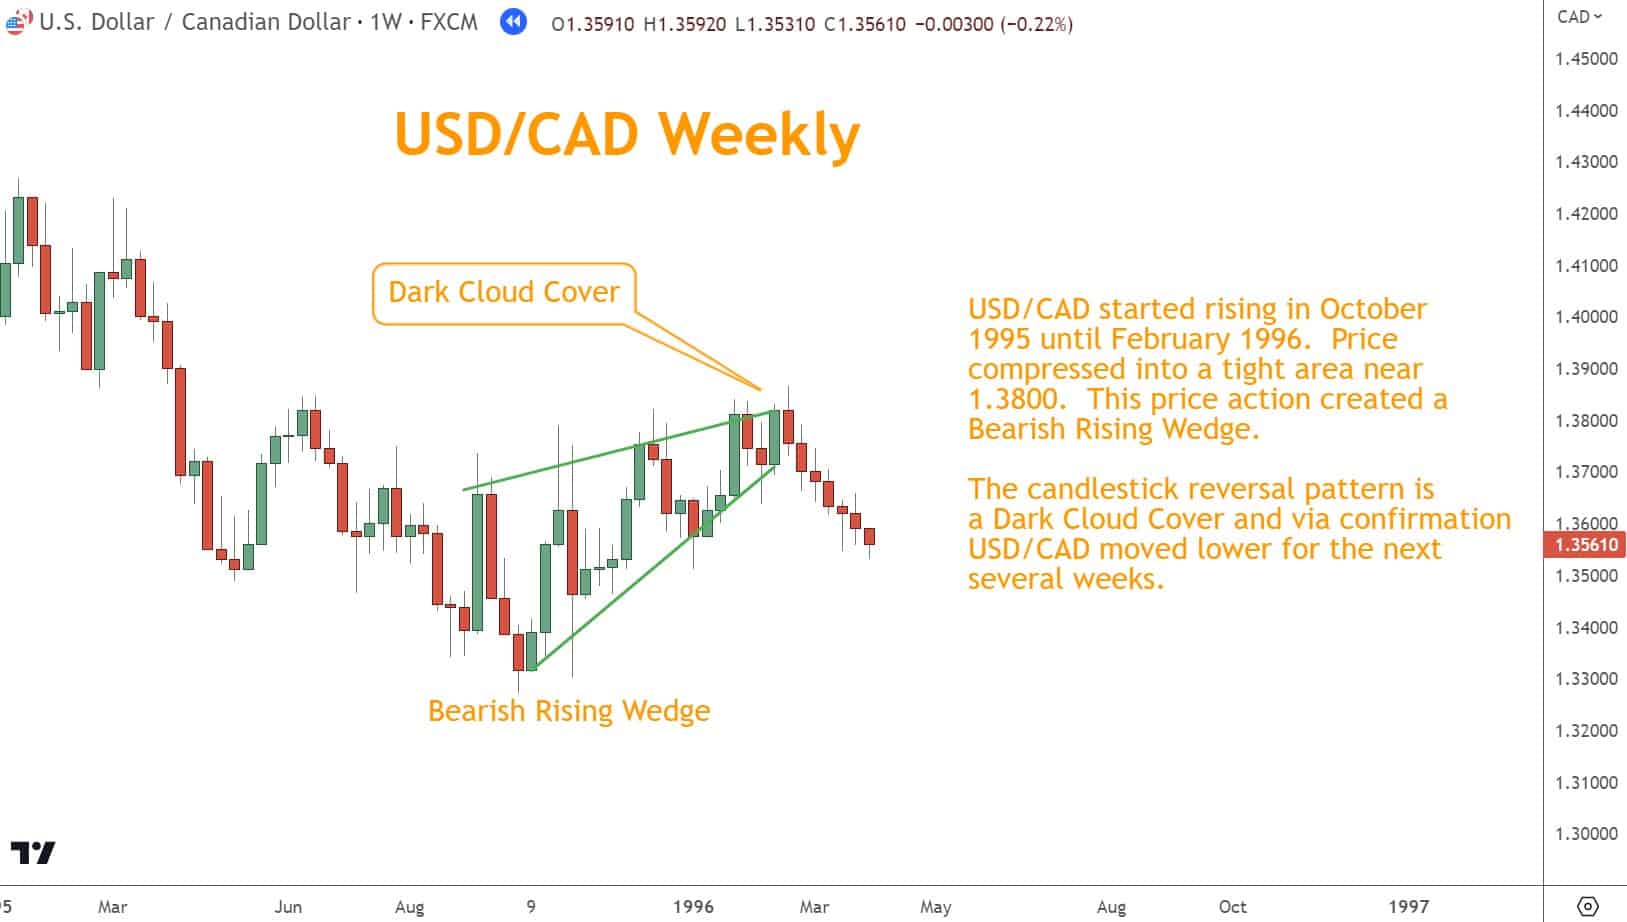
Dark Cloud Cover
The Dark Cloud Cover pattern is a bearish reversal pattern found in Japanese Candlestick patterns.
The pattern forms with two candles, where the first is bullish and the second is bearish.
The opening price of the second candlestick must be above the high of the previous day’s bullish candle while closing below its midpoint.
This indicates a shift in market sentiment, with buyers losing control to sellers who might soon dominate trading activity.
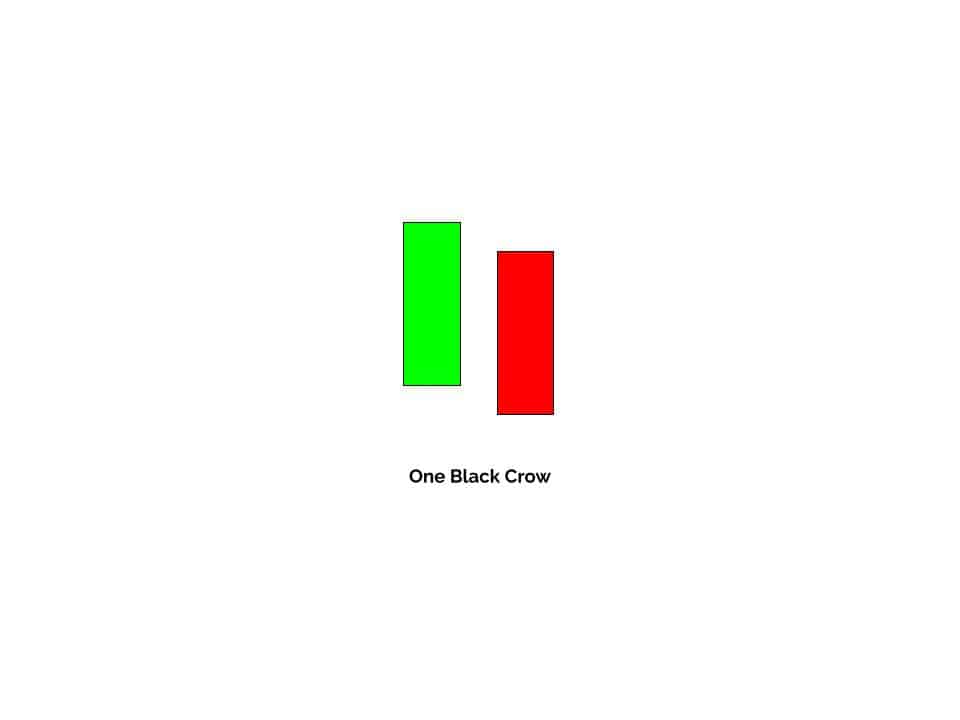
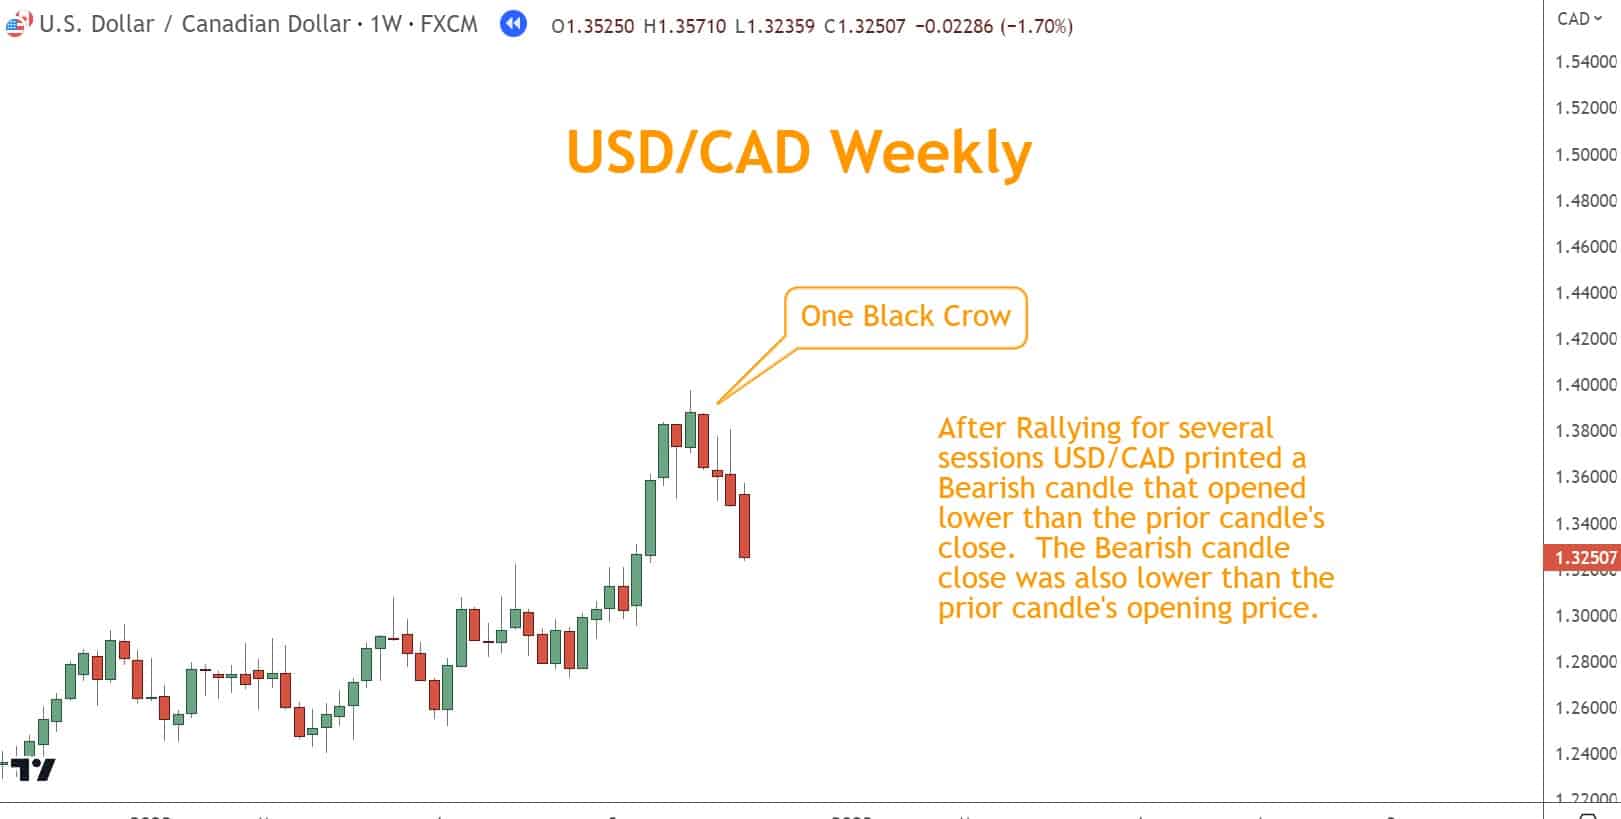
One Black Crow
The One Black Crow is a two-candlestick pattern that shows a potential reversal in an uptrend.
The first candlestick is bullish, followed by a long bearish candle with a lower open and close.
This pattern suggests that buyers are losing control as selling pressure increases, indicating a possible price decline.
Bearish Candlestick Patterns to Focus On
Below is the structured table for bearish two-candle reversals.
Bearish Patterns Table
| Pattern | Structure | Signals | Ideal Location | Confirmation Tools |
| Bearish Engulfing | Large red candle fully engulfs the prior green candle | Substantial shift from buyers to sellers | Top of a Rally/resistance zone | RSI Overbought, TSI bearish crossover |
| Bearish Harami | Large green candle followed by a smaller red candle inside its real body | Buyer exhaustion; early bearish reversal | Extended Rallies, weak resistance breaks | Resistance levels, Momentum slowing |
| Dark Cloud Cover | Bullish candle followed by bearish candle opening above prior high and closing below midpoint | Substantial bearish shift in sentiment | Overbought zones, primary Resistance | Rejection wicks, RSI divergence |
| One Black Crow | Bullish candle followed by a long bearish candle with a lower open and close | Sellers overwhelming buyers; trend change | Tops of strong Rallies | Overbought conditions, structure breaks |
Complementary Signals for Stronger Accuracy
Momentum Indicators
To confirm reversals in two-candle Japanese Candlestick patterns, we can use momentum indicators such as RSI and TSI.
These indicators work well with Candlestick Patterns to provide a more detailed market insight.
The RSI, or Relative Strength Index, is a commonly used momentum indicator that can identify changes in Momentum and overbought and oversold conditions.
Meanwhile, the TSI (True Strength Index) is another momentum indicator that identifies the energy in an instrument’s price action.
When used with two-candle Japanese Candlestick patterns, these indicators can give you a more accurate reading of market trends and potential reversals.
| Indicator | Benefit |
| RSI | Reveals overbought/oversold areas and divergence |
| TSI | Shows momentum shifts more sensitively |
| Stochastic | Helps confirm turning points |
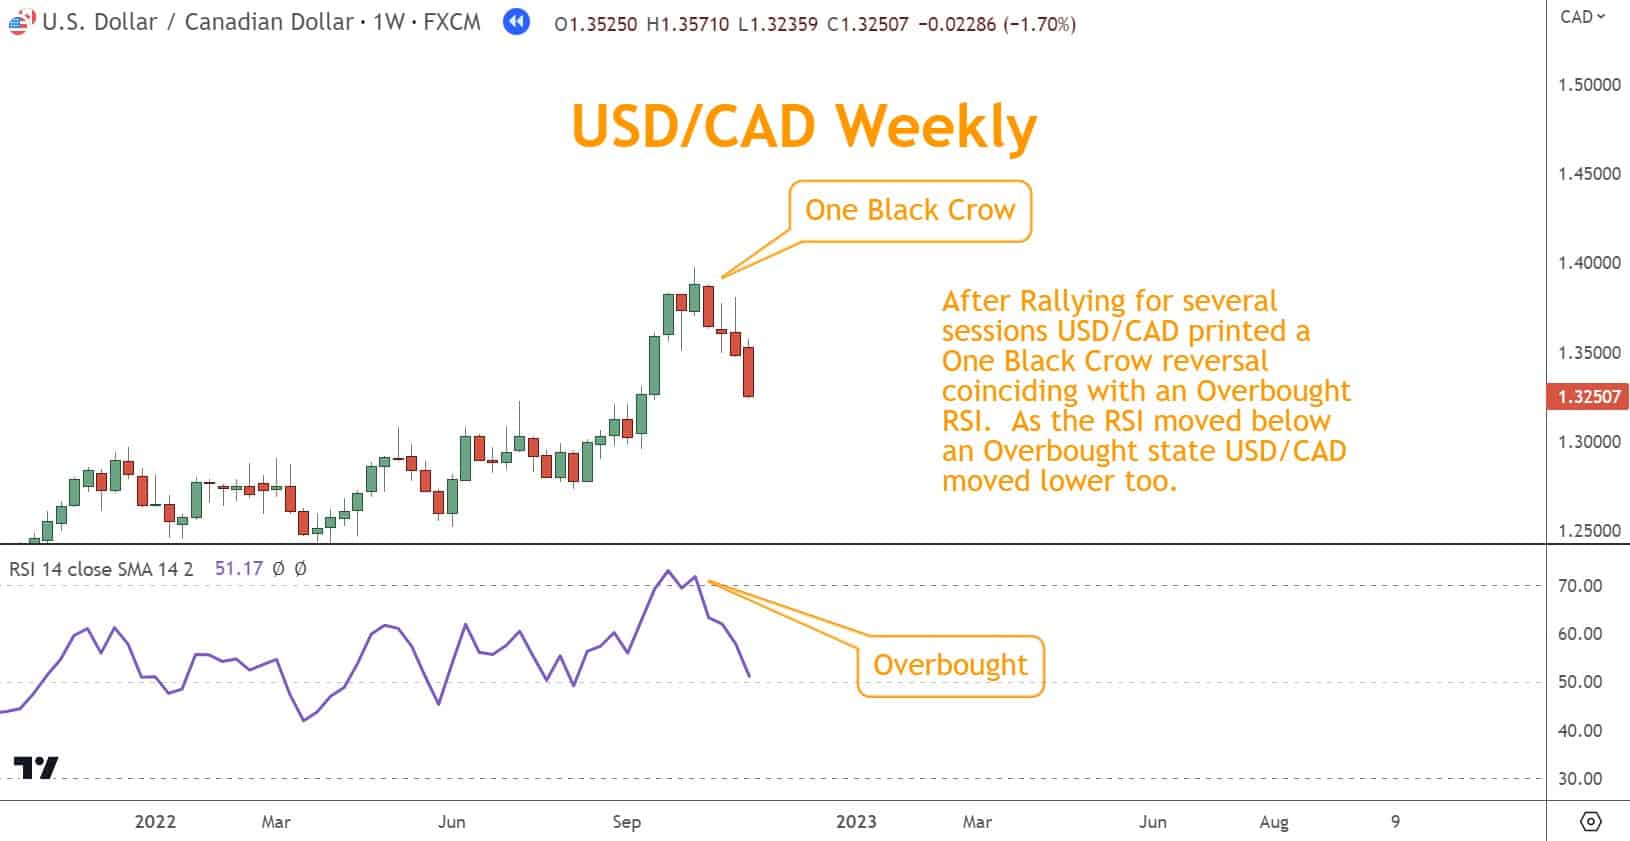
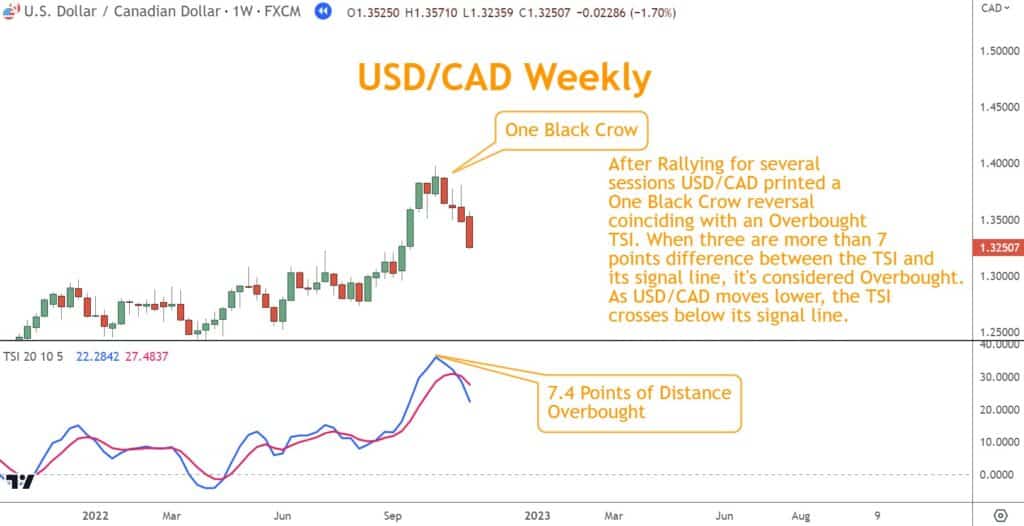
Chart Patterns
Using complementary signals, such as Chart Patterns, in conjunction with Candlestick Patterns, can improve the accuracy of your Forex trading.
The Rising Wedge depicts bearish sentiment forming during a rally, while a Double Bottom signals a bullish reversal at the bottom of a selloff.
| Pattern | How It Helps |
| Rising Wedge | Confirms bearish exhaustion |
| Double Bottom | Confirms bullish reversal |
Support & Resistance
Additional confirmation of a candlestick pattern’s accuracy can be obtained by analyzing horizontal Support and Resistance levels.
If a candlestick pattern forms at or near such levels, it may suggest a potential solid reversal and confirm its validity.
Using this methodology provides valuable insights into market trends for traders who want to stay ahead.
| Use Case | Why It Matters |
| Reversals forming at major levels | Strongest confirmation possible |
| Candlestick signals near extremes | Higher probability of follow-through |
Common Mistakes Traders Make
| Mistake | Why It Hurts Performance |
| Relying on patterns alone | No pattern works without context |
| Ignoring Momentum or structure | Leads to counter-trend trading |
| Trading every appearance | Location matters more than pattern itself |
Quiz: Test Your Knowledge
1. What makes two-candle candlestick patterns more reliable than single-candle patterns?
A. They appear more frequently
B. They show a clearer shift in control between buyers and sellers
C. They always lead to trend reversals
2. Which two-candle pattern signals a strong Bearish reversal?
A. Bullish Harami
B. One White Soldier
C. Bearish Engulfing
3. Which complementary tool is most helpful in confirming a candlestick reversal at a major price level?
A. Fibonacci Projection
B. Support & Resistance
C. Bollinger Bands
4. What is a common mistake traders make when using two-candle patterns?
A. Trading only at Support or Resistance
B. Ignoring market context
C. Using confirmation tools
5. Which Momentum indicator is highlighted as a strong companion to two-candle patterns?
A. ADX
B. RSI or TSI
C. MACD Histogram only
Answer Key
- B
- C
- B
- B
- B
Conclusion
Two-candle Japanese candlestick patterns are powerful reversal tools—when used correctly.
They are most effective when combined with Support/Resistance, Momentum, and Chart Patterns rather than used in isolation.
By focusing on the strongest signal combinations and applying disciplined risk management, you can dramatically improve your timing and confidence in trade entries.
Forex Trading Disclosure Statement
Risk Warning:
Forex trading involves significant risk and may not be suitable for all investors. You may lose more than your initial investment. Only trade with money you can afford to lose.
Market Risks and Volatility:
Currency prices move based on global events, economic data, and geopolitical changes. Volatility can cause sudden, unexpected losses.
Leverage Risks:
Leverage increases both potential gains and potential losses. Use it cautiously.
Technology Risks:
Trading platforms can experience outages, delays, or pricing errors that affect trades.
No Guaranteed Results:
Past performance does not guarantee future outcomes. No strategy eliminates all risk.
Educational Purpose Only:
The information provided is for education, not financial advice. Consult a licensed professional before trading.
Responsibility:
You are responsible for your own trading decisions and risk management.