
Learning to draw accurate support and resistance lines is essential for identifying where buyers and sellers take action.
When drawn correctly, these levels improve your trade selection, stop placement, and profit targeting. When drawn poorly, every other tool—candlesticks, momentum, chart patterns—becomes unreliable.
This guide explains why accurate levels matter, common mistakes to avoid, and three precise techniques for effectively drawing support and resistance lines.
You’ll also learn how to combine them with other indicators and confirm levels with real price action.
TL;DR (Quick Summary)
- Support and Resistance levels show where buyers and sellers repeatedly enter the market.
- Draw levels using major reversal zones, candlestick signals, and swing highs/lows.
- Avoid drawing too many lines, relying only on wicks, or ignoring historical data.
- Use daily and weekly timeframes for the strongest levels.
- Combine levels with candlesticks, momentum, and chart patterns for higher accuracy.
Table of Contents
- TL;DR (Quick Summary)
- Why Accurate Support and Resistance Matter
- Common Mistakes Traders Make When Drawing Support & Resistance
- How to Draw Accurate Support and Resistance Lines
- What’s the Next Step?
- Frequently Asked Questions
- Quiz: Test Your Knowledge
- Answer Key
- Forex Trading Disclosure Statement
Why Accurate Support and Resistance Matter
If you cannot pinpoint where price historically reacts, you will struggle to:
- Find high-quality trading opportunities
- Place effective stop losses
- Identify realistic targets
- Avoid false breakouts
- Understand trend exhaustion or continuation
Drawing accurate lines on a candlestick chart using price action, you can identify critical levels to place stop-losses to limit risk and avoid false breakouts and signals.
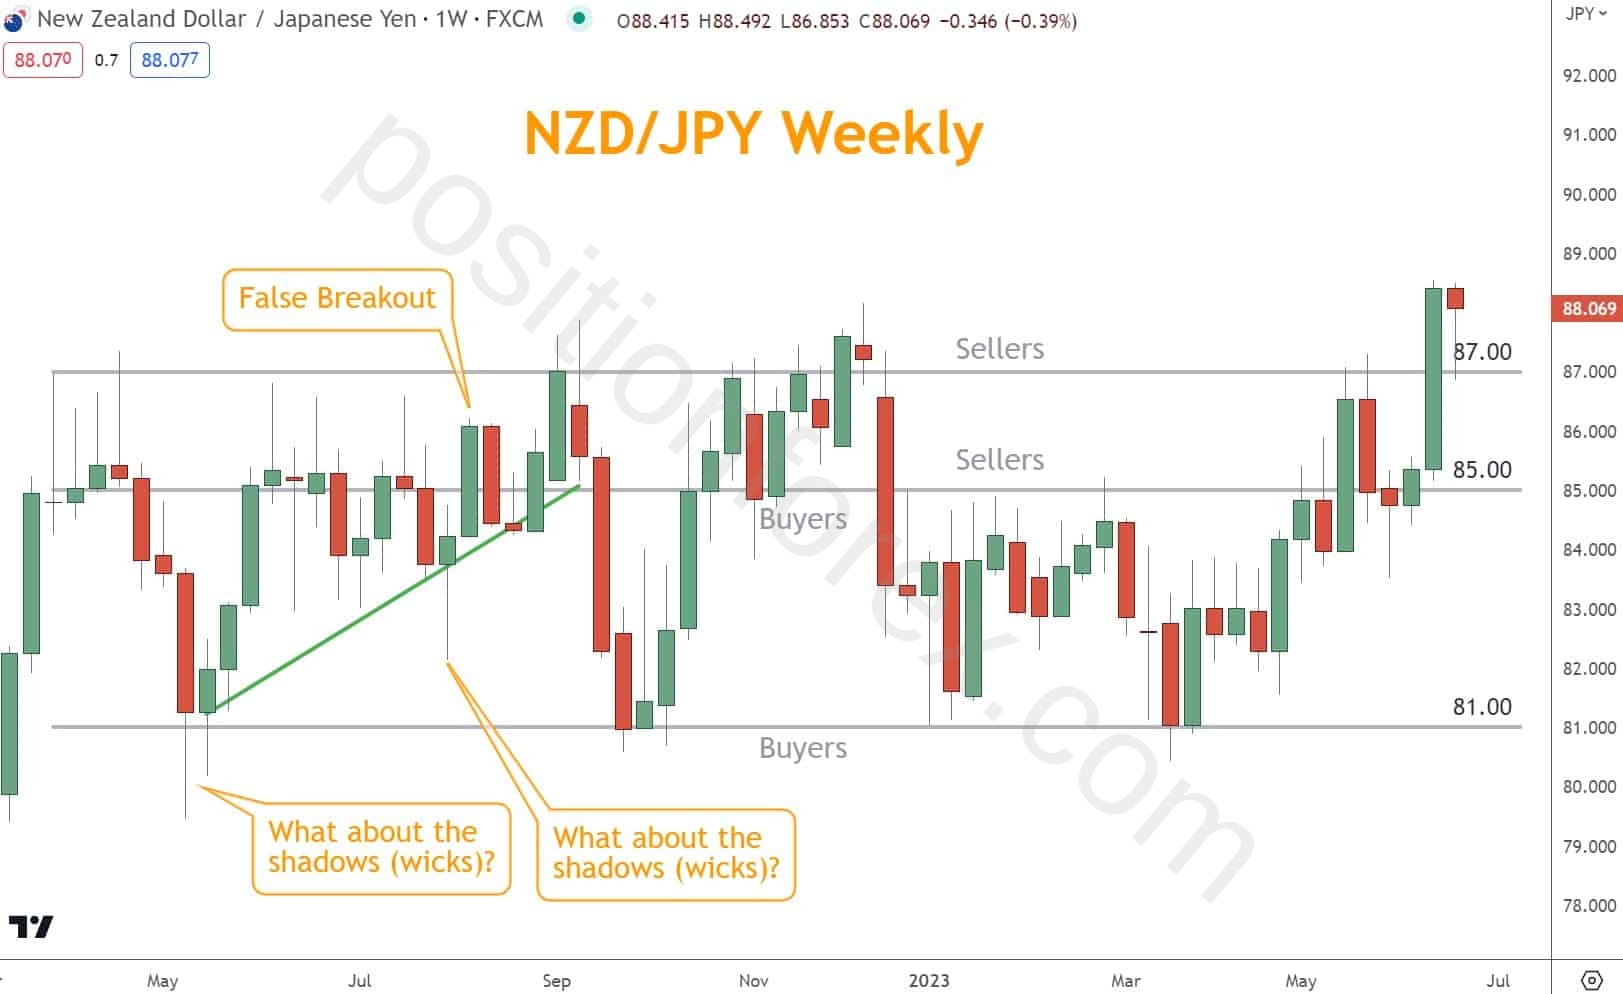
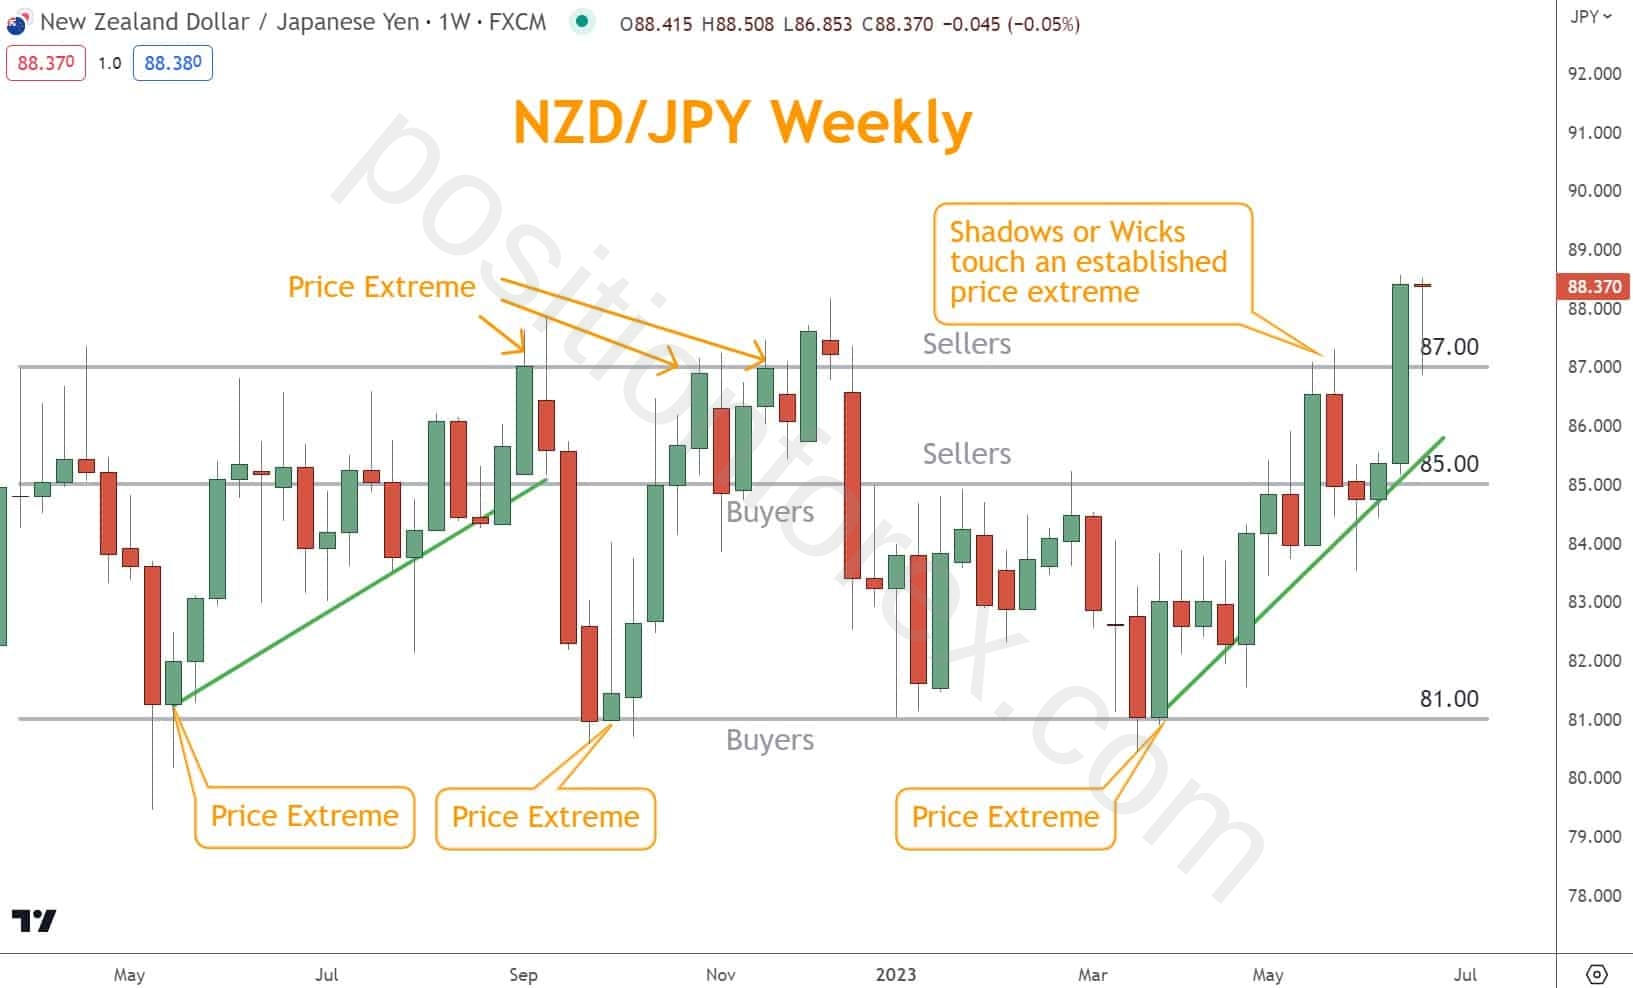
In the example below, NZDJPY finds buyers and sellers at repeated levels over time. Buyers step in at 81.00, sellers at 87.00, and both near 85.00, depending on other factors.
Accurate Support and Resistance are the foundation of all price-action trading.
Common Mistakes Traders Make When Drawing Support & Resistance
| Mistake | Why It Hurts Your Trading | Correct Approach |
| Drawing too many lines | Creates clutter and confusion | Only draw levels price respects multiple times |
| Using wicks exclusively | Long wicks may reflect low liquidity or emotion | Combine wicks + candle bodies |
| Using weak candles (Doji, Spinning Top) as anchor points | These candles show indecision, not conviction | Use Large-bodied candles or strong swings |
| Ignoring historical price action | Old S/R levels still influence price | Give weight to levels tested multiple times |
| Drawing lines on low timeframes | Lower timeframes create noise and weak levels | Use Daily or Weekly charts for primary levels |
| Not adjusting levels as conditions change | Outdated lines lead to faulty signals | Update levels periodically as new swings form |
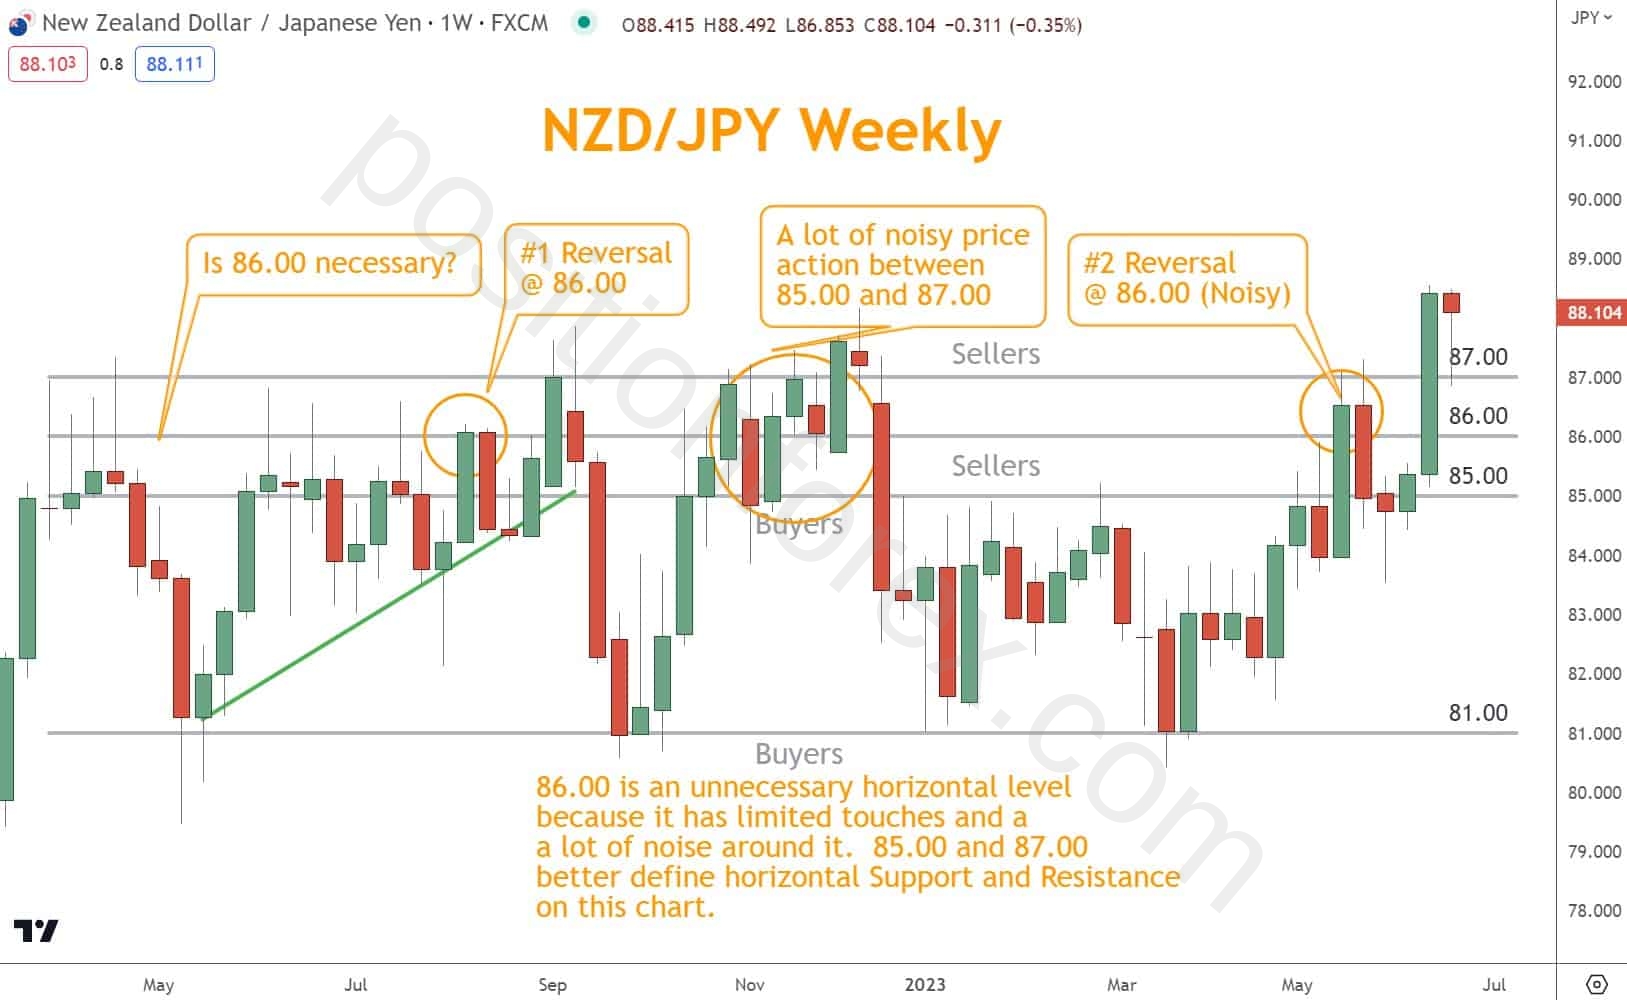
As you can see in the chart below, adding the 86.00 support and resistance level adds more confusion than clarity. There is a fair amount of congestion near this price level and only one clean reversal.
In the example below, a Spinning Top failed to confirm a breakout, and instead, prices fell back from an earlier established resistance level.
Don’t ignore significant price levels frequently visited, especially historical extremes.
Unfortunately, drawing Support and Resistance isn’t an exact science, but it’s still essential to successful Forex trading.
Looking for a Strategy?
Download the Six Basics of Chart Analysis and sign up for Forex Forecast to learn a bottom-up approach to analyzing Forex markets and weekly market updates.
How to Draw Accurate Support and Resistance Lines
Three primary techniques determine which levels actually matter.
Table: The 3 Methods for Accurate Support and Resistance
| Method | How It Works | What to Look For |
| 1. Major Pause Zones | Identify areas where price repeatedly hesitates or reverses | Multi-touch levels, strong reversals, historical extremes |
| 2. Candlestick Reversal Confirmation | Candlesticks show where buyers and sellers battle | Engulfing, Hammer, Shooting Star, Morning/Evening Star |
| 3. Swing Highs & Swing Lows | Swing points reveal natural turning points | Higher Highs / Higher Lows in rallies; Lower Highs / Lower Lows in selloffs |
Begin by identifying significant pause areas where prices have historically stopped and reversed.
This is especially true for extreme areas.
In this example, NZD/JPY prices repeatedly reverse at the 87.00 level.
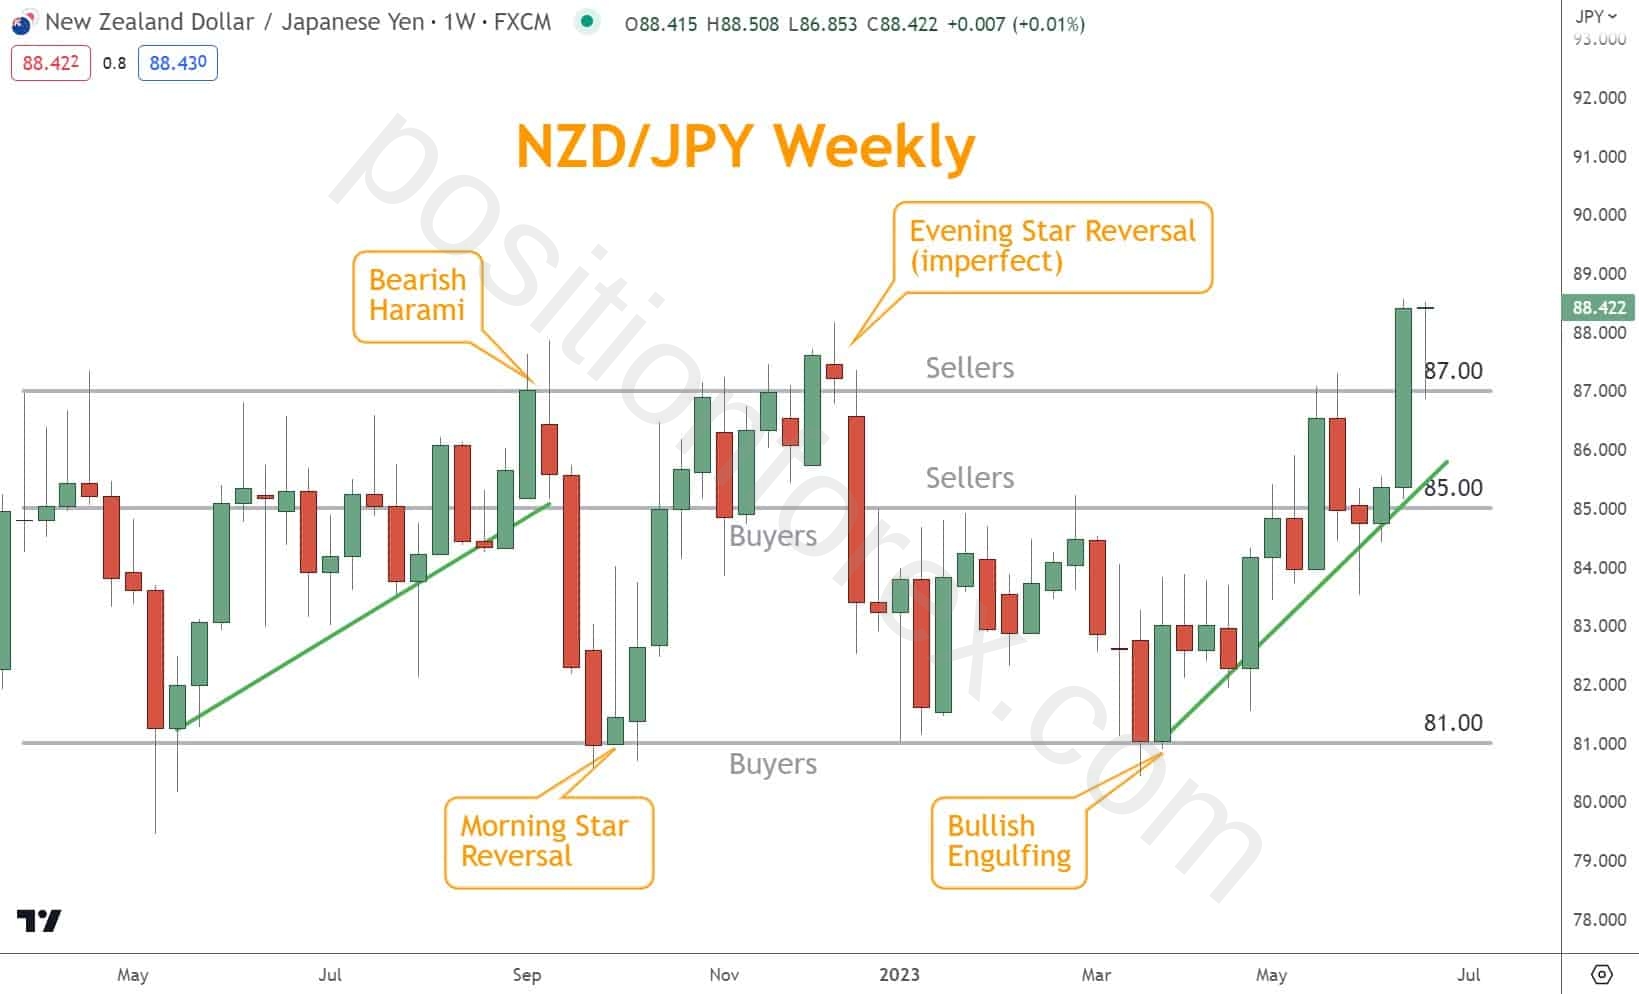
Candlestick charts provide reversals that signal essential levels.
Use these reversals to confirm other techniques.
The chart below illustrates how Japanese Candlestick reversal patterns coincide with support and resistance levels, providing confirmation.
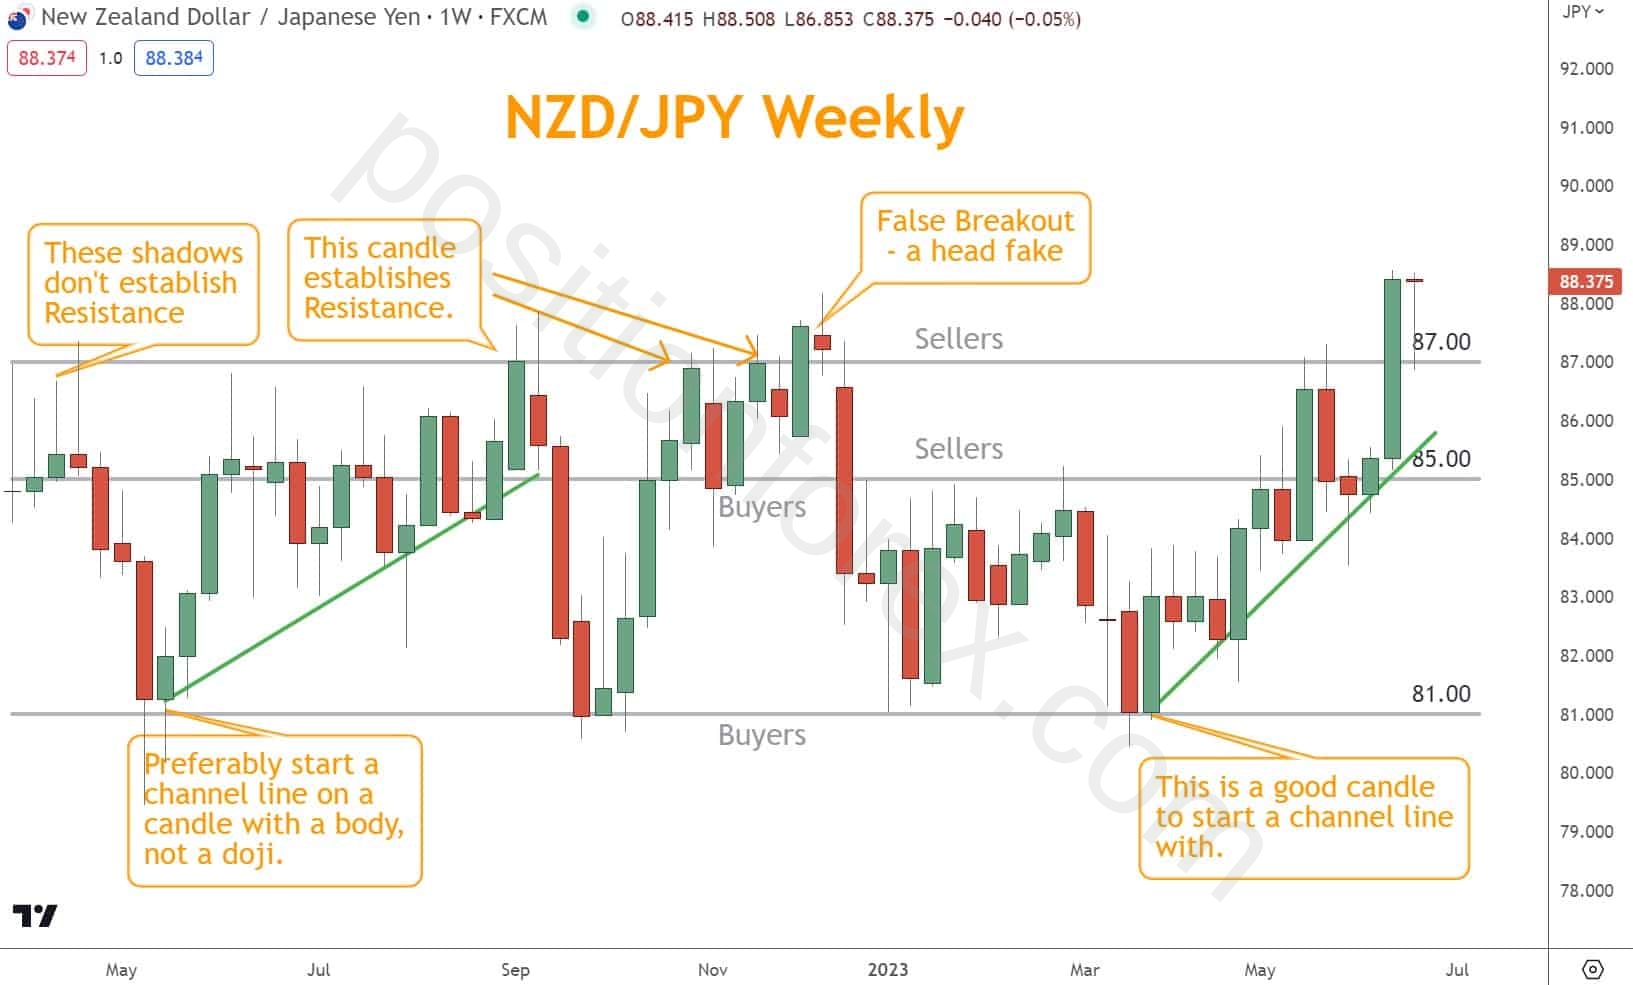
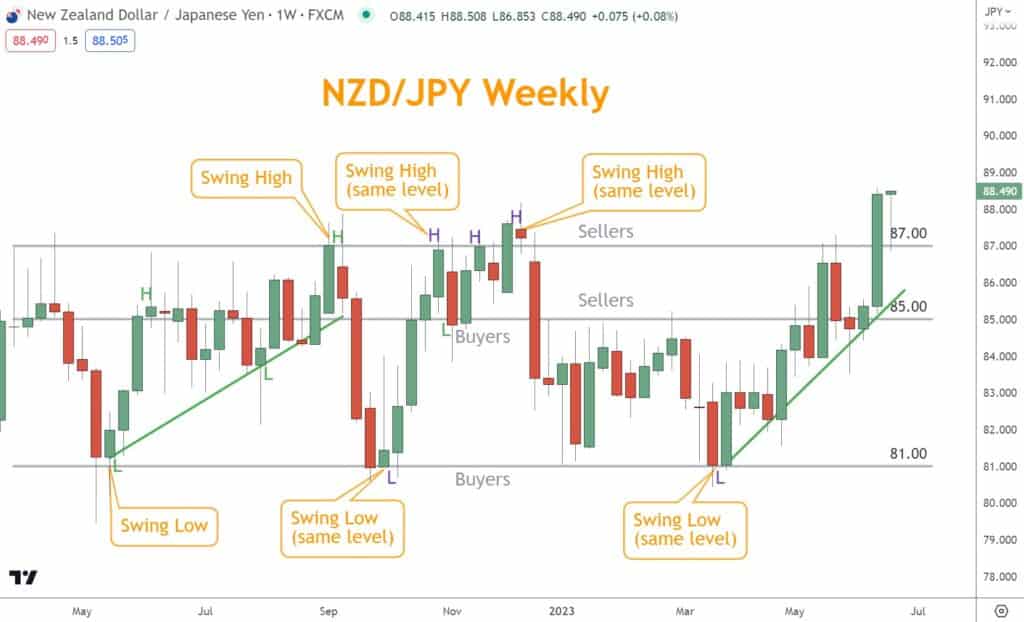
Drawing channel or horizontal lines through swing highs or swing lows can also help you map out a potential Support and Resistance level.
The chart below labels swing highs and lows to help confirm the support or resistance level.
What’s the Next Step?
Select your favorite candlestick chart and:
- Identify major support and resistance zones
- Confirm levels using candlestick reversals or swing points
- Combine these levels with momentum or chart patterns
- Use them for stop placement, target selection, and breakout filtering
To build a complete analysis routine, download the Six Basics of Chart Analysis for free. You’ll also receive the weekly Forex Forecast, which includes:
- Trade ideas
- Chart examples
- Educational guides
- Weekly video lessons
- Market structure breakdowns

Everything is 100% free and designed to accelerate your development as a position trader.
Frequently Asked Questions
Why is it essential to draw accurate Support and Resistance lines?
Accurate levels prevent false entries, help set proper stops/targets, and identify high-probability trade zones.
What timeframe should I use to draw these levels?
Daily and weekly charts produce the most reliable Support and Resistance zones.
Do Support and Resistance levels work forever?
Levels remain valid as long as price continues to react there—but they should be updated as new structure forms.
Quiz: Test Your Knowledge
1. What makes a Support or Resistance level valid?
A. A single candle touch
B. Multiple reactions over time
C. Only the longest wick
D. Only levels on a 1-hour chart
2. Which timeframe produces the strongest Support and Resistance levels?
A. 5-minute
B. 1-hour
C. Daily or Weekly
D. 30-second
3. Which candlestick pattern helps confirm Support or Resistance?
A. Doji in isolation
B. Engulfing Pattern
C. Tiny Spinning Top
D. Random inside bar
4. What is the biggest mistake traders make when drawing levels?
A. Using candlestick bodies
B. Drawing too many lines
C. Looking at historical price action
D. Updating levels regularly
5. Swing Highs and Swing Lows help traders identify:
A. Market noise only
B. Random retracements
C. Natural turning points for S/R
D. Broker spread changes
Answer Key
- B
- C
- B
- B
- C
Forex Trading Disclosure Statement
Risk Warning:
Forex trading involves significant risk and may not be suitable for all investors. The leveraged nature of Forex trading can work both for and against you, leading to substantial gains or losses. Before trading Forex, you should carefully consider your financial objectives, experience level, and risk tolerance. It is possible to lose more than your initial investment, and you should only trade with money you can afford to lose.
Market Risks and Volatility:
Forex markets are influenced by global economic, political, and social events, which can result in unpredictable price movements. High market volatility can lead to sudden and substantial changes in currency values, potentially causing losses that exceed your initial deposit.
Leverage Risks:
Leverage amplifies both potential gains and potential losses. While leverage can increase profitability, it also increases the risk of significant losses, including the loss of your entire trading capital.
Trading Tools and Technology Risks:
Forex trading platforms, including those offered by brokers, are subject to technology risks, such as system failures, latency issues, and potential errors in price feeds. Traders should be aware that these risks can impact the execution of trades and trading outcomes.
No Guarantee of Profitability:
Past performance in Forex trading is not indicative of future results. There is no guarantee that you will achieve profits or avoid losses when trading Forex. Market conditions and individual trading strategies vary, and no trading system can eliminate the inherent risks of Forex trading.
Educational Purposes Only:
Any information provided about Forex trading, including strategies, analysis, or market commentary, is for educational purposes only and should not be considered financial advice. Consult a qualified financial advisor or tax professional before making any trading decisions.
Regulatory Compliance: Forex trading is regulated differently in various jurisdictions. Ensure that you are trading with a licensed and compliant broker in your country of residence.
Responsibility:
You are solely responsible for your trading decisions and the associated risks. It is your duty to understand the terms and conditions of Forex trading, including margin requirements, stop-losses, and other risk management tools.
Acknowledgment:
By engaging in Forex trading, you acknowledge that you have read, understood, and accepted this disclosure statement. You accept full responsibility for the outcomes of your trading decisions and agree to trade at your own risk.