
Head and Shoulders patterns are among the most recognizable and respected reversal formations in technical analysis—but traders often misuse them.
Identifying the shape alone isn’t enough. Without proper confirmation, false breakouts, misreads, and premature entries become costly mistakes.
This guide explains how to identify these patterns, confirm them correctly, and trade both the classic Bearish version and the Bullish Inverse version.
You’ll also learn how to combine them with complementary indicators and set logical stops and targets.
TL;DR
- Head and Shoulders = Bearish reversal; Inverse Head and Shoulders = Bullish reversal.
- The pattern is not valid until the neckline is broken on a confirmed close.
- Use Momentum, Japanese Candlesticks, and Support/Resistance for confirmation.
- Stops typically go beyond the right shoulder; targets often use the measured move.
- Complex variations exist—use confirmation tools consistently.
Table of Contents
- TL;DR
- What Is a Head and Shoulders Pattern?
- It’s All About Reversals (and Confirmation)
- How to Set a Stop and Target
- Use Complementary Indicators for Confirmation
- Inverse Head and Shoulders: The Bullish Version
- Complex Head and Shoulders Patterns Exist
- What’s the Next Step?
- Frequently Asked Questions
- Quiz: Test Your Knowledge
- Conclusion
- Forex Trading Disclosure Statement
What Is a Head and Shoulders Pattern?
A Head and Shoulders pattern signals a potential Bearish reversal after a rally. It consists of:
- Left Shoulder – first peak
- Head – highest peak
- Right Shoulder – second peak lower than the head
- Neckline – support connecting the two swing lows
A confirmed close below the neckline completes the pattern.
To recognize the structure:
- Look for three peaks, with the head as the highest.
- The neckline connects the lows of each shoulder.
- The right shoulder typically shows waning bullish momentum.
- The confirmation occurs only when price closes below the neckline.
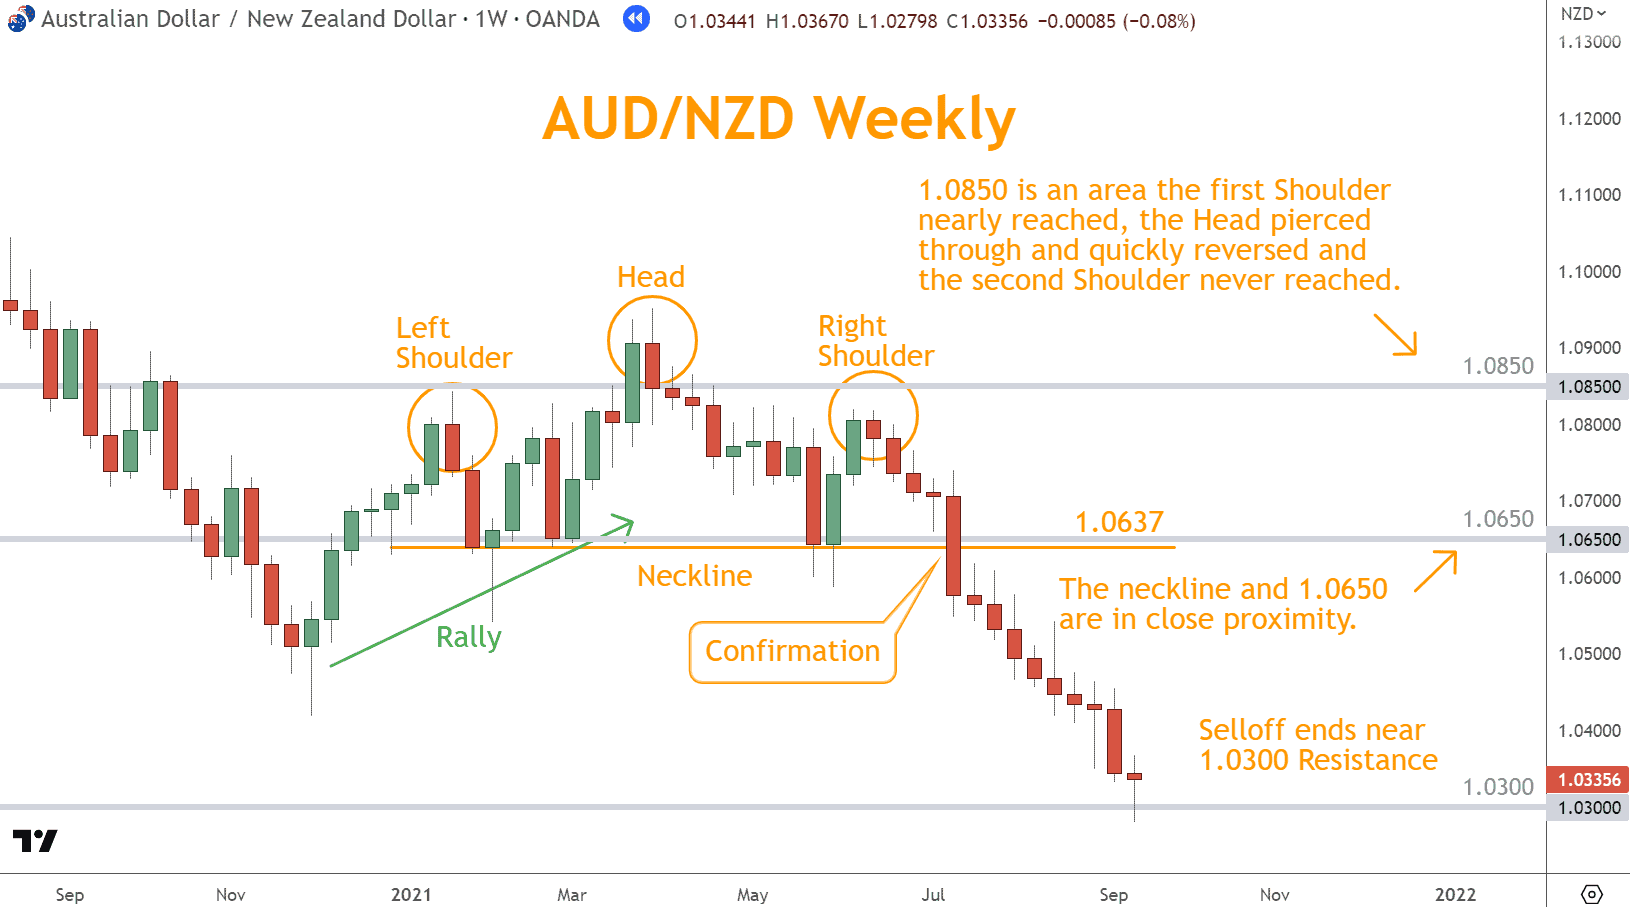
The AUD/NZD example below clearly delineates the three peaks of the pattern.
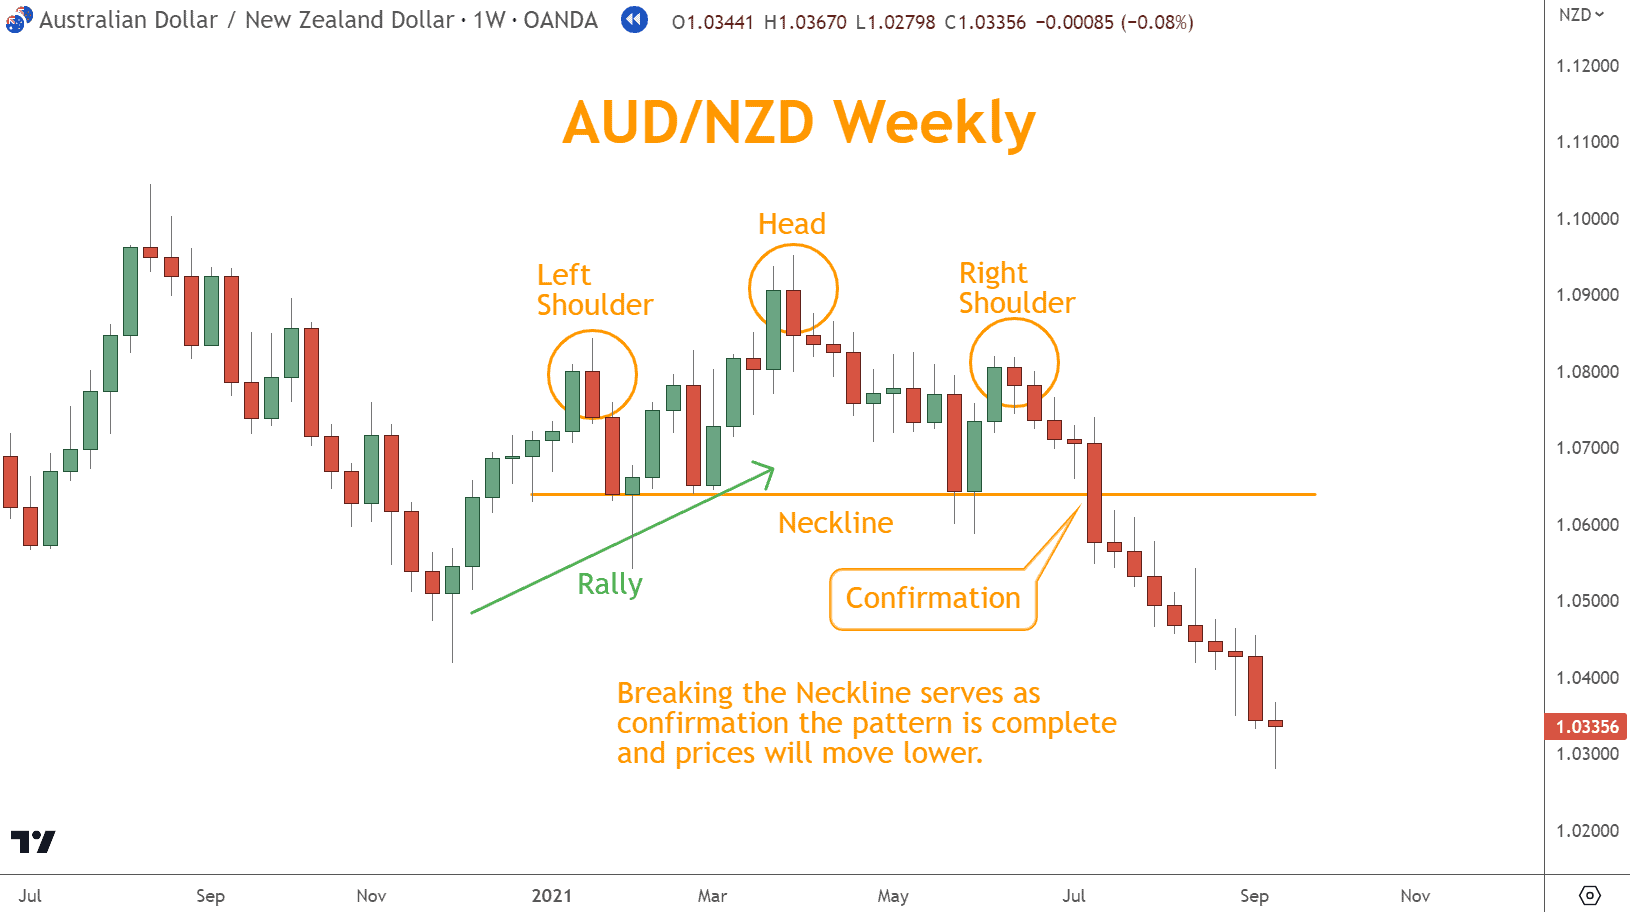
It’s All About Reversals (and Confirmation)
What is the most common mistake traders make?
Acting before confirmation.
Always wait for a confirmed close through the neckline.
Why?
- Head fakes are common
- Shoulders can reform
- Price may test the neckline repeatedly before breaking
Without confirmation, the pattern is incomplete and unreliable.
How to Set a Stop and Target
Here are methods for stop-loss and target placement:
Stop & Target Methods
| Method | Description | When to Use |
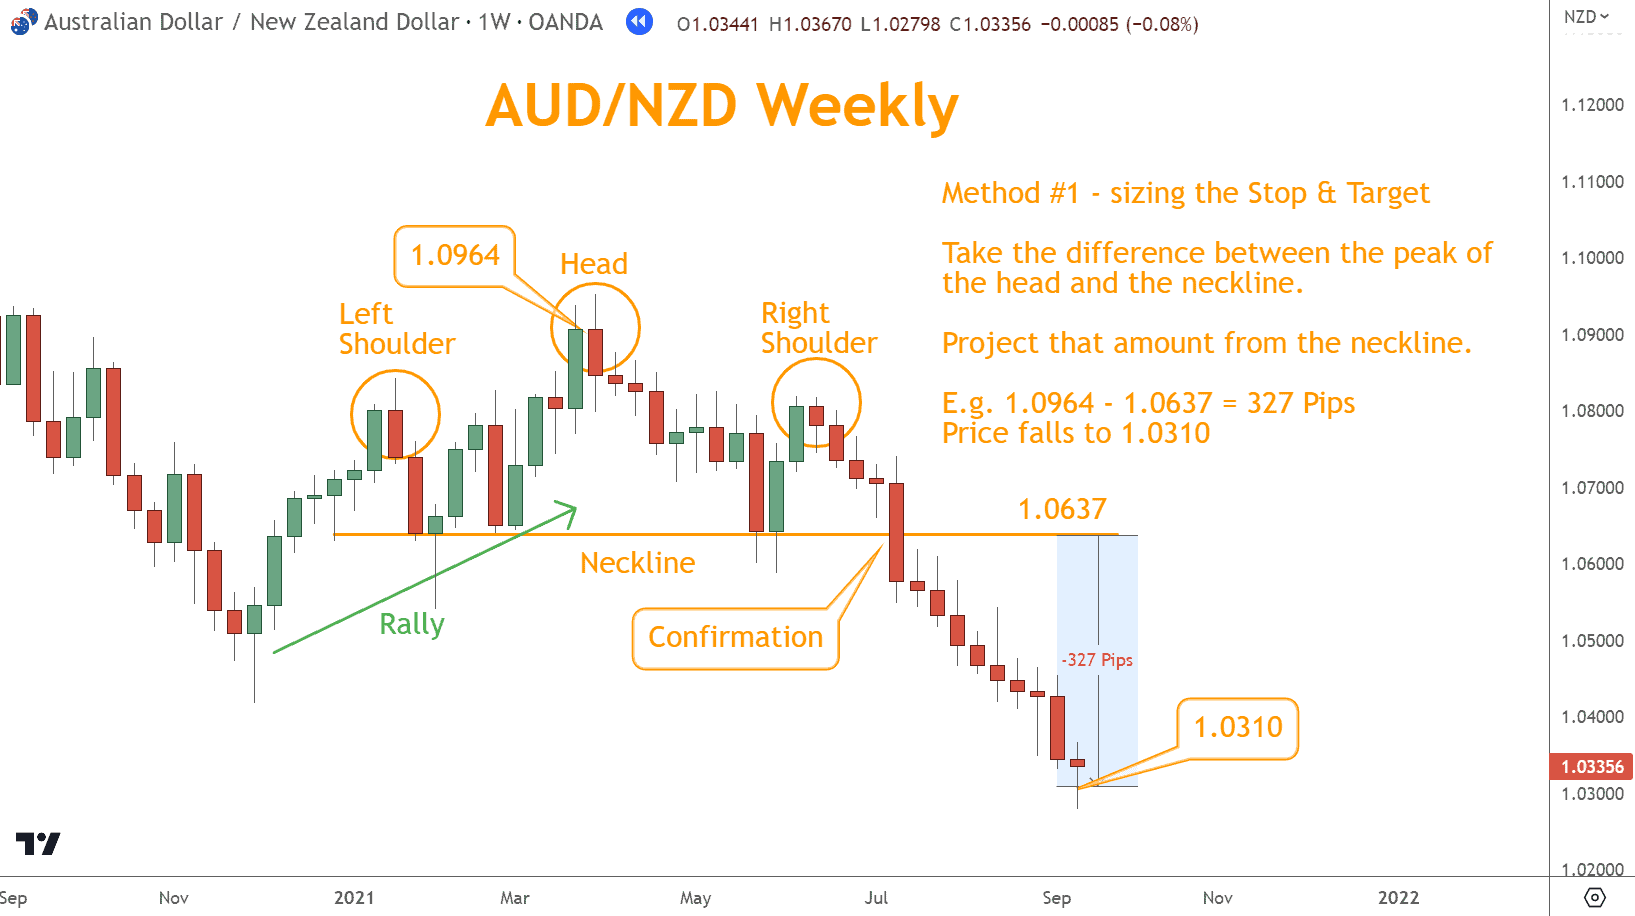
| Measured Move Target | Measure distance from head → neckline and project downward/upward. | When seeking a defined risk–reward objective. |
| Structure-Based Stop | Stop placed above (H&S) or below (Inverse H&S) the right shoulder. | Most flexible and adaptive to volatility. |
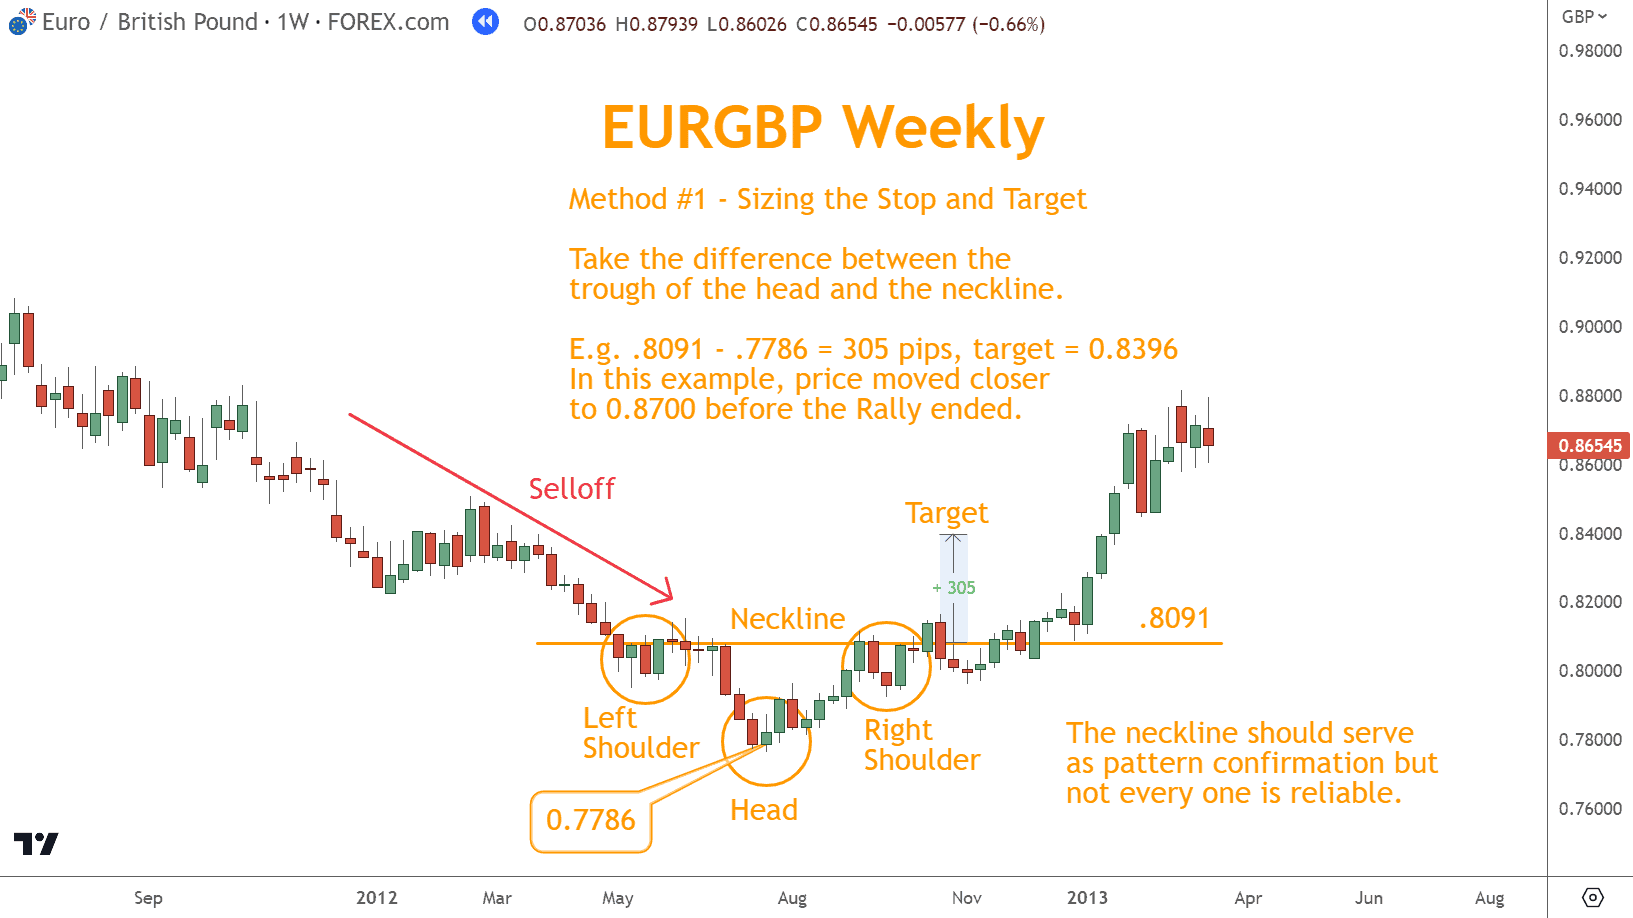
With a measured move, calculate your profit target based on the distance between the head and the neckline.
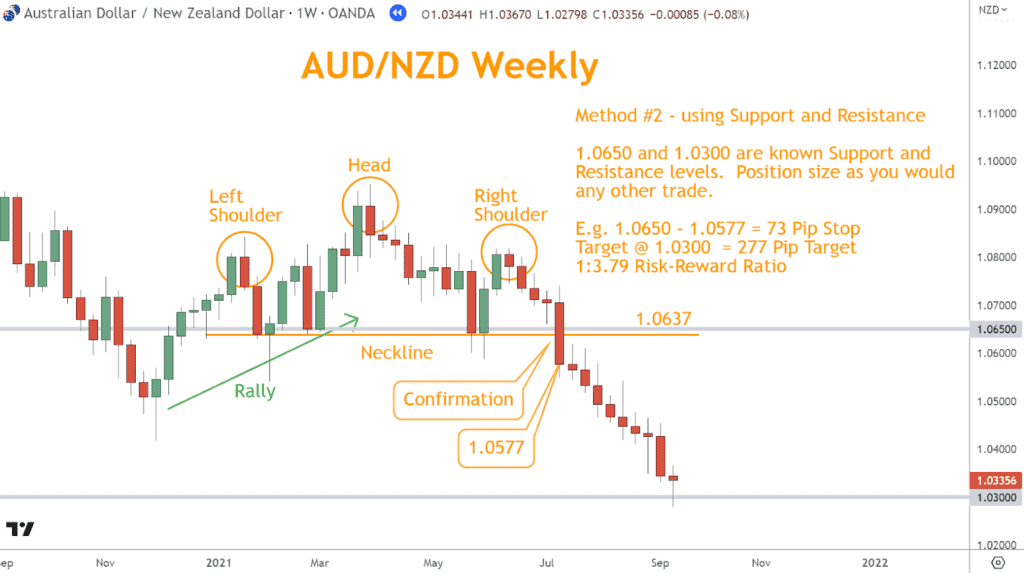
With a structure-based stop, consider support and resistance levels; it should be above the right shoulder.
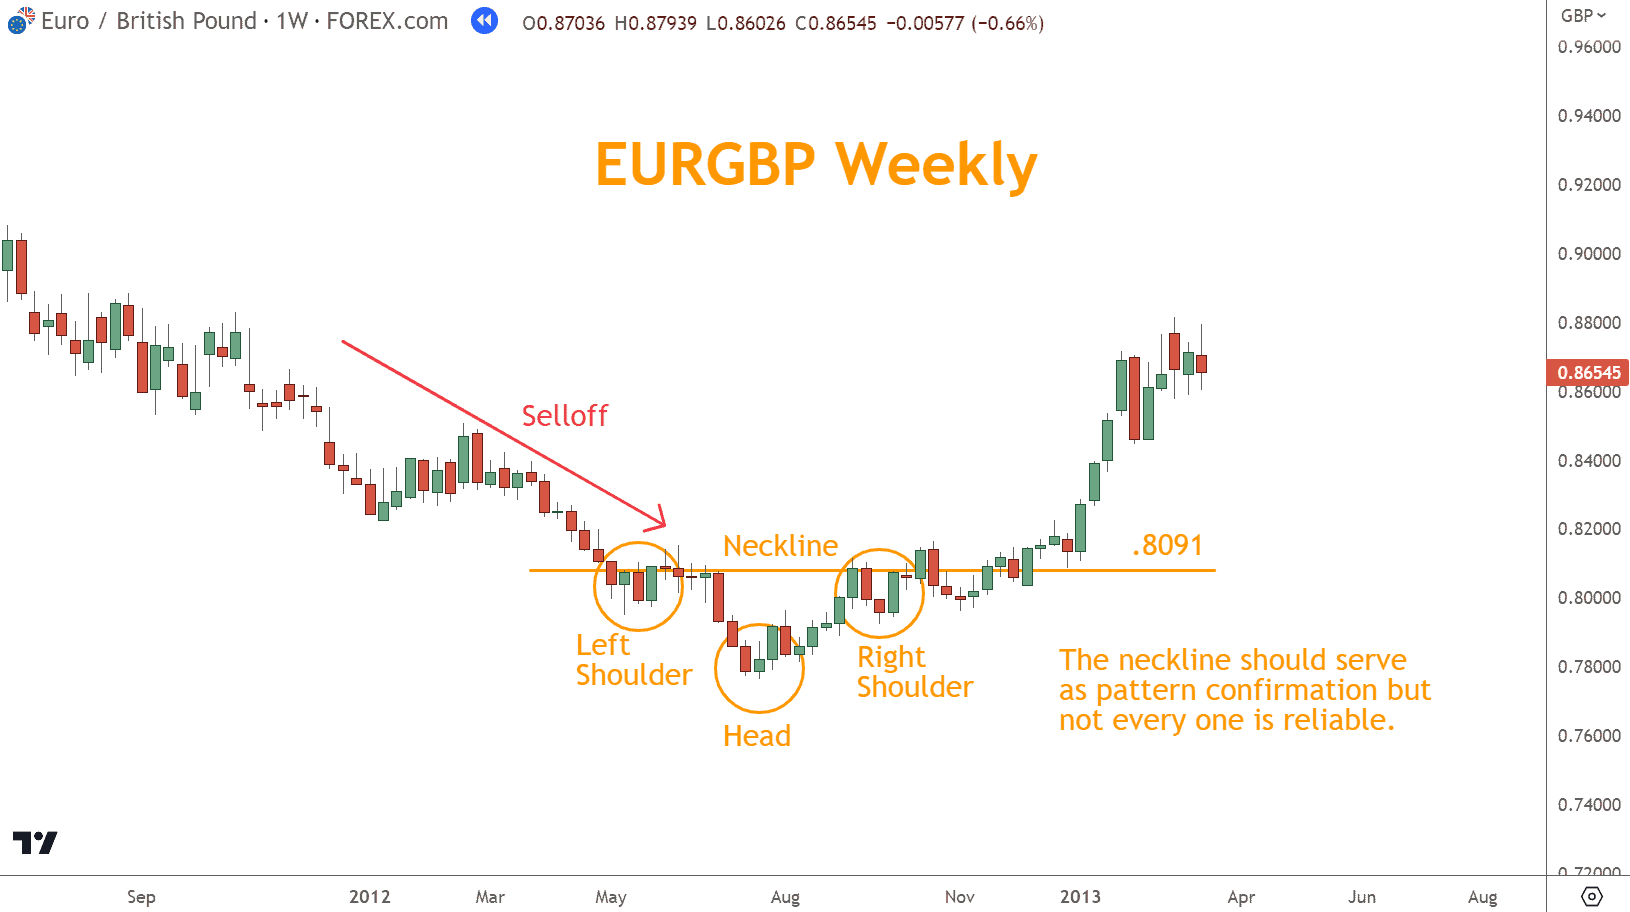
The two AUD/NZD examples below illustrate these techniques.
Looking for a Strategy?
Download the Six Basics of Chart Analysis and sign up for Forex Forecast to learn a bottom-up approach to analyzing Forex markets and weekly market updates.
Use Complementary Indicators for Confirmation
Confirmation dramatically improves trade reliability. The three most effective tools are below:
Complementary Indicators for Pattern Confirmation
| Indicator Type | What It Confirms | Why It Matters |
| Momentum Oscillators (RSI, TSI) | Overbought (Bearish reversal) or Oversold (Bullish reversal). | Helps validate weakening trend strength. |
| Support & Resistance | Alignment of the neckline or shoulder areas with known price zones. | Strengthens the reliability of the breakout. |
| Japanese Candlestick Patterns | Reversal psychology at the shoulders or neckline. | Provides early warning or secondary confirmation. |
After a neckline close, oscillators, Support and Resistance levels, and Japanese candlesticks are the best tools for confirmation.
Oscillators like the Relative Strength Index (RSI) help identify overbought or oversold conditions to confirm a reversal.
Identifying critical support and resistance levels confirms the formation of a Head and Shoulders pattern on the price chart.
The chart below shows that at 1.0850, the first shoulder was nearly reached, the head pierced through and quickly reversed, and the second never came.
The neckline and where the selloff ends are also near support and resistance levels.
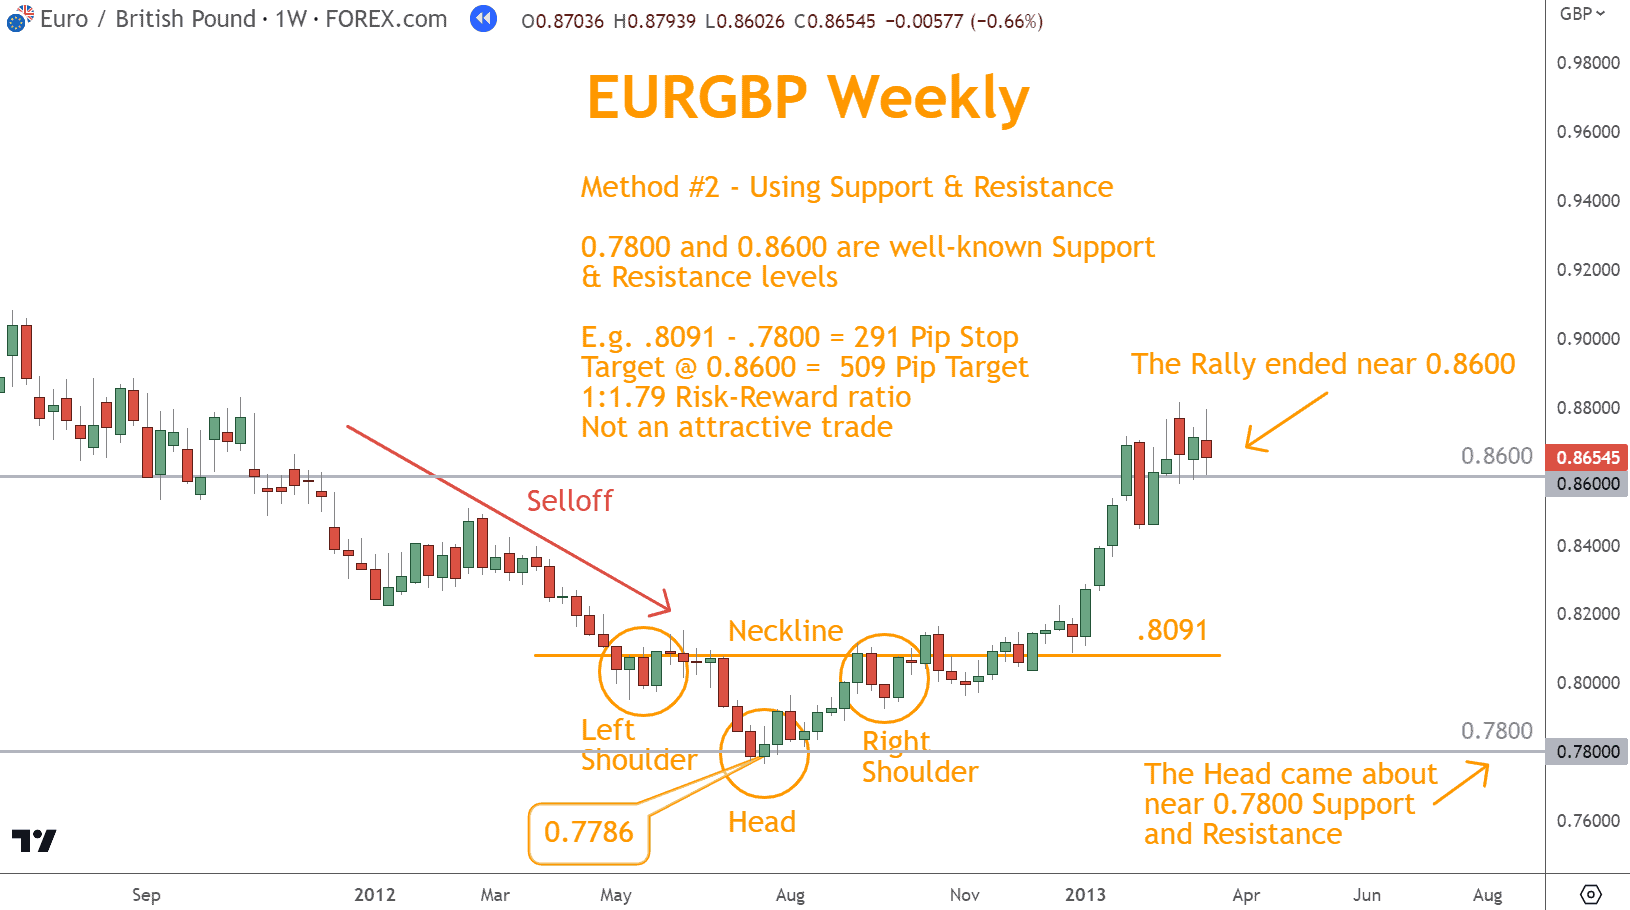
Inverse Head and Shoulders: The Bullish Version
The Inverse H&S is the bullish alternative and appears at the end of a selloff. It includes:
- A left trough
- A deeper middle trough (head)
- A higher right trough
- A neckline connecting reaction highs
A confirmed close above the neckline signals a Bullish reversal.
To identify an Inverse Head and Shoulder pattern (sometimes called an Inverted Head and Shoulders pattern) while trading in Forex, look for a selloff followed by a price retracement forming the left Shoulder.
Once prices rise to form the first peak (the left shoulder’s bottom), they then drop again, starting at a new low (the head) before rising once more to form the second peak (the right shoulder’s bottom).
The neckline is drawn by connecting the highs of each shoulder formation.
Traders must wait to confirm the pattern after seeing the breakout price close above this level.
Two Techniques for Stops and Targets in Inverse H&S
| Technique | Stop Placement | Target Placement |
| Structure-Based | Below the right trough | Next resistance zone |
| Measured Move | Based on volatility tolerance | Neckline → head distance projected upward |
How do you confirm this pattern is complete, and a reversal higher is in motion?
After forming this pattern, a confirmed break above the neckline confirms a bullish reversal.
Therefore, waiting for a confirmed break above the neckline before entering any trade is essential.
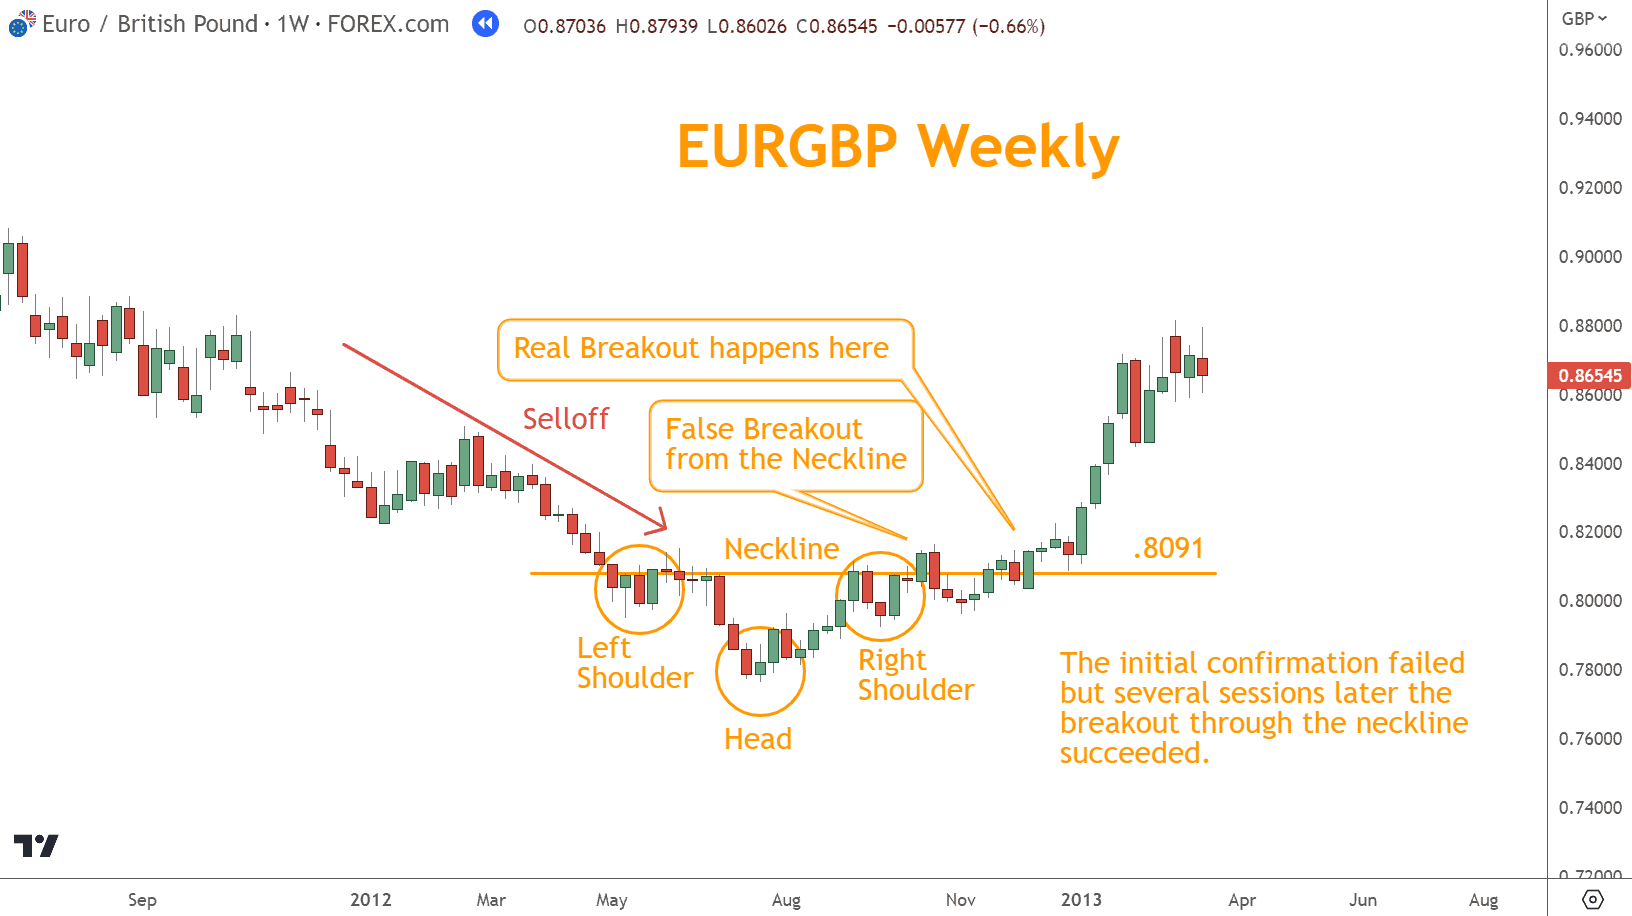
This is because false breakouts can occur, as you can see in this example, and traders must ensure the pattern’s validity before making trading decisions.
As always, validate a favorable risk-reward ratio before taking the trade.
To choose a stop and target when trading the Inverse Head and Shoulders pattern, traders can calculate the distance between the head and the neckline.
As a second method, look for a corresponding support and resistance level.
For a profit target, you can calculate the distance from the neckline to the head or identify an appropriate support and resistance level.
Sometimes, these two price levels coincide, giving the trade greater credence.
In this example, the risk-reward ratio is unattractive, and although it’s profitable in retrospect, it’s not a trade I recommend taking.
Use proper position sizing to manage risk with your trades.
Use Up to Three Confirmation Indicators
| Confirmation Tool | Application |
| RSI / Stochastic / TSI | Identify Overbought/Oversold or momentum shifts. |
| Support/Resistance | Neckline retest + structure alignment. |
| Candlestick Reversals | Hammers, Engulfing, Morning/Evening Stars. |
Confirming a Head and Shoulder pattern is crucial before entering into any trade.
Complementary indicators play an essential role in confirming the pattern’s validity.
Oscillators such as Stochastic and RSI can help identify overbought or oversold conditions, while support and resistance levels can help determine price areas where buyers may enter the market.
The RSI oversold status correlates perfectly with the head trough in this example.
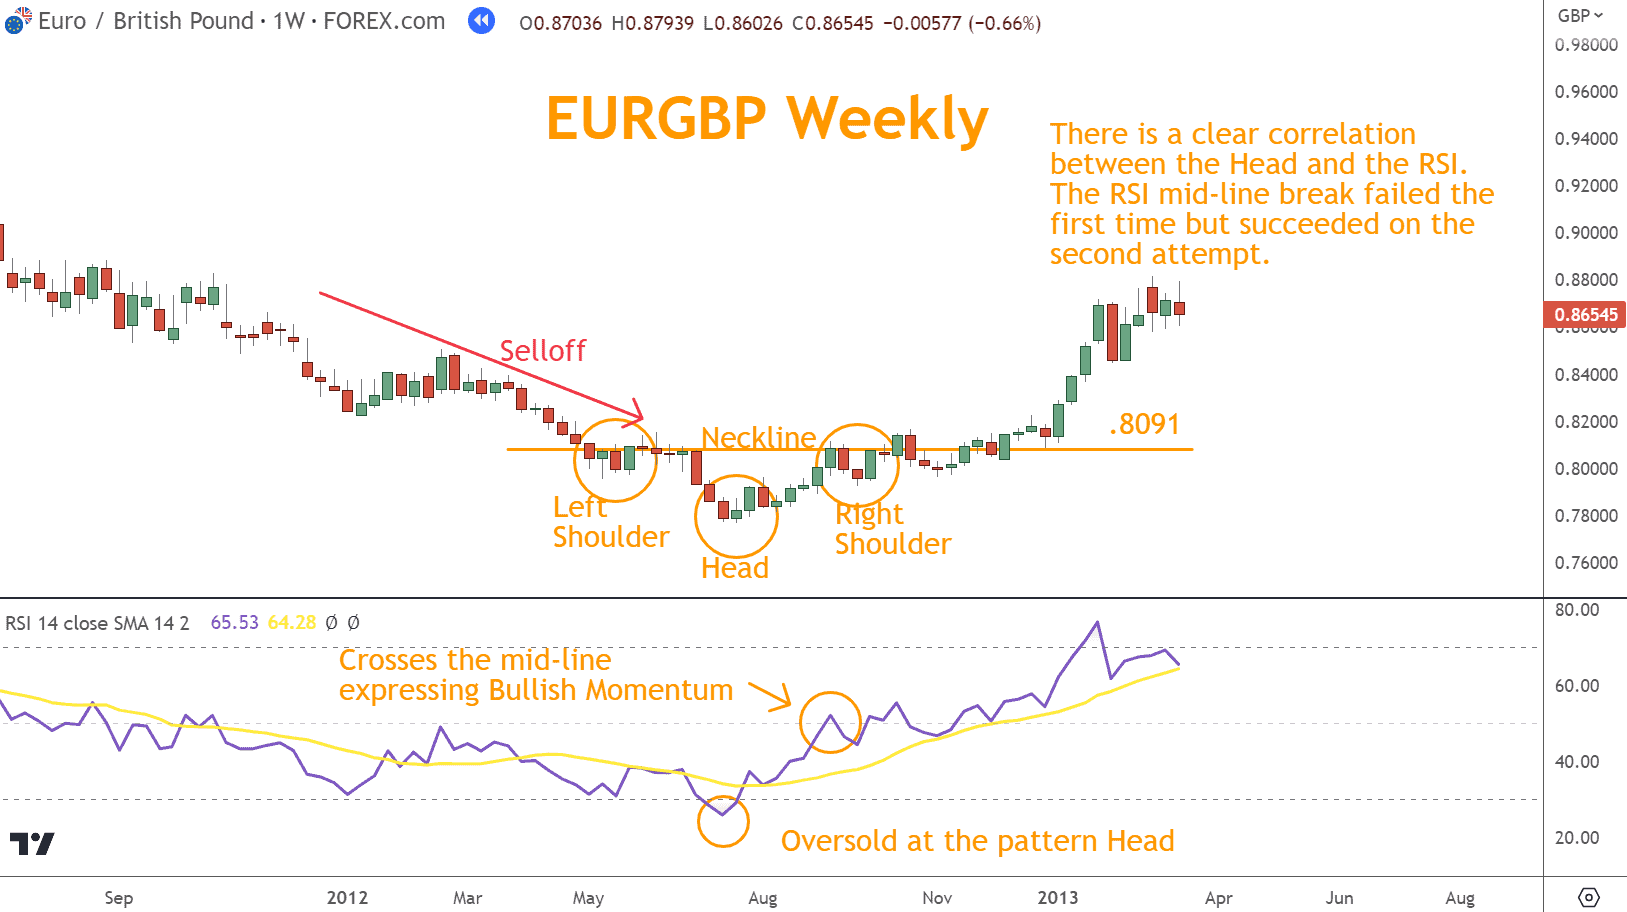 Unfortunately, the RSI rallies through the mid-line with the failed breakout of the right shoulder. You could reattempt this trade with the second mid-line break.
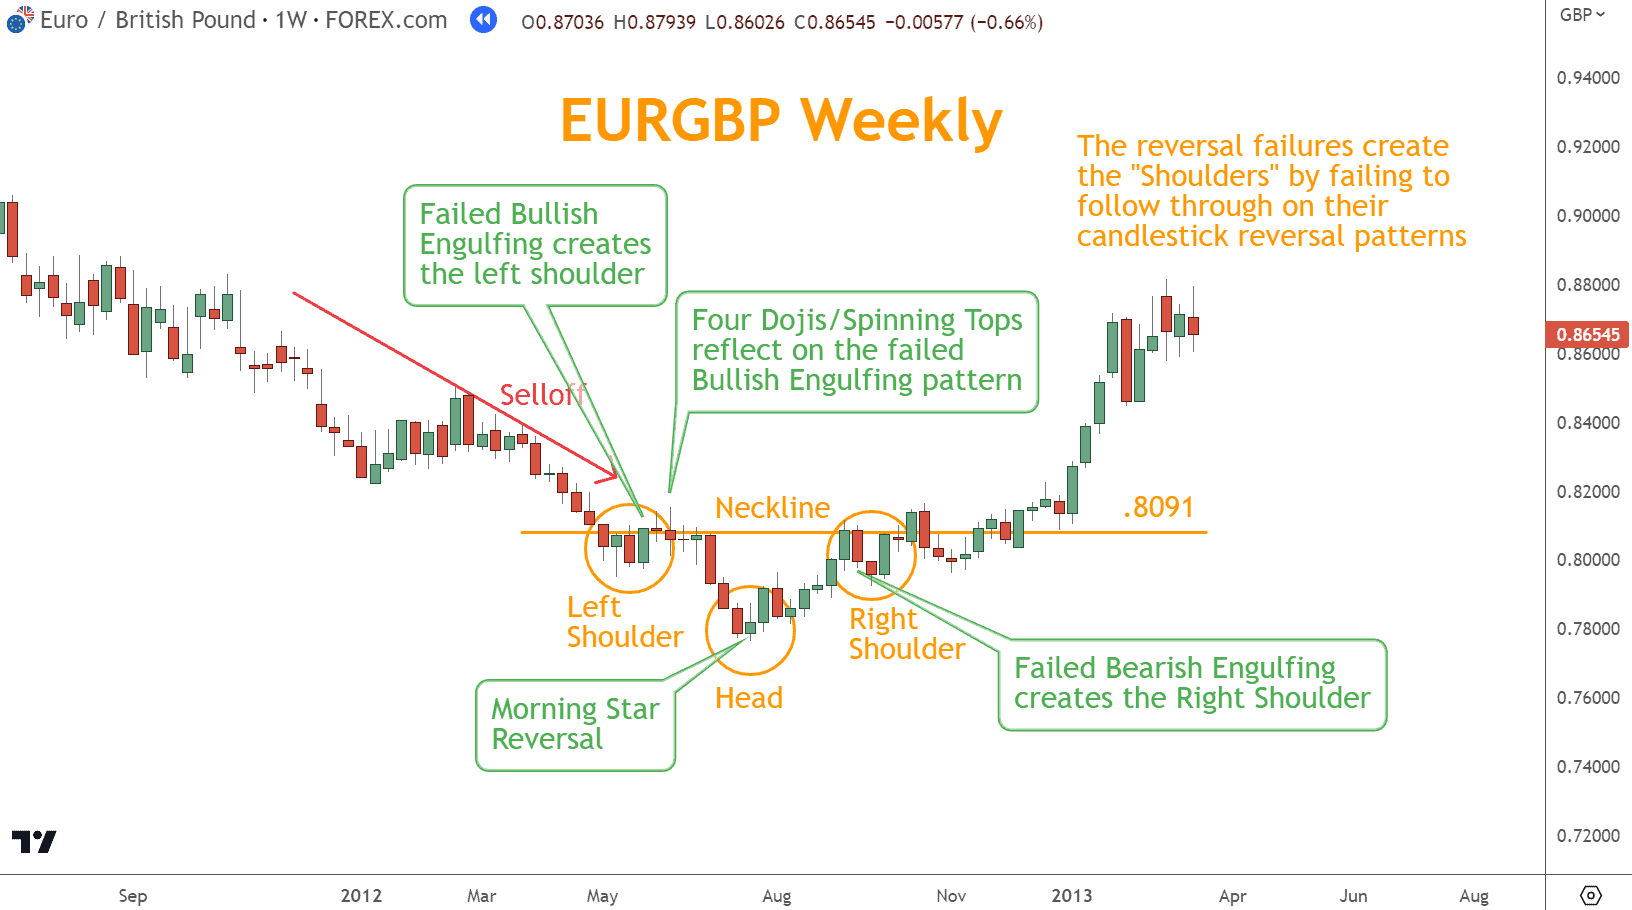
Traders should also focus on Japanese Candlestick patterns, which provide insight into potential market reversals.
In this example, advanced candlestick patterns can help with the strategy, but are beyond the scope of this article.
By incorporating these complementary indicators in their trading strategy, traders can effectively confirm their patterns for successful trades.
A minimum of two confirmations substantially improves reliability.
Complex Head and Shoulders Patterns Exist
Variations include:
- Multiple left/right shoulders
- Tilted or curved necklines
- Extended consolidation
When analyzing Head and Shoulders patterns, one must be aware of complex variations such as Multiple Head and Shoulders or Inverse Head and Shoulders.
What makes them complex patterns is that they have multiple shoulders on each side of the peak head.
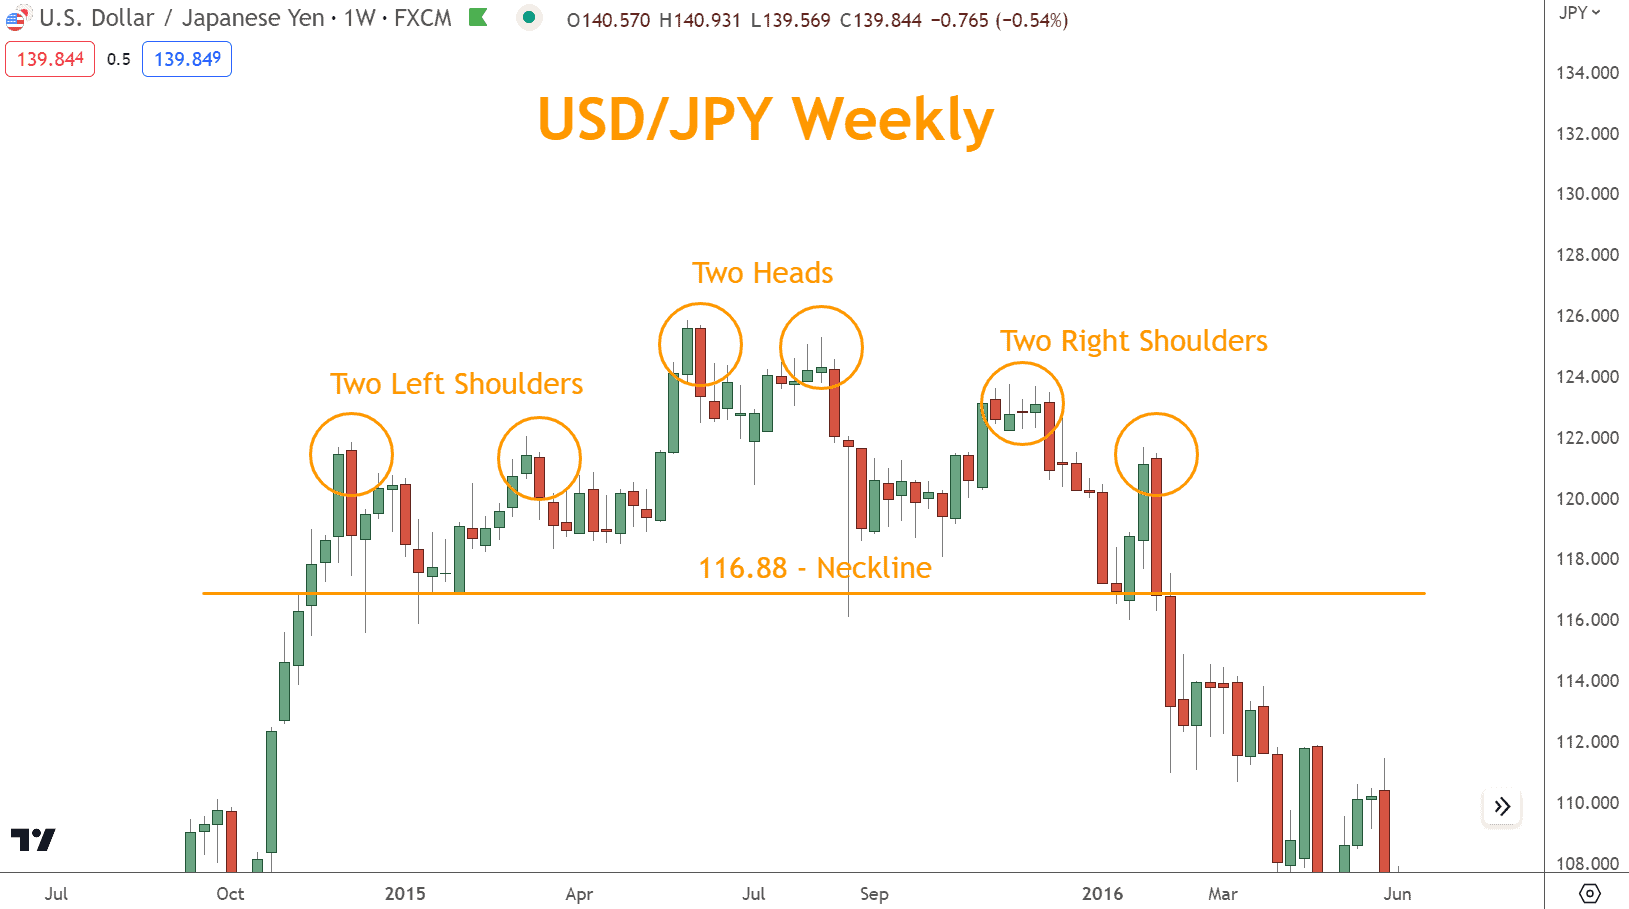
The psychology remains unchanged, but the shape becomes less clear. Use confirmation indicators more heavily in these cases.
What’s the Next Step?
- Open a chart and locate a potential H&S or Inverse H&S setup.
- Identify the neckline—but wait for confirmation.
- Add Momentum, Candlesticks, and Support/Resistance for stronger validation.
- Choose a risk-appropriate stop and target.
- Position size correctly.

If you need a structured process, review the Six Basics of Chart Analysis, included free with Forex Forecast.
Frequently Asked Questions
Is a Head and Shoulders pattern Bearish or Bullish?
Head and Shoulders = Bearish reversal.
Inverse Head and Shoulders = Bullish reversal.
Both require neckline confirmation.
How reliable is a Head and Shoulders pattern?
It is highly respected but not reliable on its own.
Use confirmation indicators for a stronger probability.
Quiz: Test Your Knowledge
Questions
- What confirms a Head and Shoulders pattern?
A. Price touching the neckline
B. A confirmed close through the neckline
C. RSI overbought
D. A candlestick reversal at the head - Where is the stop typically placed in a standard Head and Shoulders trade?
A. Below the neckline
B. Above the right shoulder
C. Above the head
D. At the neckline - Which indicator is not typically used for confirmation?
A. RSI
B. Support and Resistance
C. Trendline breaks
D. Japanese Candlesticks - The Inverse Head and Shoulders pattern signals:
A. A continuation pattern
B. A Bullish reversal
C. A Bearish reversal
D. A neutral consolidation - The “measured move” target is based on:
A. The distance from shoulder to neckline
B. The distance from head to neckline
C. The average candle size
D. The previous swing high
Answer Key
- B
- B
- C
- B
- B
Conclusion
The Head and Shoulders and Inverse Head and Shoulders patterns are powerful reversal structures—but only when confirmed correctly.
By waiting for a confirmed neckline break, combining multiple technical tools, and applying disciplined stop and target placement, you significantly increase your probability of finding high-quality reversal trades.
The patterns are simple in appearance but sophisticated in execution. Master the confirmation tactics, and you’ll elevate your chart-reading precision across all market conditions.
Forex Trading Disclosure Statement
Risk Warning:
Forex trading involves significant risk and may not be suitable for all investors. The leveraged nature of Forex trading can work both for and against you, leading to substantial gains or losses. Before trading Forex, you should carefully consider your financial objectives, experience level, and risk tolerance. It is possible to lose more than your initial investment, and you should only trade with money you can afford to lose.
Market Risks and Volatility:
Forex markets are influenced by global economic, political, and social events, which can result in unpredictable price movements. High market volatility can lead to sudden and substantial changes in currency values, potentially causing losses that exceed your initial deposit.
Leverage Risks:
Leverage amplifies both potential gains and potential losses. While leverage can increase profitability, it also increases the risk of significant losses, including the loss of your entire trading capital.
Trading Tools and Technology Risks:
Forex trading platforms, including those offered by brokers, are subject to technology risks such as system failures, latency issues, and potential errors in price feeds. Traders should be aware that these risks can impact the execution of trades and trading outcomes.
No Guarantee of Profitability:
Past performance in Forex trading is not indicative of future results. There is no guarantee that you will achieve profits or avoid losses when trading Forex. Market conditions and individual trading strategies vary, and no trading system can eliminate the inherent risks of Forex trading.
Educational Purposes Only:
Any information provided about Forex trading, including strategies, analysis, or market commentary, is for educational purposes only and should not be considered financial advice. Consult a qualified financial advisor or tax professional before making any trading decisions.
Regulatory Compliance:
Forex trading is regulated differently in various jurisdictions. Ensure that you are trading with a licensed and compliant broker in your country of residence.
Responsibility:
You are solely responsible for your trading decisions and the associated risks. It is your duty to understand the terms and conditions of Forex trading, including margin requirements, stop-losses, and other risk management tools.
Acknowledgment:
By engaging in Forex trading, you acknowledge that you have read, understood, and accepted this disclosure statement. You accept full responsibility for the outcomes of your trading decisions and agree to trade at your own risk.
This disclosure provides an overview of the risks associated with Forex trading and is not exhaustive. For additional information, consult your broker and other reliable financial resources.