

Support and resistance tactics are essential tools in Forex trading.
They help you anticipate price reactions, manage risk, and find high-probability entry and exit points. But not all tactics are created equal, and some can hurt your performance.
This article explores two powerful support and resistance strategies—horizontal levels and channel lines—and one popular tactic that fails too often to trust.
Summary: Key Support and Resistance Tactics
| Tactic | Method | Use Case | Recommendation |
|---|---|---|---|
| Horizontal Lines | Fixed zones where price historically reversed | Ideal for entries, exits, and stop-loss levels | Highly reliable |
| Channel Lines | Diagonal lines connecting swing highs/lows | Use for dynamic setups and trend alignment | Effective with confirmation |
| Dynamic Levels | Moving averages as support/resistance | Based on average price movement | Not recommended |
TL;DR – Master These Support and Resistance Tactics
This guide shows you how to:
- Use horizontal levels based on past price reversals.
- Draw channels to identify support/resistance aligned with the trend.
- Avoid dynamic support/resistance using moving averages.
You’ll also learn when support becomes resistance (and vice versa), how to confirm levels with price action, and why context from longer timeframes matters.
Table of Contents
- Summary: Key Support and Resistance Tactics
- TL;DR – Master These Support and Resistance Tactics
- What Are Support and Resistance—and Why Do They Matter?
- Why Support and Resistance Define Market Psychology
- The Power of Horizontal Levels
- Channel Lines: Dynamic Support and Resistance Done Right
- Why Dynamic Moving Averages Fail as Support and Resistance
- How to Draw Support and Resistance Lines That Work
- Higher Timeframe Confirmation (Yes, But With a Caveat)
- Round Numbers and Psychological Levels
- Best Practices for Applying These Tactics
- What’s the Next Step?
- Frequently Asked Questions
- Forex Trading Disclosure Statement
What Are Support and Resistance—and Why Do They Matter?
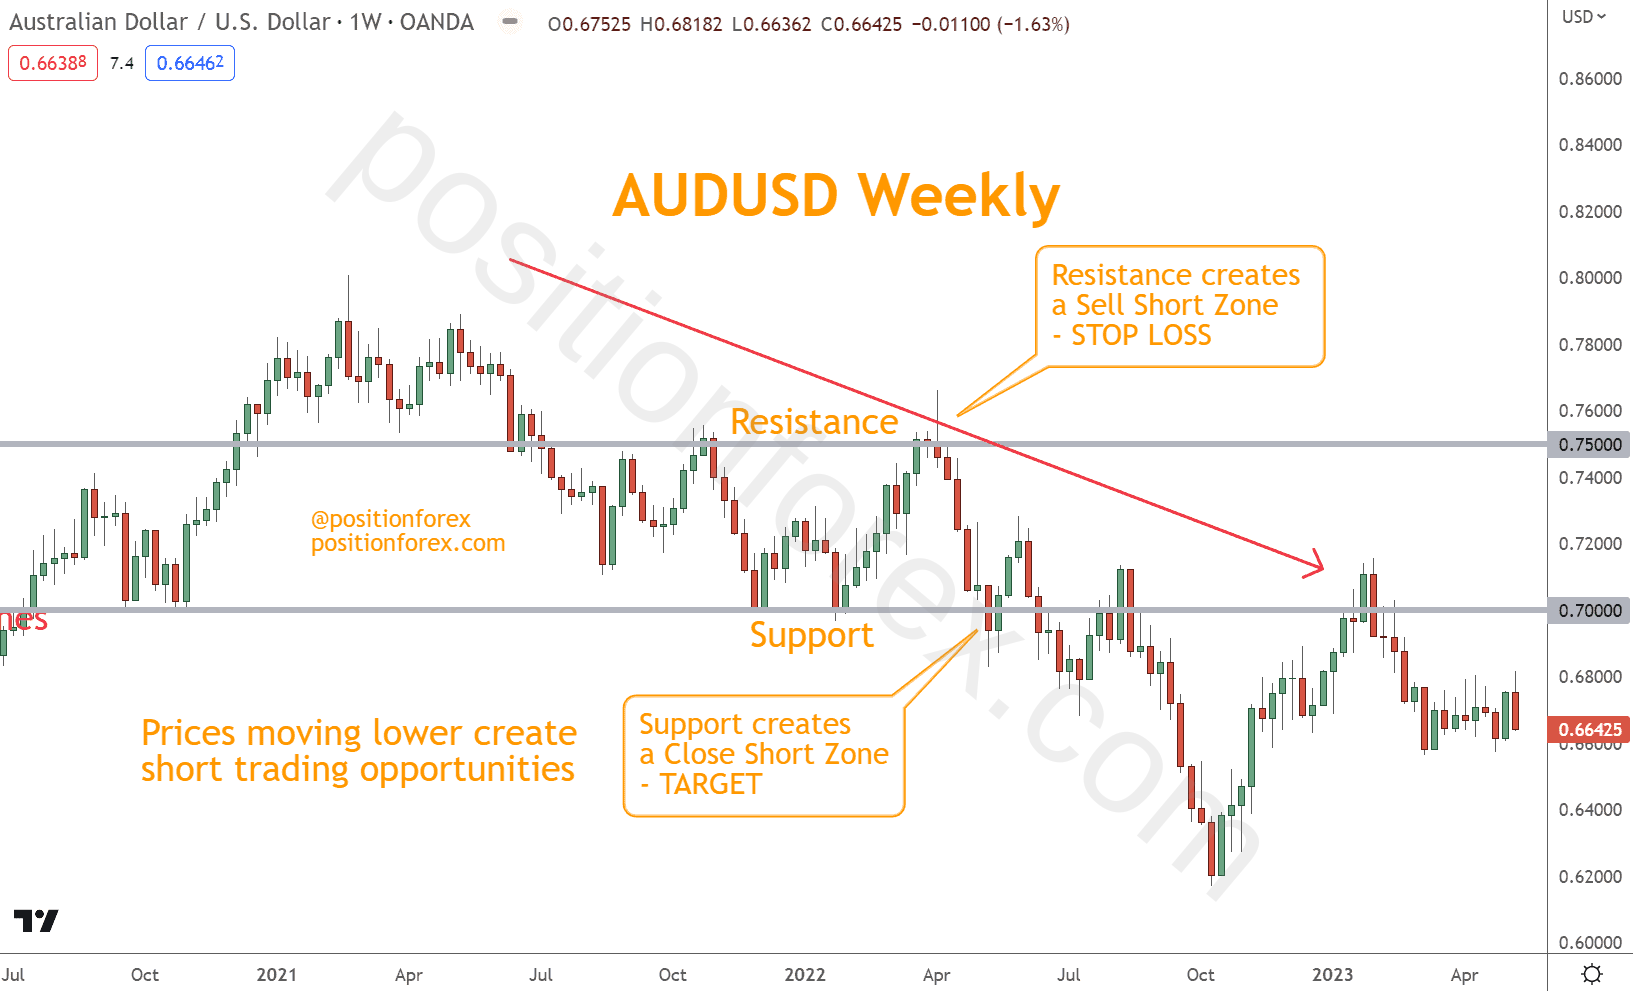
Support and resistance are key price zones where currency pairs have historically reversed.
They represent areas where buyers or sellers consistently enter the market, acting as “walls” that prices struggle to pass. These zones serve as the backbone of technical analysis.
You can use support/resistance for:
- Setting stop-loss and take-profit levels.
- Spotting trend reversals and breakout setups.
- Measuring risk-to-reward on trades.
Example: On the AUD/USD chart, 0.7500 acted as resistance, and 0.7000 as support.
Each zone was tested multiple times before the price reversed, confirming their importance.
Why Support and Resistance Define Market Psychology
When price repeatedly reacts to the same level, it reflects collective trader psychology.
A breakout or breakdown from these zones often signals a change in market sentiment.
Example: AUD/USD traded in a range until it broke below 0.7000 in June 2022.
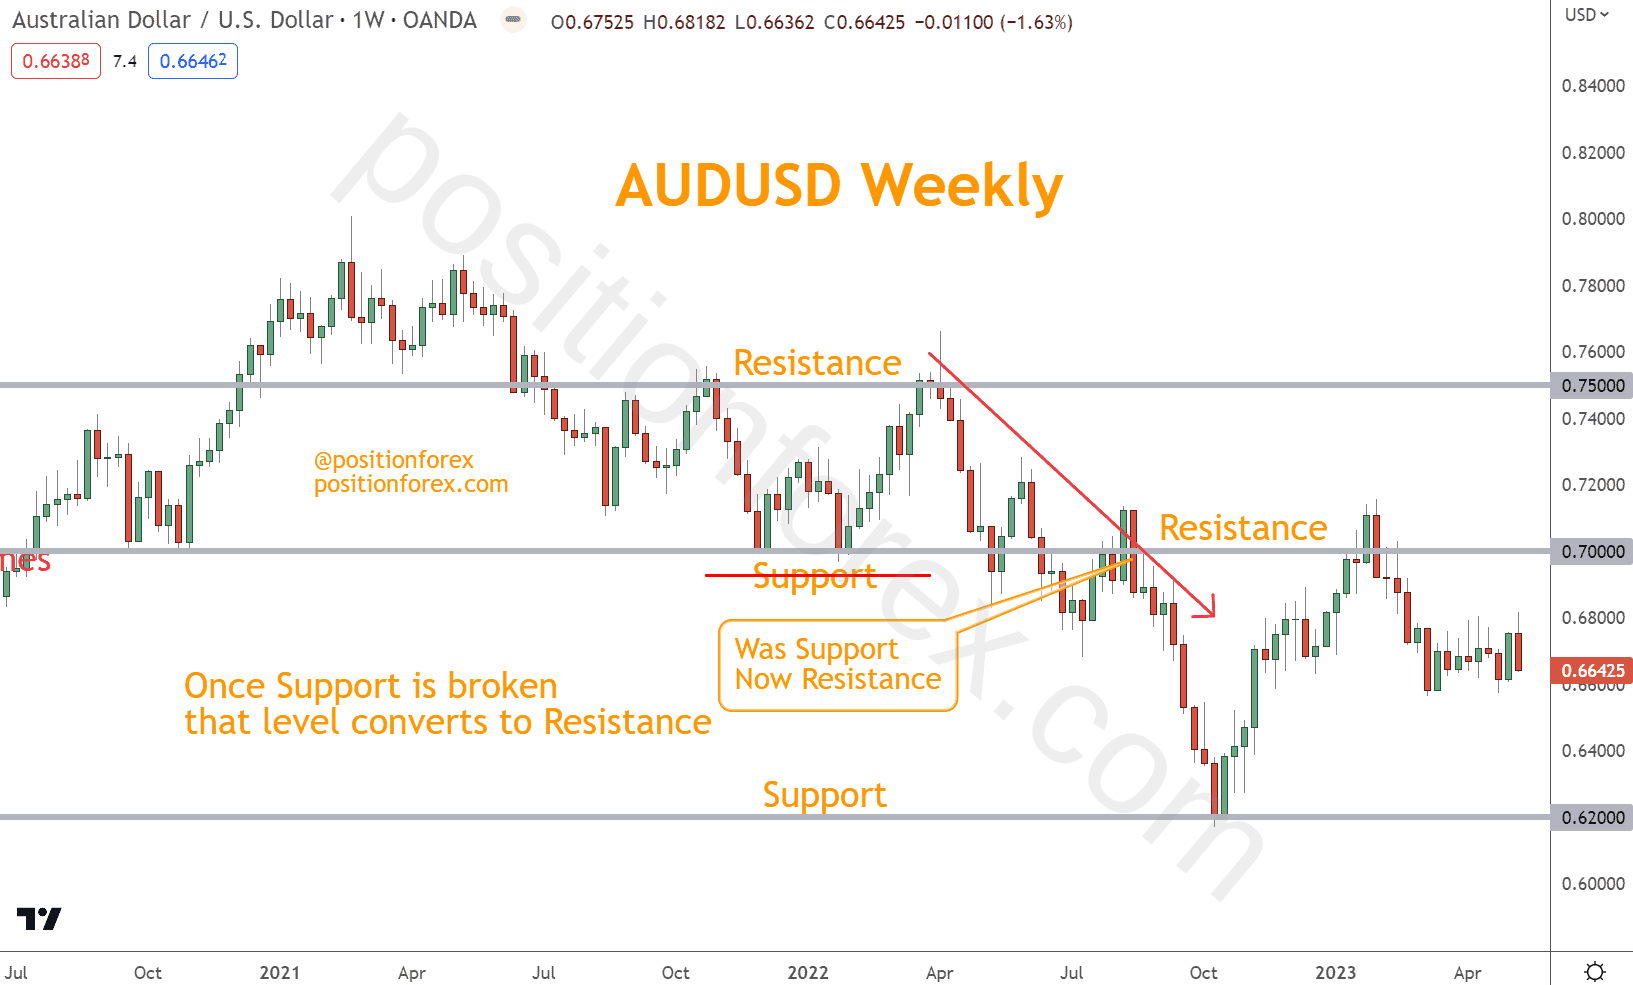
After the breakdown, that same 0.7000 level acted as resistance. This shift marked a change from neutral to bearish psychology.
Identifying and understanding these shifts lets you anticipate the next move and align with the market’s prevailing direction.
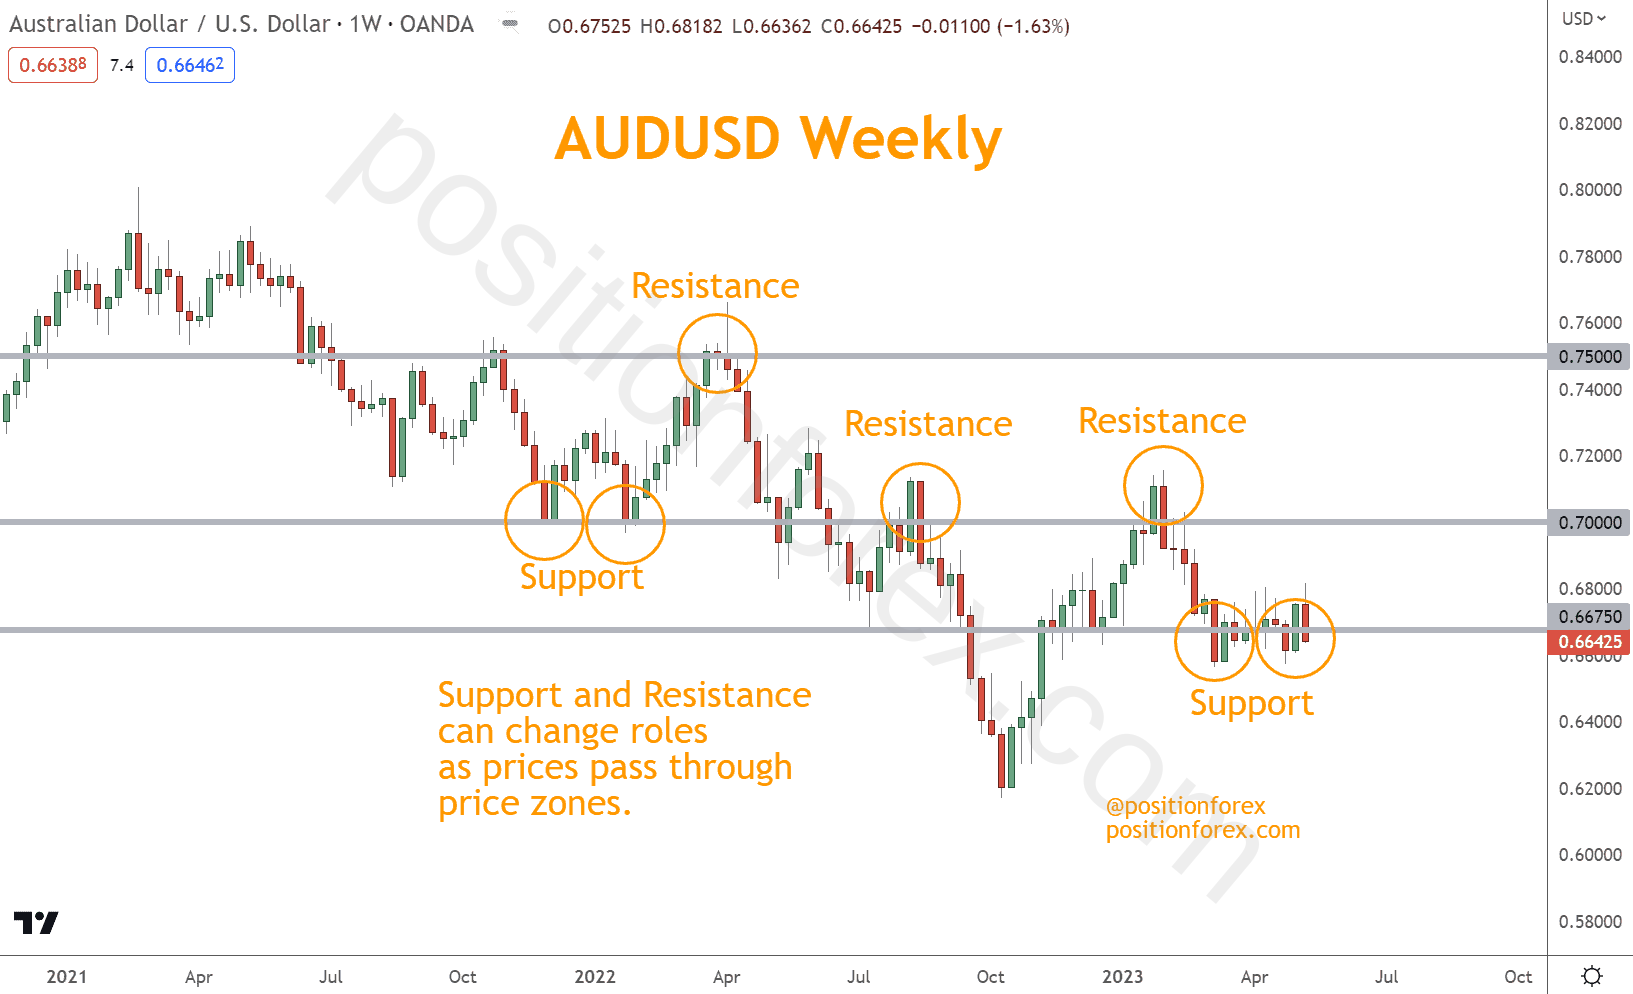
The Power of Horizontal Levels
Horizontal support and resistance zones are drawn at clear price points where the price has reversed multiple times.
They’re fixed levels that help you simplify your chart, make decisions faster, and improve timing.
AUD/USD Example:
- 0.7500 = Resistance in October 2021 and April 2022.
- 0.7000 = Support in November 2021 and January 2022, turned into resistance by August 2022.
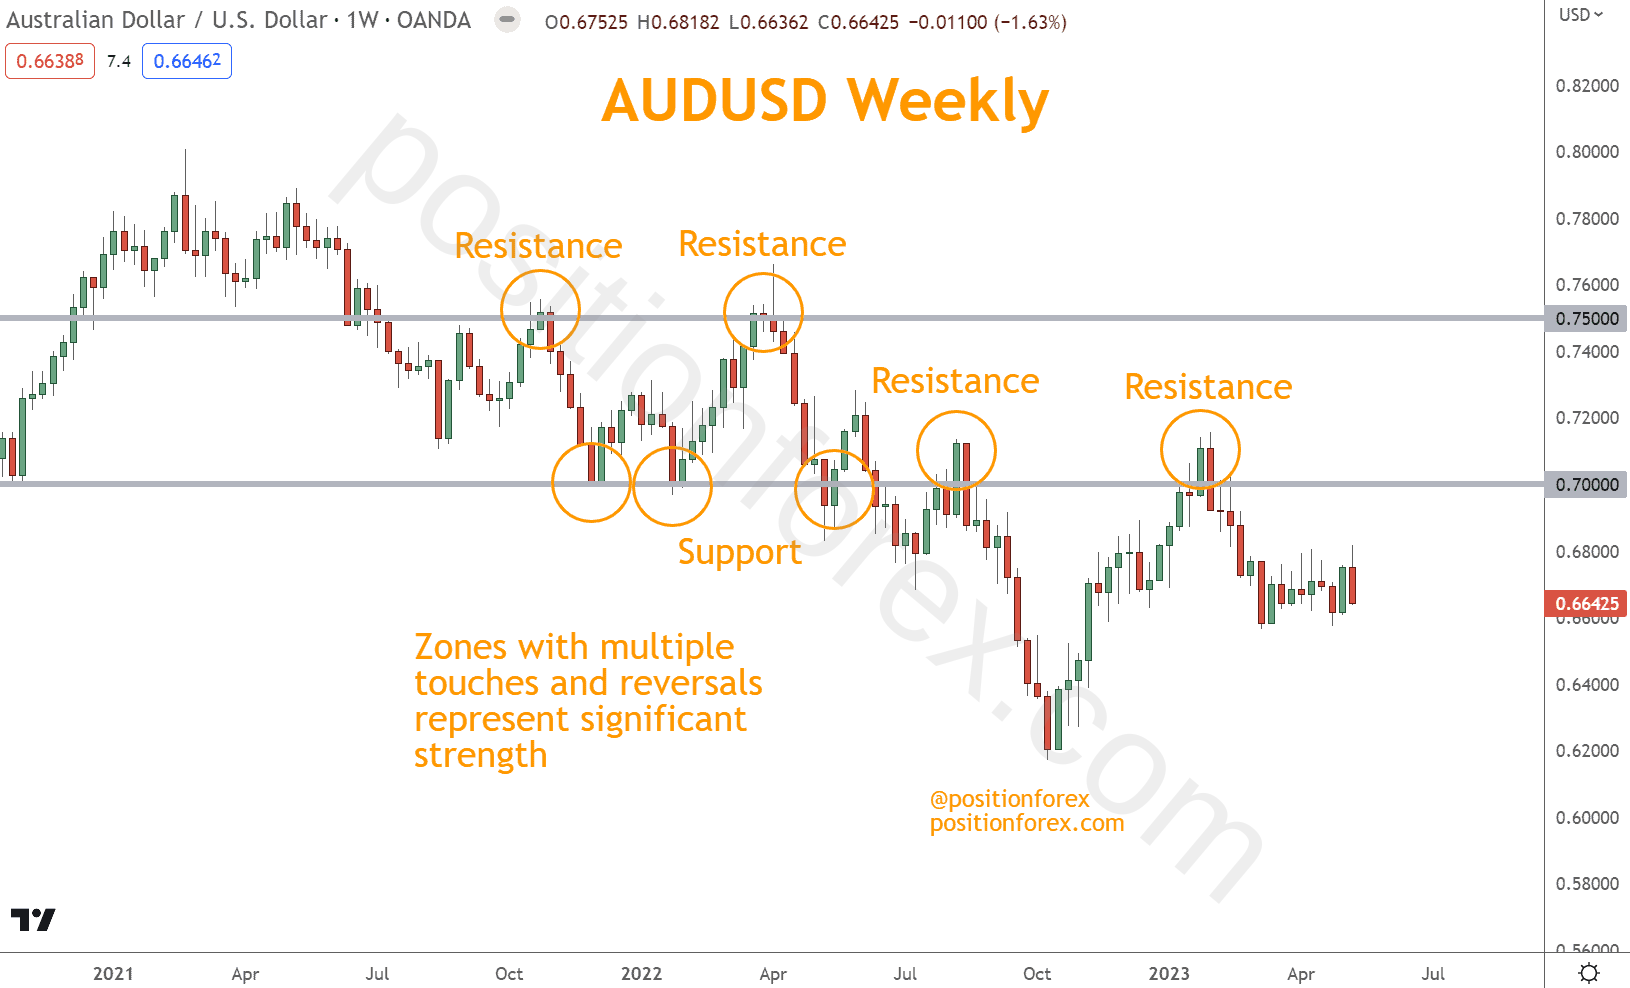
The longer and more frequently a level is tested and held, the stronger it becomes. Always treat these as zones, not exact price points, to account for volatility.
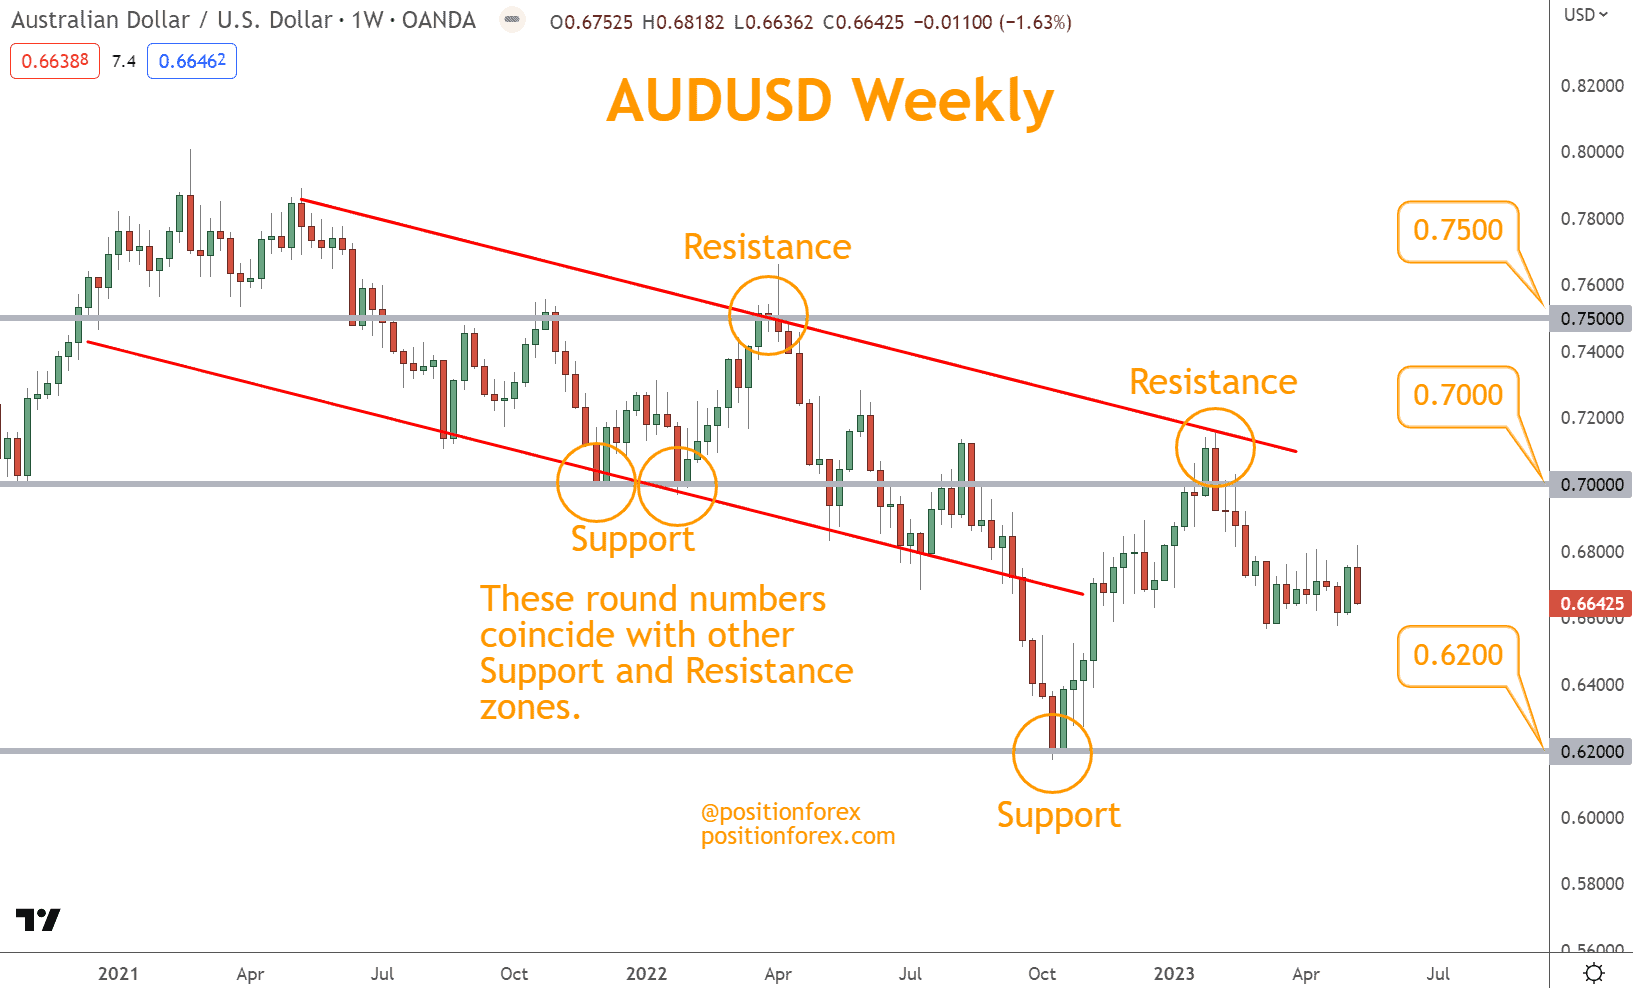
Channel Lines: Dynamic Support and Resistance Done Right
Channel lines follow price movement direction, connecting swing highs and lows to create rising or falling price corridors.
These act as dynamic zones where support and resistance shift over time but remain highly predictive when confirmed.
To draw a valid channel:
- Connect multiple swing highs for resistance.
- Connect multiple swing lows for support.
AUD/USD Example:
In a falling channel, short trades at the upper trendline (April 2022, January 2023) followed the dominant trend and produced solid setups.
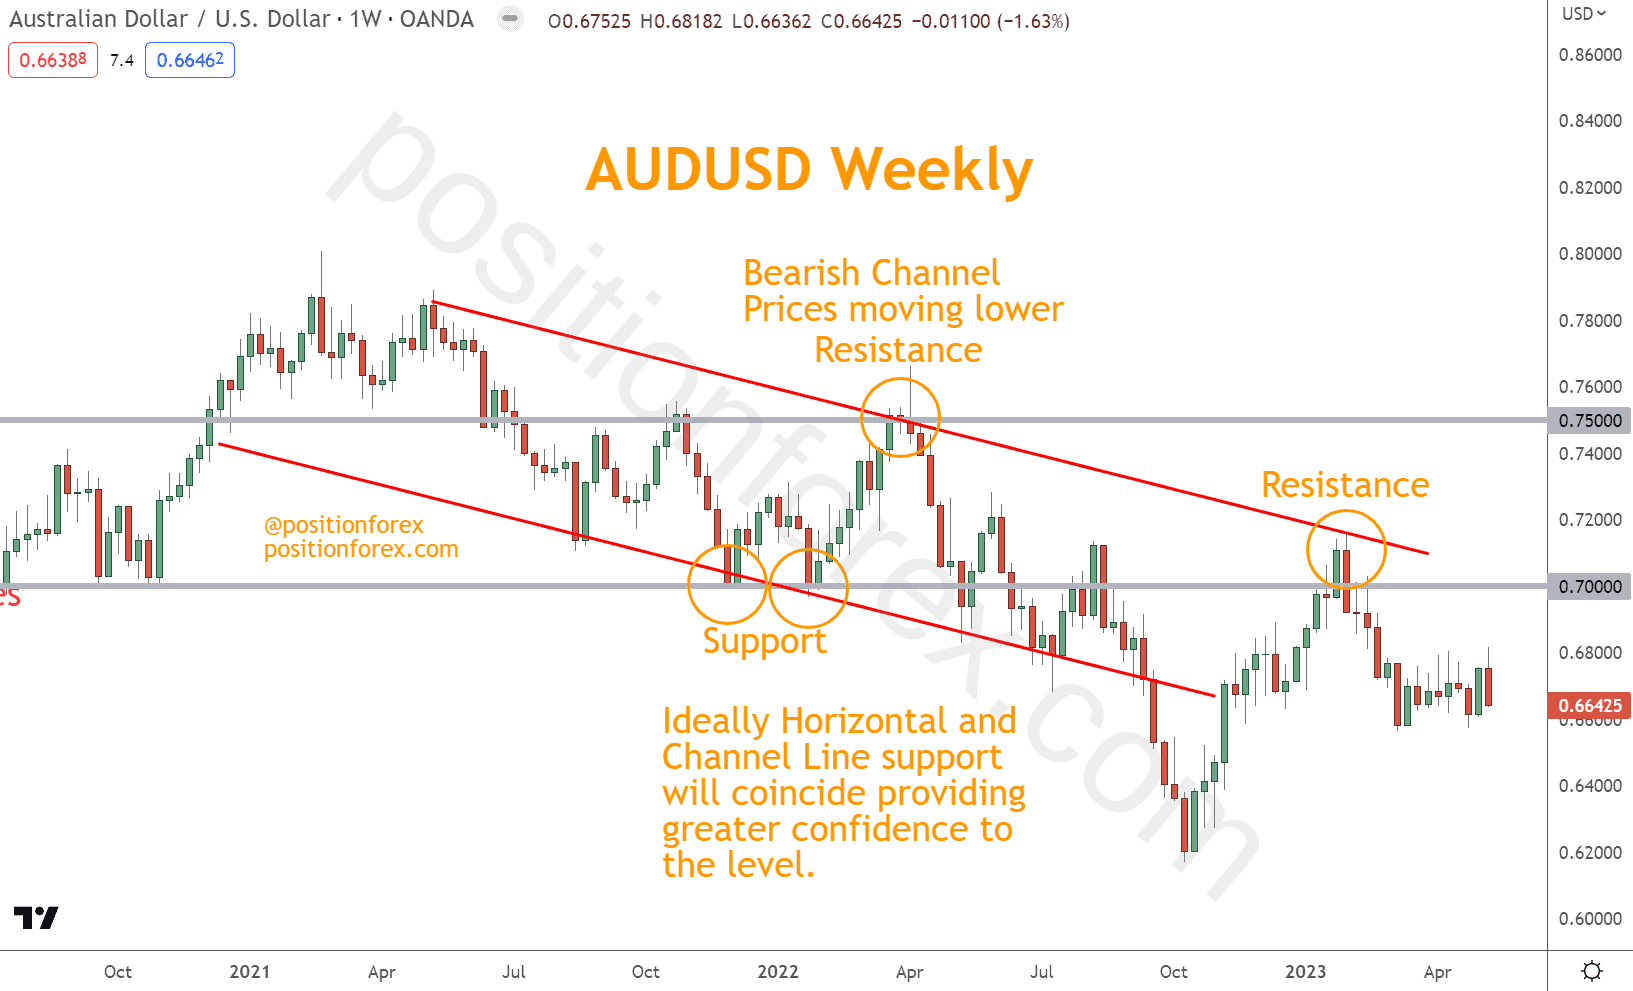
Countertrend buys at the lower trendline (August, November, and January 2022) carried higher risk.
When channel lines align with horizontal levels, the trade setup becomes significantly stronger.
Why Dynamic Moving Averages Fail as Support and Resistance
Some traders use moving averages (like SMA or EMA) as “dynamic” support and resistance.
However, they lack a structural basis in price action and frequently fail when volatility shifts.
Issues with Dynamic Levels:
- They don’t reflect actual supply/demand zones.
- Require arbitrary settings (e.g., 20, 50, 200 periods).
- Lag behind real-time price movement.
- It can mislead traders into thinking a structure exists where it doesn’t.
AUD/USD Example:
A 40-period SMA offered resistance in mid-2022 but was unreliable in most other areas.
Horizontal and channel lines provided clearer, more accurate reversal zones.
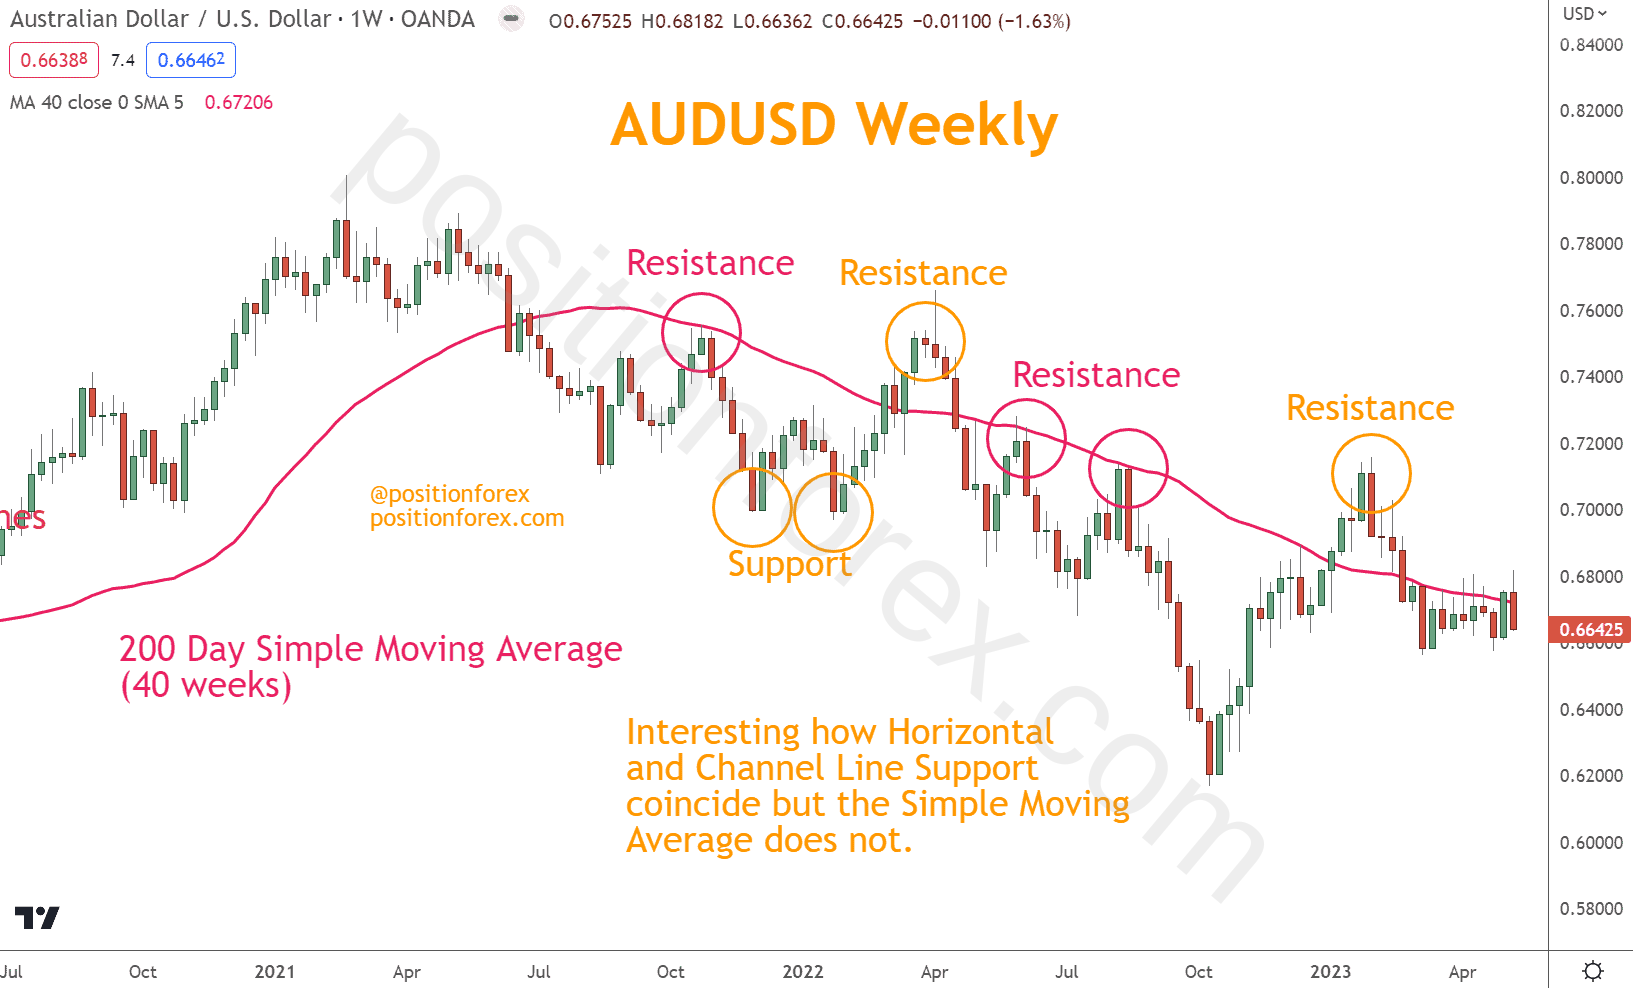
Stick to structural levels that price has respected—those are the zones real traders act on.
Looking for a Strategy?
Download the Six Basics of Chart Analysis and sign up for Forex Forecast to learn a bottom-up approach to analyzing Forex markets and weekly market updates.
How to Draw Support and Resistance Lines That Work
Here’s a step-by-step method to draw strong support and resistance levels:
- Identify Price Reactions: Look for areas with multiple reversals.
- Draw Horizontal Lines: Use closing prices or candle wicks that repeat.
- Check the Role Change: Levels often flip roles—support becomes resistance and vice versa.
- Combine with Channel Lines: Connecting swing highs/lows adds dynamic context.
- Validate with Price Action: Use candlestick formations or chart patterns to confirm.
AUD/USD Example:
The 0.7000 level switched from support to resistance, highlighting the importance of observing how levels evolve.
Higher Timeframe Confirmation (Yes, But With a Caveat)
Longer timeframes can reinforce the importance of a support/resistance level.
If a level holds on a weekly chart, it’s more significant than one seen only on a 5-minute chart.
However, for position trading, the weekly chart already serves as the primary timeframe.
Swing traders or intraday traders may benefit more from this higher timeframe confirmation.
Focus on levels that have:
- Held over weeks or months.
- Produced major reversals.
- Been tested across different timeframes.
Round Numbers and Psychological Levels
Psychological levels—such as 0.7500, 0.7000, or 0.6200—often attract buying or selling pressure.
These round numbers become natural magnets for orders and should be watched closely.
Use them only when they align with historical price action. Round numbers by themselves are not reliable unless confirmed by support/resistance or trend structure.
Best Practices for Applying These Tactics
Combine support and resistance tactics with additional technical tools like:
- Trend direction (higher highs/lows or lower highs/lows)
- Momentum indicators (RSI, MACD, TSI)
- Candlestick reversal patterns
- Chart patterns (e.g., Head and Shoulders, Double Top/Bottom)
This layered approach increases your confidence and helps filter out weak setups.
What’s the Next Step?
Use what you’ve learned to open a chart and mark key support and resistance zones.
Combine horizontal levels, channel lines, and confirmation tools like candlesticks and chart patterns to make well-informed decisions.
If you’re unsure how to begin, download the free guide: Six Basics of Chart Analysis.
You’ll also get the Forex Forecast, which includes trade ideas, case studies, webinars, and new educational content each week.
Get the Six Basics and Start Analyzing Like a Pro

Frequently Asked Questions
Do Support and Resistance Tactics Work in Forex?
Yes, when applied correctly and confirmed with price action, these zones are highly effective. But no single tactic should be used in isolation.
How Often Should I Check for New Levels?
Review support/resistance zones weekly to adjust for evolving market structure.
Can Support Become Resistance and Vice Versa?
Absolutely. A level’s role changes once it breaks and retests, depending on trader psychology.
Can I Use Support and Resistance Alone?
No. They’re best used alongside momentum indicators, candlesticks, and trend confirmation.
What About Pivot Points and Fibonacci?
Pivot Points are based on math, not price structure. Fibonacci can work, but it requires deeper analysis. This article focuses on tactics with higher reliability and simplicity.
Forex Trading Disclosure Statement
Risk Warning:
Forex trading involves significant risk and may not be suitable for all investors. The leveraged nature of Forex trading can work both for and against you, leading to substantial gains or losses. Before trading Forex, you should carefully consider your financial objectives, experience level, and risk tolerance. It is possible to lose more than your initial investment, and you should only trade with money you can afford to lose.
Market Risks and Volatility:
Forex markets are influenced by global economic, political, and social events, which can result in unpredictable price movements. High market volatility can lead to sudden and substantial changes in currency values, potentially causing losses that exceed your initial deposit.
Leverage Risks:
Leverage amplifies both potential gains and potential losses. While leverage can increase profitability, it also increases the risk of significant losses, including the loss of your entire trading capital.
Trading Tools and Technology Risks:
Forex trading platforms, including those offered by brokers, are subject to technology risks, such as system failures, latency issues, and potential errors in price feeds. Traders should be aware that these risks can impact the execution of trades and trading outcomes.
No Guarantee of Profitability:
Past performance in Forex trading is not indicative of future results. There is no guarantee that you will achieve profits or avoid losses when trading Forex. Market conditions and individual trading strategies vary, and no trading system can eliminate the inherent risks of Forex trading.
Educational Purposes Only:
Any information provided about Forex trading, including strategies, analysis, or market commentary, is for educational purposes only and should not be considered financial advice. Consult a qualified financial advisor or tax professional before making any trading decisions.
Regulatory Compliance:
Forex trading is regulated differently in various jurisdictions. Ensure that you are trading with a licensed and compliant broker in your country of residence.
Responsibility:
You are solely responsible for your trading decisions and the associated risks. You have to understand the terms and conditions of Forex trading, including margin requirements, stop-losses, and other risk management tools.
Acknowledgment:
By engaging in Forex trading, you acknowledge that you have read, understood, and accepted this disclosure statement. You assume full responsibility for the outcomes of your trading decisions and agree to trade at your own risk.